


|
BEA AquaLogic Service Bus provides a Smart Search feature, which is a powerful utility you can use for searching resources such as proxy services, business services, alert rules for service level agreements(SLA) violations, and alert destinations. You can use this utility to search for resources based on the various criteria regardless of your administrative privileges. For more information on the privileges of roles in AquaLogic Service Bus, see Roles in AquaLogic Service Bus.
You can also use results of a search to change the operational settings at the service level. But note for effectively enabling or disabling any operational setting, you must enable or disable the setting both at the global level and the service level. For more information, see Monitoring Services.
You can access Smart Search from the Configuration module of the Operations navigator bar (see Figure 4-1).
The following sections describe:
Basic Search helps you to search for resources using basic criteria such as resource type or the name of a resource. You can use the basic search functionality to find resources using the following basic criteria:
Type: This search criterion is optional. Use the Type drop-down list (see Figure 4-2) to specify the type of resource. You can search for the following types of resource:
| Note: | To view all the resources of a given type, choose the resource type in the Type drop-down list and click View All. |
Use the advanced search if you want to configure your search with additional criteria. To use these filters, click ![]() .
.
This section describes the following:
You can search for proxy services and business services in the AquaLogic Service Bus Console using filters in Smart Search. This section describes the following:
Figure 4-3 shows the filters you can use to search for All Services.
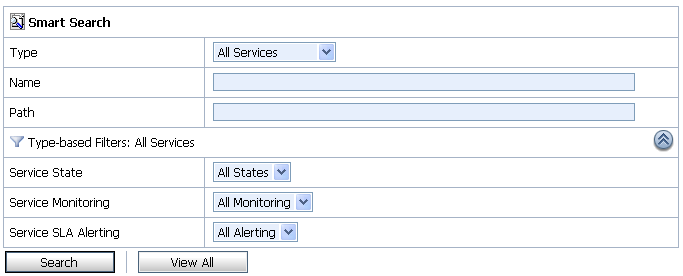
You can use the following filters to customize your search for both proxy services and business services:
Click Search to search all services using the set criteria or View All to view all the services.
You can view results of the search for proxy service and business service in the Summary of All Services table (see Figure 4-4).
Use this table to enable or disable services, monitoring, and SLA alerting for both business service and proxy services. You can also use this to enable or disable pipeline alerting, message reporting, and pipeline logging for proxy services. To enable or disable select the check box in the appropriate field and click Update. The runtime effects of these settings also depend on corresponding settings at the global level. For more information on Global Settings, see Configuring Operational Settings at a Global Level. You can update the information for one or more services concurrently using this table.

The following information is displayed for all services:
Click Reset to discard any changes in the summary table and refresh the page with currently stored settings.
| Note: | You can edit the operational settings depending on the privileges of your role. For more information on roles, see Roles in AquaLogic Service Bus. |
You can search for proxy services in the AquaLogic Service Bus Console using additional filters in Smart Search. This section describes the following:
Figure 4-5 shows the different types of filters you can use for Proxy Services.
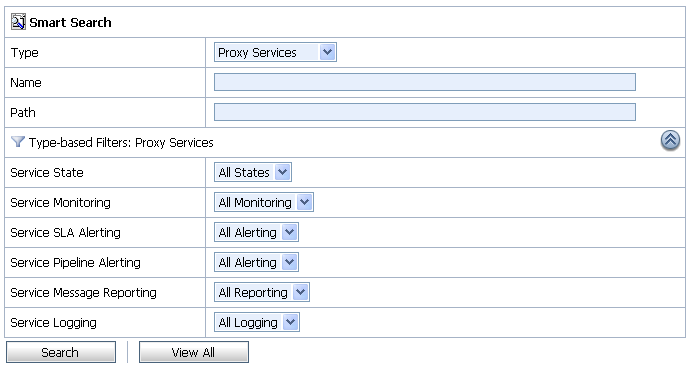
You can use the following filters to customize your search for proxy services:
Click Search to search all proxy services using the set criteria or View All to view all the services.
You can view results of the search for proxy service in the Summary of Proxy Services table (see Figure 4-6)
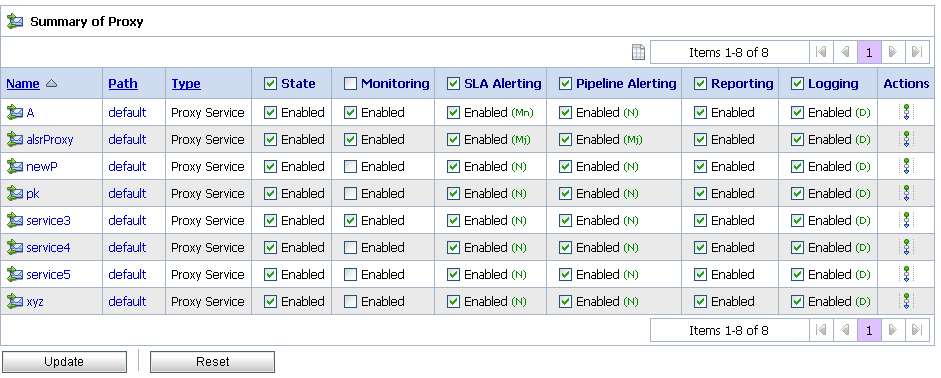
The Summary of Proxy Services view displays State, Monitoring, SLA Alerting, Pipeline Alerting, Reporting, Logging, Path, Type, Name, and Actions. For more information on the fields displayed in the summary of proxy services, see View and Edit Operational Settings.
Use this table to enable or disable proxy services, monitoring, and SLA alerting, pipeline alerting, message reporting, and pipeline logging. To enable or disable select the check box in the appropriate field and click Update. The runtime effects of these settings also depend on corresponding settings at the global level. For more information on Global Settings, see Configuring Operational Settings at a Global Level. You can update the information for one or more proxy services concurrently using this table.
Click Reset to discard any changes in the summary table and refresh the page with currently stored settings.
| Note: | You can edit the pipeline message flow depending on the privileges of your role. For more information on roles, see Roles in AquaLogic Service Bus. |
You can search for business services in the AquaLogic Service Bus Console using additional filters in Smart Search. This section describes the following:
Figure 4-7 shows the shows the different types of filters you can use for Business Services.
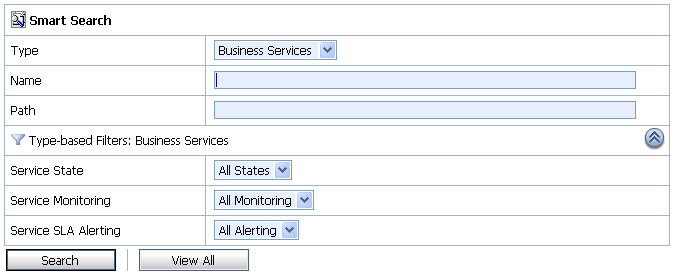
You can use the following filters to customize your search for business services:
Click Search to search all services using the set criteria or View All to view all the services.
You can view results of the search for business service in the Summary of Business Services table (see Figure 4-8).
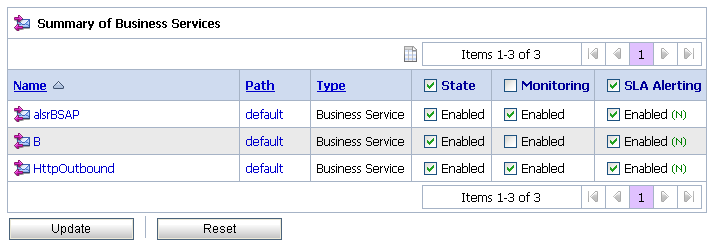
The Summary of Business Services view displays State, Monitoring, SLA Alerting, Name, Path, and Type. For more information on the fields displayed in the summary of business services, see View and Edit Operational Settings.
Use this table to enable or disable services, monitoring, and SLA alerting. To enable or disable select the check box in the appropriate field and click Update. The runtime effects of these settings also depend on corresponding settings at the global level. For more information on Global Settings, see Configuring Operational Settings at a Global Level. You can update the information for one or more business services concurrently using this table.
Click Reset to discard any changes in the summary table and refresh the page with currently stored settings.
| Note: | You can edit the operational settings for a business service depending on the privileges of your role. For more information on roles, see Roles in AquaLogic Service Bus. |
You can search for alert destinations in the AquaLogic Service Bus Console using additional filters in Smart Search. This section describes the following:
Figure 4-9 shows the shows the different types of filters you can use to search for Alert Destinations.
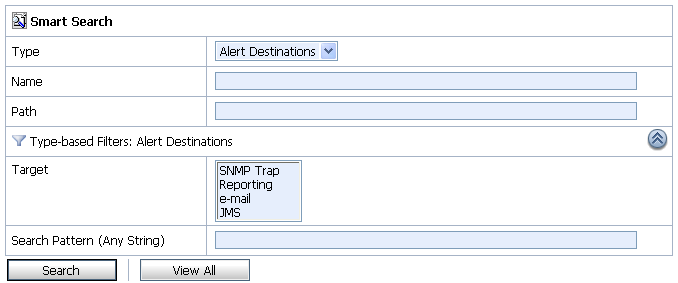
You can use the following filters to customize your search for alert destinations:
Click Search to search all alert destinations using the set criteria or View All to view all the alert destinations. For more information on alert destinations, see Understanding Alert Destination.
You can view results of the search for alert destinations in the Summary of Alert Destinations table (see Figure 4-10).
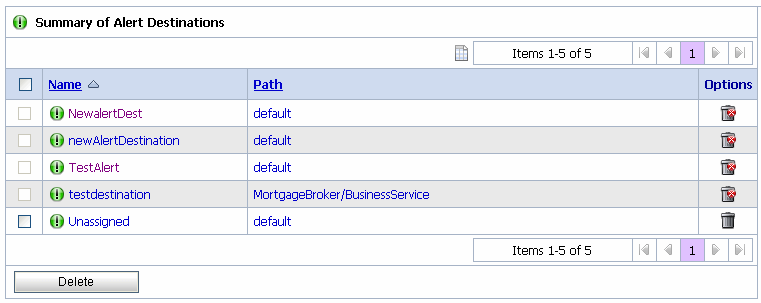
The following information is provided in the Summary of Alert Destination table:
You can delete one or more alert destination concurrently using this table.To delete an alert destination click the check box associated with the alert destination and click Delete.
| Notes: |
You can search for SLA Alert Rules in the AquaLogic Service Bus Console using additional filters in Smart Search. This section describes the following:
Figure 4-11 shows the shows the different types of filters you can use when you search for SLA alert rules.
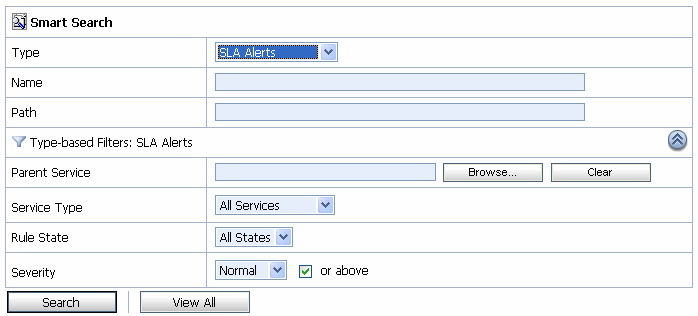
You can use the following filters to customize your search for SLA ALert Rules:
Click Search to search all services using the set criteria or View All to view all the services.
| Note: | Select the or above check box to restrict your search to the specified severity level or above (listed from the most inclusive to the most restrictive level): Normal, Warning, Minor, Major, Critical, and Fatal. For example, to search for alert rules with severity levels equal to Major, Critical, and Fatal set severity equal to Major and click the check box associated with “or above”. |
You can view results of the search for SLA alert rules in the SLA Alert Rules table (see Figure 4-12). You can update the information for one or more alert rule concurrently using this table. To enable or disable the alert rule select the associated check box and click Update.
Click Reset to discard any changes in the summary table and refresh the page with currently stored settings.
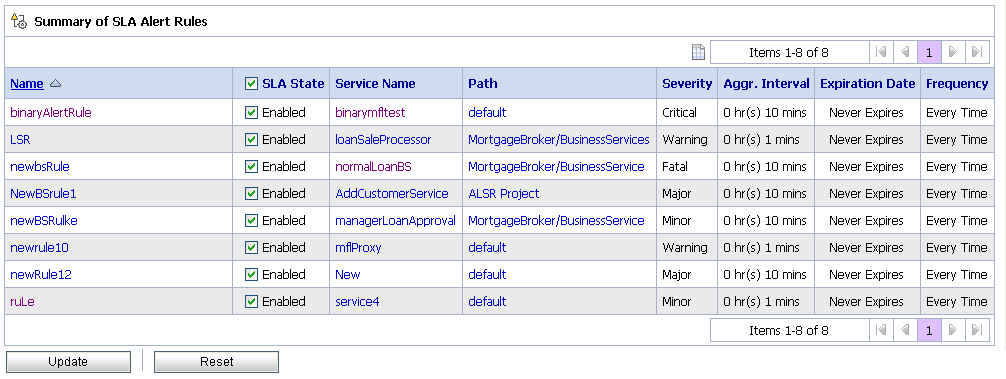
The following information is displayed in the SLA Alert Rules Summary table:
The name assigned to this alert rule. The name is a link to the View Alert Rule Details page. For more information, see Understanding Alert Rule Details.
|
|||
|
|||
|
|||
| Note: | You can enable or disable an alert rule depending on the privileges of your role.For more information on roles, see Roles in AquaLogic Service Bus. For more information on enabling and disabling alert rules, see Monitoring Services. |


|