


|
The capacity planning process involves several activities. The following sections describe these activities:
| Note: | The tests described in this guide were conducted in a controlled environment; the numbers presented here may not match the results that you get when you run the tests in your environment. The numbers are meant to illustrate the capacity planning process. |
The following are some of the performance-related design issues that architects and developers should keep in mind while designing WLI applications:
You must use only process controls (not service controls) to invoke subprocesses. Service controls are recommended for invoking only web services and JPDs in a different server or cluster. Using process control does not incur the overhead of a web service stack, unlike service control which has more CPU and input/output cost.
Process control callbacks are faster than message broker subscriptions because process control callbacks are routed directly to the JPD instance. Message broker subscriptions with a filter involve database access to map the filter value to the process instance.
| Note: | Dynamic subscriptions offer loose coupling. So you can use dynamic subscription instead of process control callback in design scenarios where loose coupling is required. |
By design, if your process becomes stateful and the operation does not require the state to be persisted in the database, consider changing the persistence flag to Never or Overflow.
| Note: | Persistence set to Never or Overflow might not work properly in a cluster. |
Accessing worklists through worklist APIs is faster than accessing them through WLI JPD controls. However, controls are easier to use and program. Accessing the worklist directly through the API avoids the overhead of control runtime as controls internally use worklist APIs.
Stateless JPDs are executed in memory and the states are not persisted; therefore, they provide better performance than stateful JPDs. In a scenario where you do not need information about the previous state of a process, use stateless JPDs. There is no input/output cost for stateless JPDs as the state is not persisted. Stateless JPDs are inherently more scalable.
For an asynchronous process, if the callback location is a WLS JMS queue and is same for all instances of the process, WLI performance is affected under high load conditions.
An asynchronous process has some latency cost. Consider a task that requires a few hundred milliseconds for completion.
In general, asynchronous processing provides tremendous value for lengthy processes. Synchronous processing, on the other hand, is better suited for tasks that are expected to take less time. However, there could be applications in which a synchronous process is blocking, which could be a significant bottle neck, that in turn causes the server to use many more threads than neccessary.
| Note: | For more information about design considerations that may affect performance, see Best Practices for WebLogic Integration and WLI Tuning. |
Performance of a WLI application depends not just on the design of the application, but also on the environment in which it runs.
The environment includes the WLI server, the database, the operating system and network, and the JVM. All of these components should be tuned appropriately to extract good performance from the system.
Appropriate settings should be made for parameters such as JDBC data sources, weblogic.wli.DocumentMaxInlinSize, process tracking level, B2B message tracking level, and Log4j. For more information, see
WLI Tuning.
This includes defining settings for initialization parameters, generation of statistics, disk I/O, indexing, and so on. For more information about tuning the database, see Database Tuning Guide.
Proper tuning of the OS and the network improves system performance by preventing the occurrence of error conditions. For more information, see “Operating System Tuning” in WebLogic Server Performance and Tuning.
The JVM heap size should be tuned to minimize the time that the JVM takes to perform garbage collection and maximize the number of clients that the server can handle at any given time. For more information, see “Tuning Java Virtual Machines” in WebLogic Server Performance and Tuning.
Certain minor changes may need to be made in the application for running the performance tests and for invoking the application through load generator scripts.
The extent of change depends on the nature of the application, capability of the load generator, and the outcome that is expected from the capacity planning process.
Following are examples of the changes that may be required:
The quality of the result of any performance test depends on the workload that is used.
Workload is the amount of processing that the system is expected to complete. It consists of certain applications running in the system with a certain number of users connecting to and interacting with the system.
The workload should be designed so that it is as close to the production environment as possible.
In addition, users may require think time, which is the time required by users to think about possible alternatives and take decisions before triggering an action in the system.
A WLI application that has three types of clients – web services, JMS, and file – may, for example, have a user profile as shown in the following figure.
The following parameters must be considered while designing the workload:
The next step is to define the unit of work and SLA.
A Service Level Agreement (SLA) is a contract – between the service provider and service consumer – that defines acceptable (and unacceptable) levels of service. The SLA is typically defined in terms of response time or throughput (transactions per second).
For systems of synchronous nature, the aim is to tune the system that achieves highest throughput while meeting the response time (realistically, for about 95% of the transactions). The response time thus becomes the SLA. For systems of asynchronous nature, throughput or messages per second is the SLA.
For capacity planning purposes, it is important to define the unit of work (that is, the set of activities included in each transaction), before using it to define the SLA.
Consider the purchase order application shown in the following figure.
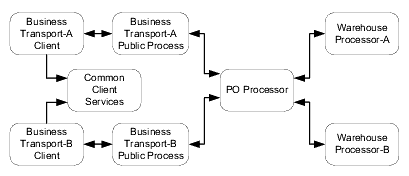
Each node is a JPD. All of these JPDs are required for processing the purchase order. In this scenario, the unit of work (transaction) can be defined as either of the following:
It is recommended that the entire flow of business operations, rather than each JPD, be considered a single unit of work.
The next step is to design the load generation script.
A load generation script is required to load the server with the designed workload while running the tests.
| Note: | For information about running the tests, seeRun Benchmark Tests and Run Scalability Tests. |
While writing the load generation script, you should keep the following points in mind:
The load level becomes easier to understand and manage, when you limit each simulated user to a single in-flight request,. If the rate at which requests are sent is not controlled, requests may continue to arrive at the system even beyond the flow-balance rate, leading to issues such as queue overflow.
The following figure depicts a single user sending the next request only after the previous request is processed by the server.

With this approach, the arrival rate (load) on the system can be increased by increasing the number of concurrent users, without affecting the system adversely; therefore, the capacity of the system can be measured accurately.
The following figure depicts a single user sending new requests without waiting for the server to finish processing previous requests.
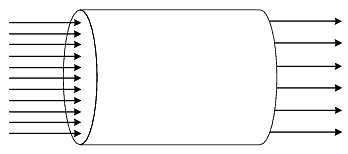
This approach could cause issues such as queue overflow and lead to misinterpretation of capacity.
A balanced load generation script is recommended.
The test environment should be configured as described in this section to ensure that the results of the tests are reliable and not affected by external factors.
Benchmark tests help in identifying system bottlenecks and tuning the system appropriately.
The tests involve increasing the load on the system, in gradual steps, till the throughput does not increase any further.
| Note: | For the purpose of benchmark tests, load is any aspect of the WLI application under test – number of concurrent users, document size, and so on – that demands system resources. |
| Note: | The load should be increased gradually to ensure that the system has adequate warm-up time. |
| Note: | Benchmark tests are run with no think time and with a single WLI machine. |
When the throughput stops increasing, one of the following may have occurred:
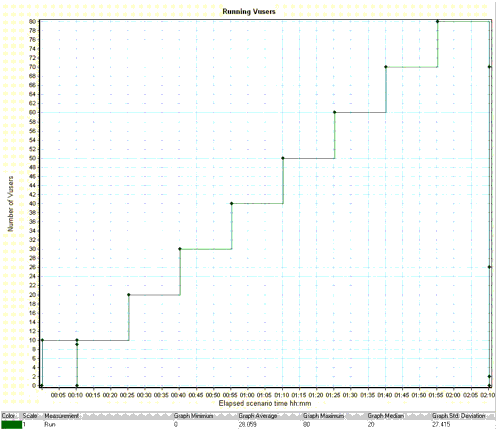
The following figure depicts a Mercury LoadRunner ramp-up schedule in which the initial 10 minutes are for warm-up tests with 10 concurrent users. Subsequently, the load is increased at the rate of 10 additional users every 15 minutes.
The following data must be recorded while running the tests:
Use tools such as Mercury LoadRunner and The Grinder for emulating users and capturing metrics.
The following figure shows the result of a benchmark test.
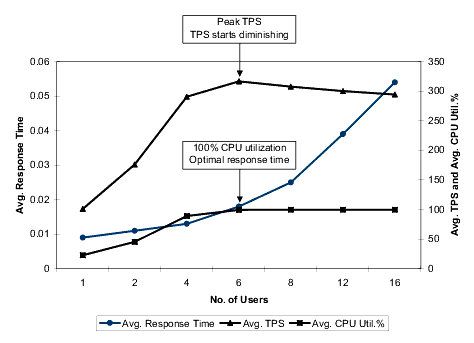
As users are added, the average TPS increases. When utilization of one of the hardware resources (in this case, CPU) reaches 100%, the average TPS peaks. The response time at this point is the optimal result. When further users are added to the system, the TPS starts diminishing. TPS rises in a near linear fashion as an increasing load is applied until the system is saturated due to a CPU or input/output constraint, then it levels off and begins to fall. Response times rise in a near linear fashion until the saturation point is reached, and then increases in a non-linear fashion.
This pattern of results indicates a system and typical behavior where resources are utilized to the maximum.
The next activity in the capacity planning process is to validate the results of the benchmark tests.
Before analyzing the test results, you must validate them using Little’s Law, to identify bottlenecks in the test setup. The test results should not deviate significantly from the result that is obtained when Little’s Law is applied.
The response-time formula for a multi-user system can be derived by using Little's Law. Consider n users with an average think time of z connected to an arbitrary system with response time r. Each user cycles between thinking and waiting-for-response; so the total number of jobs in the meta-system (consisting of users and the computer system) is fixed at n.
n is the load, expressed as the number of users; z + r is the average response time, and x is the throughput.
| Note: | Maintain consistency in defining units. For example, if throughput is expressed in TPS, response time should be expressed in seconds. |
While interpreting the results, take care to consider only the steady-state values of the system. Do not include ramp-up and ramp-down time in the performance metrics.
When the throughput saturates, utilization of a resource – CPU, memory, hard disk, or network – must have peaked. If utilization has not peaked for any of the resources, analyze the system for bottlenecks and tune it appropriately.
If no resource bottlenecks exist at the point when throughput saturates, bottlenecks could exist in the application and system parameters. These bottlenecks could be caused by any of the following:
Ensure that the operating system and network parameters are tuned appropriately. For more information, see WebLogic Server Performance and Tuning.
A system can be considered scalable, when adding additional hardware resources consistently provides a commensurate increase in performance. Such a system can handle increased load without degradation in performance. To handle the increased load, hardware resources may need to be added.
Applications can be scaled horizontally by adding machines and vertically by adding resources (such as CPUs) to the same machine.
The following table compares the relative advantages of horizontal and vertical scaling:
When an application needs to be scaled, you may opt for horizontal scaling, vertical scaling, or a combination, depending on your requirements.
The following figure shows a comparison between WLI running on a single non-clustered 4-CPU machine (vertical scaling) and on two clustered 2-CPU machines (horizontal scaling).
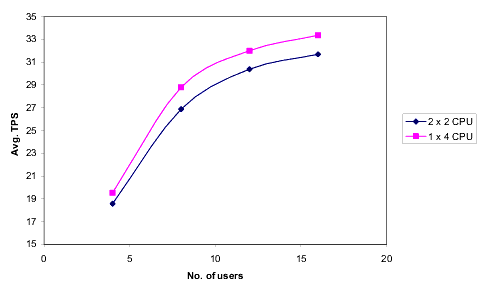
Performance in the horizontal scaling scenario (two 2-CPU machines) is slightly lower than in the vertical scaling scenario (single 4-CPU machine) due to additional load balancing and clustering overhead in the horizontal scaling scenario. However, you can add additional machines to increase the capacity of the horizontally scaled system. This is not possible with a vertically scaled system.
Scalability tests help you find out how the application scales when additional resources are added in the system – horizontally and vertically. This information is useful for estimating the additional hardware resources required for a given scenario.
The scalability test involves increasing the load, in gradual steps, till the SLA is achieved or the target resource utilization is reached, whichever occurs first.
| Note: | In contrast, benchmark tests involve increasing the load till the throughput stops increasing. |
For running scalability tests, the workload should be designed to emulate, as closely as possible, the production scenario. If no human user interaction is necessary and if the process invocations happen programmatically, it is recommended that you use a zero-think-time approach, similar to the approach for benchmark tests.
If the target resource utilization level is reached before the SLA is achieved, additional resources must be added to the system. The additional resources (vertical scaling) or machines (horizontal scaling) must be added in the order 1, 2, 4, 8, and so on.
| Note: | A minimum of three data points must be used to derive the equation for estimating capacity. |
All the data that was recorded while running benchmark tests must be captured while running the scalability test. For more information, see Run Benchmark Tests.
| Note: | Only the data that is recorded when the resource utilization is closest to the target level must be used to estimate the additional resource requirement. |
After running the test, validate and analyze them as described for benchmark tests, and then, if required, estimate the additional resource requirement as described in the next section.
A Capacity Plan helps estimate the current and future resource requirements for the current SLA and for future loads. You need to create the load model of the system in order to create a capacity plan.
The test results provide the data points to create this load model. You can derive an equation for the curve obtained from the test results, and use it to estimate the additional hardware resources that are required. Use techniques such as linear regression and curve fitting to predict the required resources. You can implement these techniques using spreadsheet applications such as Microsoft Excel.
| Note: | The accuracy of the prediction depends on the correctness of the load model. The load model should be based on each relevant resource for your application such as CPU. |
| Note: | You can also validate the model against the available historical performance data. |
The following figure shows the results of a horizontal scalability test.
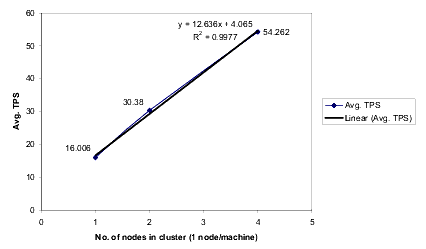
The graph shows the average number of transactions per second (TPS) at 70% CPU utilization for clusters with varying number of nodes.
For the results of this scalability test, a linear equation is the best fit. In a best fit curve, R2 must approach unity (the value, 1).
The equation is y = 12.636x + 4.065, where y is the average TPS and x is the number of nodes.
| Note: | Though adding additional resources horizontally or vertically can result in a higher TPS, this may not be useful if the objective is to achieve a certain response time. In such cases, consider using faster CPUs. |
Based on the results of the scalability tests and the tuning that is necessary for achieving the required results, you should configure the application for deployment to the production environment.
| Note: | If the resources that you decide to purchase for the production environment are not of the same type or model as those used for the scalability tests, you can estimate the resource requirement by using the following formula: |
| Note: | E x T1 / T2 |
| Note: | E = Estimation from scalability tests |
| Note: | T1 = SPECint rate of the machine on which the test was executed |
| Note: | T2 = SPECint rate of the machine that you want to purchase |
| Note: | This formula is applicable only if the scaling is based on number of CPUs. |
| Note: | The extrapolation using SPECint rate is only an approximation. The Capacity Planning exercise is best conducted with the same hardware and configuration as the production environment. For more information about SPECint rates, see http://www.spec.org. |


|