27 Building a Matrix with Group Above Report
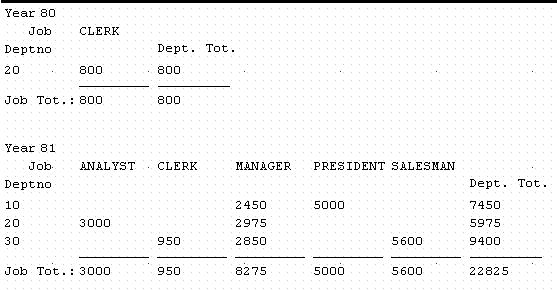
In this chapter, you will learn about nested matrix with group above reports. By following the steps in this chapter, you can generate the report output shown in Figure 27-1.
Figure 27-1 Matrix with group above report output

Description of "Figure 27-1 Matrix with group above report output"
-
A matrix with group above report is a combination of a matrix and a group above report layout. Essentially, a matrix report is printed for each master group record. A matrix with group is similar to the multiquery nested matrix, except that in a matrix with group report, the parent exists above the cross product. In a multiquery nested matrix report with groups, the parent/child relationship exists within the across or down dimension of the cross product.
-
For additional conceptual information, see Section 2.1.8, "About matrix with group reports".
This example of a matrix with group above report uses one query and at least five groups. At least one group is placed above the cross product to serve as the Master group.
This report uses the Matrix with Group layout style.
In this example, you will create report that cross tabulates salaries by department and by job for each year. The result is a group report where year is the master and the detail is a matrix with job functions listed across the top, departments down the side, and sums of salaries in the cells. Thus, you can quickly determine the sum of all of the salaries for clerks in department 20 for any particular year.
As you build this example report, you will:
-
Create a Matrix Group Data Model and Layout for a single query.
-
Create a Web Layout without changing the paper layout.
To see a sample matrix with group above report, open the examples folder named matrixgroup, then open the Oracle Reports example named matrixgroup.rdf. For details on how to access it, see "Accessing the Example Reports" in the Preface.