6 Using Dashboards in Oracle Business Process Management Workspace (Process Workspace)
This chapter contains these topics:
6.1 Using Standard Dashboards
Standard dashboards are the graphs and drill-downs based on data previously computed in a process cube schema. They reflect the standard metrics gathered during the execution of a process.
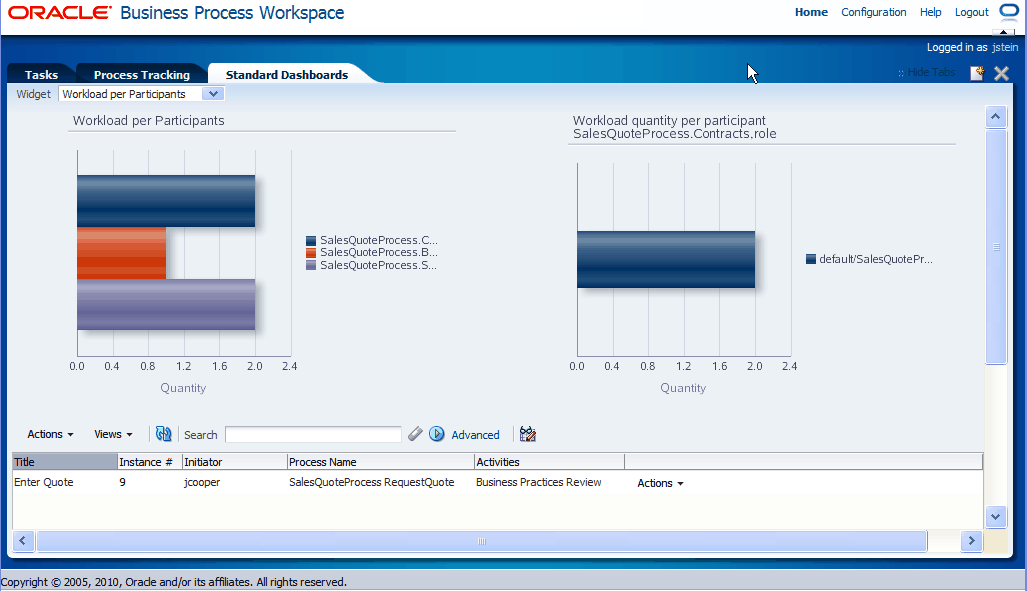
Figure 6-1 shows an example of a participant workload dashboard.
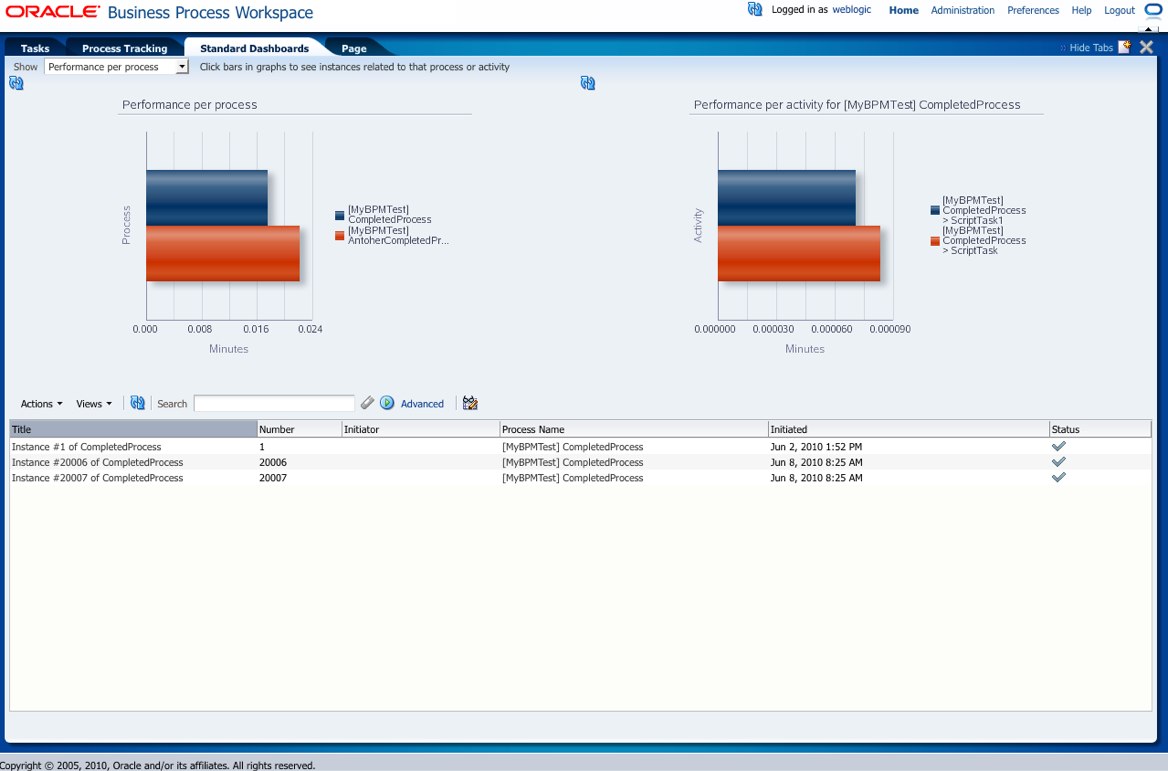
In each of the standard dashboards, clicking a bar graph in the left pane causes data to be displayed graphically in the right pane. Clicking an item in the right pane displays certain data in the lower pane. This section explains how each type of dashboard operates.
This section contains these topics:
6.1.1 Participant Dashboards
Two types of standard participant dashboards enable you to analyze:
-
The workload of participants
-
The performance of participants
6.1.1.1 Participant Workload Dashboard
The left panel of a participant workload dashboard displays the total number of active instances waiting for completion for each participant across all processes. When you drill down into the chart for a specific participant, the right panel displays the total number of active instances waiting for completion by process for either the selected participant or the selected role. The last drill-down displays the active instances waiting for completion for either the selected participant or the selected role and process.
Note:
In this release, participant information in a workload dashboard is for the physical role corresponding to the swimlane for the task. When the swimlane role is not defined, the corresponding participant information is null.6.1.1.2 Participant Performance Dashboard
The left panel of a participant performance dashboard displays the average time taken by participants across all processes. When you drill down into the chart for a specific participant, the right panel displays the average time taken to complete instances by process for the selected participant. The last drill-down displays the list of completed instances for either the selected participant or the selected role and process.
Note:
In this release, for processes that have user tasks with multiple users, user information is captured only for the last user that updated the task.6.1.2 Process Dashboards
Two types of standard process dashboards enable you to analyze:
-
The number of process instances waiting for completion
-
The average time taken per process
6.1.2.1 Process Workload Dashboard
The left panel in the process workload dashboard displays the total number of active instances waiting for completion per process. When you drill down into a specific process, the right panel displays the total number of active instances waiting for completion for activities in the selected process. The last drill-down displays the active instances waiting for completion for the selected activity and process.
6.1.2.2 Process Performance Dashboard
The left panel in the process performance dashboard displays the average time taken per process. When you drill down into a specific process, the right panel displays the average time taken to complete by activities in the selected process. The last drill-down displays the completed instances for the selected activity and process.
Figure 6-2 shows a process performance dashboard.
6.2 Creating Custom Dashboards
As with standard dashboards, custom dashboards are the graphs and drill-downs based on data previously computed in a process cube schema. They reflect the standard and user-defined metrics gathered during the execution of the process. They enable you to define new graphs using both standard metrics and user-defined metrics specified by using business indicators.
For instructions about adding a custom dashboard, see Section 5.1.1, "How to Create a Custom Page".
6.2.1 Specifying Graph Content
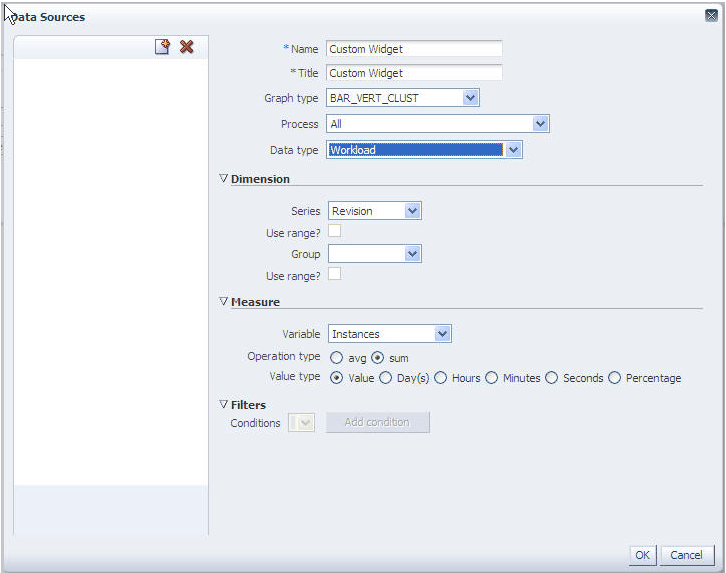
Graph content is specified by defining a data source. Figure 6-3 shows an example of the Data Sources dialog box.
For information about invoking the data source dialog box, see Section 5.1.3, "How to Add a Dashboards Panel to a Customized Page."
In the Data Sources dialog box, specify the following:
-
Name: Provide a data source identifier
-
Title: Provide the title used while displaying the data source
-
Graph Type: Select one of the following list of graph types:
-
-
AREA_VERT_PERCENT
-
AREA_VERT_ABS
-
AREA_VERT_STACK
-
BAR_HORIZ_CLUST
-
BAR_HORIZ_PERCENT
-
BAR_HORIZ_STACK
-
BAR_VERT_CLUST
-
BAR_VERT_FLOAT_STACK
-
BAR_VERT_PERCENT
-
BAR_VERT_STACK
-
LINE_VERT_PERCENT
-
LINE_VERT_ABS
-
LINE_VERT_STACK
-
PIE
-
PIE_BAR
-
PIE_MULTI
-
THREED_AREA_SERIES
-
THREED_BAR
-
-
Process: Select the process from the list. All business indicators associated with the selected process become available for the data source definition.
-
Data Type: Select one of the following supported data types:
-
Workload
-
Activity and Measurement Sampling
-
Process Level Sampling
-
-
Series: Specify the dimension.
-
Use Range: Select to use ranges for dimensions with ranges.
-
Group: Specify the dimension used to group the dimensions used in a series.
-
Use Range: Select to use ranges for dimensions with ranges.
Table 6-1 summarizes the standard dimensions available based on the Data Type selection. Additionally, all the process specific dimensions are available.
Table 6-1 Standard Dimensions Available
| Workload | Activity and Measurement Sampling | Process Sampling | |
|---|---|---|---|
|
Dimension: Series |
Revision Role Activities Participant |
Revision Role Activities Participant Completion Date |
Revision Completion Date |
|
Dimension: Group |
Participant |
Participant Completion Date |
Completion Date |
-
Variable: Specify the measurement
Table 6-2 summarizes list of standard measurements available based on the Data Type selection. Additionally, all the process-specific measurements are available.
-
Operation Type: Specify the aggregation functions to be applied on the measurement variables selected.
Table 6-3 summarizes the operation types that can be used with various Data Type selections.
-
Value Type: Specify either a value or a percentage
-
Filter Condition: Specify the artifacts you want to view
Note:
If a new process is deployed while you have a dashboards page open, the new process will not be listed in the Data Sources dialog box until you log out of Process Workspace and then log back in.

