12 Analyzing Sales
This chapter contains the following topics:
12.1 Understanding Sales Analysis
Sales analysis is strictly an analytical and reporting tool that is typically used by property owners and marketing experts. Sales analysis does not generate invoices. You can set up analysis periods for weekly, monthly, quarterly, and YTD sales. You can make projections based on the YTD amounts.
The JD Edwards EnterpriseOne Real Estate Management provides a wide variety of sales analysis reports that are used to analyze and compare similar projects. You can specify that the sales analysis information be presented in a specific sequence in which the detail lines are sorted with the best performers appearing first. These reports are called ranking reports, and they display the lines that are sorted according to one of these sales figures:
-
Analysis period for the current year.
-
Same period in the prior year.
-
Change from the prior year.
-
Percentage increase or decrease.
You can specify the level of detail for the Sales Analysis Report (R15675). The report can display one line at the project level or numerous lines according to information such as units, tenants and product codes. For example, you could create a report that ranks the best performing tenants in a shopping mall, the best performing malls in a region, or the best performing products on each floor in a mall. You can rank the information according to different sales figures and include the same level of detail on separate reports.
A line of summarized information can include the number of items included in the summary. For example, a line summarized for a shopping mall might also demonstrate how many tenants are represented by that mall or how many different products are sold in it.
12.1.1 Controlling Invalid Comparisons
You can receive invalid comparisons for sales information when:
-
The sales information does not extend through the entire analysis period.
At the tenant level, for example, YTD sales cannot be compared to the same period from the prior year if the tenant launched the business after the prior year began or if no sales were reported for any months involved.
-
The rented area related to the sales information changed during the analysis period.
Depending on the report, the system might handle such a change differently.
However, the lack of reported sales or the change in rented area at one level does not necessarily cause a higher level of comparison to be invalid. For example, a comparison of the sales performance between two shopping malls might not be invalid because of the lack of sales for a given tenant. But this comparison could be invalid when the overall performance of the malls is being analyzed without regard to attrition and vacant space.
12.1.2 Sales Analysis Summary Codes
The sales figures that the system uses for analysis, comparison, and ranking are calculated at the levels of detail that you require. The system stores these requirements, called key structures, in the Sales Analysis Control table (F1544B). The system performs the calculations when the sales figures are generated and enters the results in the Tenant Sales Analysis Reporting File table (F1543B). This logic makes the process more efficient because the system has to create the records only once. You can then view the same records online or sort them in numerous ways in reports. The sales analysis summary code identifies the definition and key structure that controls the generation of the sales figures.
12.2 Prerequisite
Before you complete the tasks in this chapter, you must enter and post sales reports that you received from tenants.
12.3 Setting Up Levels of Detail for Sales Analysis
This section provides an overview of the levels of detail for sales analysis and discusses how to set up the levels of detail for sales analysis.
12.3.1 Understanding Levels of Detail for Sales Analysis
To support sales analysis, you must set up levels of detail by specifying:
-
Any combination of these key fields as the key structure:
-
Building (business unit).
-
Tenant (address book number).
-
Unit number.
-
DBA.
-
Floor number.
-
Product code.
-
Project number.
-
Company.
-
Lease number (order number).
-
ULI codes.
-
Reporting codes.
-
-
One or more of the key fields as a summary.
To request a summary, enter S in each of the key fields as appropriate.
-
One or more of the key fields as an item count.
To request an item count, enter C in each of the key fields as appropriate.
If you select multiple fields for an item count, the count is the total of all of the unique combinations possible for the items. For example, suppose a shopping mall has three stores (A, B, and C) selling three similar products (1, 2, and 3). If you set up the sales analysis to summarize by building and you count both tenant and product code, the count is nine (A1, B1, C1, A2, B2, C2, A3, B3, C3).
-
Whether sales analysis is automatically generated when you post expected or unexpected sales batches (automatic update when you run Post Sales Reports to History (R15820).
-
Whether the system excludes invalid comparisons.
-
The basis for the square footage (building total, unit total, rentable, or usable).
This table describes the information types that the system generates and stores in the Tenant Sales Analysis Reporting File table (F1543B):
| Information Types | Description |
|---|---|
| System-controlled | The system supplies the summary code, century, year, and reporting period. The reporting period and the Report Year Beginning Month field in the Real Estate Management constants determine the quarterly and YTD time periods. |
| User-controlled | You identify this information by setting up the key fields for the key structure. |
| Sales analysis | The system calculates the sales figures (such as YTD gross sales and changes in quarterly sales) as they relate to the analysis period and sequence. |
| Miscellaneous and statistical | The system calculates the square footage, changes in square footage, number of months without sales, total sales for the prior year, rolling sales for the previous 12 months, and item count. |
|
Note: After you have generated the sales analysis for a summary code, you cannot change or delete the definition for the code. To change or delete a code definition, you must first purge the related information from the F1543B table. |
12.3.2 Forms Used to Set Up Levels of Detail for Sales Analysis
| Form Name | FormID | Navigation | Usage |
|---|---|---|---|
| Work With Sales Analysis Summary Codes | W1544A | Sales Analysis Processing (G15222), Sales Analysis Control Revisions | Review and select sales analysis summary codes. |
| Sales Analysis Control Revisions | W1544C | On the Work With Sales Analysis Summary Codes form, click Add. |
|
12.3.3 Setting Up Levels of Detail for Sales Analysis
Access the Sales Analysis Control Revisions form.
Figure 12-1 Sales Analysis Control Revisions form
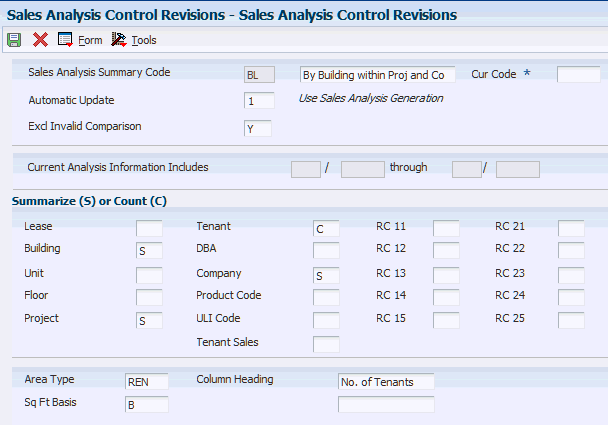
Description of ''Figure 12-1 Sales Analysis Control Revisions form''
- Sales Analysis Summary Code
-
Enter the two-character code that identifies how the system groups and summarizes sales history information when sales analysis records are generated.
Each summary code defines a group of key fields in the Sales Analysis Summary Control file. For a given summary code, every sales history record with identical information in each of the key fields which comprise the summary code are combined into one sales analysis record.
- Automatic Update
-
Enter a code that specifies which method to use to generate or update records. In the Sales Analysis Summary Control file, this field determines whether sales analysis for a summary code is created by the Sales Analysis Generation program or by the Post To Sales History program. Values are:
0: Sales analysis information should not be generated for this summary code (to maintain square footage history without the sales analysis).
1: Sales analysis information should be updated only by the Sales Analysis Generation program (relieves processing burden from the post, but requires the user to submit the generation program).
2: Sales analysis information should be maintained automatically whenever you post sales to history.
Note:
Even if you select 1, system automatically updates sales analysis when posting sales to periods that have already been generated. - Excl Invalid Comparison (exclude invalid comparison)
-
Enter a value that specifies whether invalid comparisons are excluded in sales analysis. An invalid comparison is defined as a period with sales compared to a period with no sales. Values are:
Y: Exclude sales history records.
N: Include sales history records.
- Lease
-
Enter a value that specifies whether to include Lease Number in the key field structure. You can select multiple key fields as count fields. In this case, for each sales analysis record, the count total is the total of all the unique combinations of values that these selected fields could have. Values are:
Blank: Do not include Lease Number in the key field structure.
S: Include Lease Number in the key field structure on which sales analysis record generation is based.
C: Designate the Lease Number as the key field to be counted when generating sales analysis records. For example, if Lease Number is selected as the count field, the total number of leases included in each sales analysis record is counted.
- Building
-
Enter a value that specifies whether to include Building in the key field structure. You can select multiple key fields as count fields. In this case, for each sales analysis record, the count total is the total of all of the unique combinations of values that these selected fields could have. Values are:
Blank: Do not include Building in the key field structure.
S: Include Building in the key field structure on which sales analysis record generation is based.
C: Designate Building as the key field to be counted when generating sales analysis records. For example, if Building is selected as the count field, the total number of buildings included in each sales analysis record is counted.
- Unit
-
Enter a value that specifies whether to include Unit in the key field structure. You can select multiple key fields as count fields. In this case, for each sales analysis record, the count total is the total of all of the unique combinations of values that these selected fields could have. Values are:
Blank: Do not include Unit Number in the key field structure.
S: Include Unit Number in the key field structure on which sales analysis record generation is based.
C: Designate Unit Number as the key field to be counted when generating sales analysis records. For example, if Unit Number is selected as the count field, the total number of units included in each sales analysis record is counted.
- Floor
-
Enter a value that specifies whether to include Floor in the key field structure. You can select multiple key fields as count fields. In this case, for each sales analysis record, the count total is the total of all of the unique combinations of values that these selected fields could have. Values are:
Blank: Do not include Floor Number in the key field structure.
S: Include Floor Number in the key field structure on which sales analysis record generation is based.
C: Designate Floor Number as the key field to be counted when generating sales analysis records. For example, if Floor Number is selected as the count field, the total number of floors included in each sales analysis record is counted.
- Project
-
Enter a value that specifies whether to include Project in the key field structure. You can select multiple key fields as count fields. In this case, for each sales analysis record, the count total is the total of all of the unique combinations of values that these selected fields could have. Values are:
Blank: Do not include Project Number in the key field structure.
S: Include Project Number in the key field structure on which sales analysis record generation is based.
C: Designate Project Number as the key field to be counted when generating sales analysis records. For example, if Project Number is selected as the count field, the total number of projects included in each sales analysis record is counted.
- Tenant
-
Enter a value that specifies whether to include Tenant in the key field structure. You can select multiple key fields as count fields. In this case, for each sales analysis record, the count total is the total of all of the unique combinations of values that these selected fields could have. Values are:
Blank: Do not include Address Number in the key field structure.
S: Include Address Number in the key field structure on which sales analysis record generation is based.
C: Designate Address Number as the key field to be counted when generating sales analysis records. For example, if Address Number is selected as the count field, the total number of tenants included in each sales analysis record is counted.
- DBA (doing business as)
-
Enter a value that specifies whether to include DBA in the key field structure. You can select multiple key fields as count fields. In this case, for each sales analysis record, the count total is the total of all of the unique combinations of values that these selected fields could have. Values are:
Blank: Do not include DBA (Doing Business As) in the key field structure.
S: Include DBA in the key field structure on which sales analysis record generation is based.
C: Designate DBA as the key field to be counted when generating sales analysis records. For example, if DBA is selected as the count field, the total number of DBA codes included in each sales analysis record is counted.
- Company
-
Enter a value that specifies whether to include Company in the key field structure. You can select multiple key fields as count fields. In this case, for each sales analysis record, the count total is the total of all of the unique combinations of values that these selected fields could have. Values are:
Blank: Do not include Company Number in the key field structure.
S: Include Company Number in the key field structure on which sales analysis record generation is based.
C: Designate Company Number as the key field to be counted when generating sales analysis records. For example, if Company Number is selected as the count field, the total number of companies included in each sales analysis record is counted.
- Product Code
-
Enter a value that specifies whether to include Product Code in the key field structure. You can select multiple key fields as count fields. In this case, for each sales analysis record, the count total is the total of all of the unique combinations of values that these selected fields could have. Values are:
Blank: Do not include Product Code in the key field structure.
S: Include Product Code in the key field structure on which sales analysis record generation is based.
C: Designate Product Code as the key field to be counted when generating sales analysis records. For example, if Product Code is selected as the count field, the total number of product codes included in each sales analysis record is counted.
- ULI Code (urban land industry code)
-
Enter a value that specifies whether to include ULI Code in the key field structure. You can select multiple key fields as count fields. In this case, for each sales analysis record, the count total is the total of all of the unique combinations of values that these selected fields could have. Values are:
Blank: Do not include the ULI Code in the key field structure.
S: Include the ULI Code in the key field structure on which sales analysis record generation is based.
C: Designate the ULI Code as the key field to be counted when generating sales analysis records. For example, if the ULI Code is selected as the count field, the total number of ULI codes included in each sales analysis record is counted.
- RC 11 (reporting code 11)
-
Enter a value that specifies whether to include RC 11 in the key field structure. You can select multiple key fields as count fields. In this case, for each sales analysis record, the count total is the total of all of the unique combinations of values that these selected fields could have. Values are:
Blank: Do not include Reporting Code 11 (RC 11) in the key field structure.
S: Include RC 11 in the key field structure on which sales analysis record generation is based.
C: Designate the RC 11 as the key field to be counted when generating sales analysis records. For example, if the RC 11 is selected as the count field, the total number of RC 11 codes included in each sales analysis record is counted.
- Area Type
-
Enter a user-defined code from UDC table 15/AR that identifies the area by its use, such as rentable, usable, gross leasable (GLA), or gross lease occupied (GLOA).
- Sq Ft Basis (square foot basis)
-
Enter the square foot basis. A field that is used to provide the Sales Analysis system with the necessary information to calculate the square footage amount. Depending on the key fields selected, the system prompts for different information.
If the prompt is "Use Rentable/Usable Sq Ft?", the expected answer is whether the system should use the rentable area amount or the usable area amount in the Square Footage calculation.
- Column Heading
-
Enter text that the system uses for field description primarily on reports. The text should not be longer than the size of the data item. The system centers the text on the report, so you should enter it as left justified.
When you select a key field for an item count, the system prompts you to specify the related column heading at the bottom of the form. This heading, which can be two lines of text, appears on the sales analysis reports.
12.4 Generating Sales Analysis Information
This section provides an overview of sales analysis generation and discusses how to:
-
Run the Sales Analysis Generation program.
-
Set processing options for Sales Analysis Generation (R15820).
12.4.1 Understanding Sales Analysis Generation
Use the Sales Analysis Generation program (R15143) to summarize the information for sales analysis. The program uses information from the Sales Analysis Control table (F1544B), the Tenant/Lease Billings Detail Master table (F1511B) and the Tenant Sales History (F1541B) table.
The R15143 program stores the generated information in the Tenant Sales Analysis Reporting table (F1543B). You can set the system to generate sales analysis automatically when you run the Post Sales Reports to History report (R15820).
If sales analysis is not generated automatically, you must run the R15143 program directly from the Sales Analysis Processing menu. When you post sales reports to history, the system still updates sales for periods in the Tenant Sales Analysis Reporting File table (F1543B) for which sales analysis has already been generated.
If you set the Sales Analysis Dynamic Update processing option to 1 (Update through post), you no longer have to manually change the value in the Automatic Update field in Sales Analysis Control Revisions for each summary code being processed.
If you specify multiple months in the Number Of Months To Keep processing option, the system retains only sales analysis records for that number of months, beginning with the most current record and counting back the number that you specify. The system deletes records older than the specified number of months. If you specify multiple months and also complete the Purge Through Period processing option, the system uses the earlier cutoff date.
12.4.2 Running the Sales Analysis Generation Program
Select Sales Analysis Processing (G15222), Sales Analysis Generation.
12.4.3 Setting Processing Options for Sales Analysis Generation (R15143)
Processing options enable you to specify the default processing for programs and reports.
12.4.3.1 Process
- 1. Generation Date Month
-
Specify the month for which records in the Sales Reporting table (F1543B) are generated.
- 2. Generation Date Century and Year
-
Specify the century and year for which records in the Sales Reporting table (F1543B) are generated.
- 3. Sales Analysis Dynamic Update
-
Specify whether to change selected summary codes from batch generation to dynamic update through the post program. Values are:
Blank: Do not change the current process.
1: Update through the post program.
This processing option eliminates the process of manually changing the value in the Sales Analysis field in the Sales Analysis Control program (P1544) for each summary code being processed. You would have to manually change the value in the Sales Analysis field if the code is not set up for automatic update and you want Sales Analysis to be generated automatically when you run the Post Sales to History report (R15820).
12.4.3.2 Print
- 1. Sales Analysis Report
-
Specify whether to print a report of the sales analysis reporting records that were created by the Sales Analysis Generation report (R15143). Values are:
Blank: Do not print.
1: Print.
12.4.3.3 Purge
- 1. Number Of Months To Keep
-
Specify which sales analysis records are purged. The system retains only that number of months of sales analysis records beginning with the most current record and counting back that number of months. The system deletes records older than the specified number of months.
If you enter a value in this option and the purge through period option, the system uses the earlier cutoff date.
- 2. Purge Through Period
-
Specify which sales analysis records are purged. If you enter a month and year, the system deletes all records prior to that month and year.
If you enter a value in this processing option and the Number Of Months To Keep processing option, the system uses the earlier cutoff date.
- 3. Sales Analysis Purge
-
Specify whether the system purges records in the Sales Analysis Reporting table (F1543B). Values are:
Blank: Do not purge.
1: Purge. Enter a 1 if you only want to keep current month analysis data and you are selecting all summary codes.
12.5 Revising Sales Analysis Information
This section provides overviews of sales analysis information and the recalculation process and discusses how to set processing options for Sales Analysis Revisions (P15043).
12.5.1 Understanding Sales Analysis Information
You can review and revise the information in the Tenant Sales Analysis Reporting File table (F1543B) by using the Sales Analysis Revisions program (P15043). For example, you can review how the sales calculations are derived and the differences between the rolling sales and YTD sales. You can change or delete lines that have invalid or incomplete information.
The Recalculate Amounts processing option controls whether the system recalculates the related information interactively. If the processing option is set to 1 (Recalculate related amounts), the system recalculates the related information according to the changes that you make. Note the following:
-
The automatic update involves only the record with which you are working.
Changes have no effect across records. For example, if you change a QTD sales amount for the reporting period March 2007, the system does not change the same QTD amounts in the records for January 2007 and February 2007. Similarly, if you change a sales amount in the MTD Last Year field for March 2007, the system does not change the sales amount in the MTD This Year field for March 2008.
-
The system recognizes only one change at a time.
After all of the related fields have been recalculated for a change, you must click OK to trigger the recalculation process.
You can use the Report Year Beginning Month field in the Real Estate Management system constants to organize the fiscal periods for the sales information that appears on the Sales Analysis Revisions form. If you enter 5 in the field, for example, the form displays all of the sales for all tenants on a May through April fiscal year. The first quarter of sales is then reported for May, June, and July.
You can reset any records that have been changed, recalculated, or deleted by rerunning the R15143 program.
12.5.2 Understanding the Recalculation Process
If a change triggers the recalculation process, the related fields are recalculated in a specific sequence to obtain the correct results. This table lists the sequence for each field that can trigger the recalculation process:
| Field | Explanation |
|---|---|
| MTD-Gross Sales Amounts-This Year | 1 MTD-Gross Sales Amounts-Change
2 MTD-Per Square Foot (PSF) Amounts-This Year 3 MTD-PSF Amounts-Change 4 MTD-Percent Change 5 QTD-Gross Sales Amounts-This Year 6 QTD-Gross Sales Amounts-Change 7 QTD-PSF Amounts-This Year 8 QTD-PSF Amounts-Change 9 QTD-Percent Change 10 YTD-Gross Sales Amounts-This Year 11 YTD-Gross Sales Amounts-Change 12 YTD-PSF Amounts-This Year 13 YTD-PSF Amounts-Change 14 YTD-Percent Change 15 CYP (Current Year Projection)-Gross Sales Amounts-This Year 16 CYP-Gross Sales Amounts-Change 17 CYP-PSF Amounts-This Year 18 CYP-PSF Amounts-Change 19 CYP-Percent Change |
| MTD-Gross Sales Amounts-Last Year | 1 MTD–Gross Sales Amounts–Change
2 MTD-PSF Amounts-Last Year 3 MTD-PSF Amounts-Change 4 MTD-Percent Change 5 QTD-Gross Sales Amounts-Last Year 6 QTD-Gross Sales Amounts-Change 7 QTD-PSF Amounts-Last Year 8 QTD-PSF Amounts-Change 9 QTD-Percent Change 10 YTD-Gross Sales Amounts-Last Year 11 YTD-Gross Sales Amounts-Change 12 YTD-PSF Amounts-Last Year 13 YTD-PSF Amounts-Change 14 YTD-Percent Change 15 CYP-Gross Sales Amounts-This Year 16 CYP-Gross Sales Amounts-Last Year 17 CYP-Gross Sales Amounts-Change 18 CYP-PSF Amounts-Last Year 19 CYP-PSF Amounts-Change 20 CYP-Percent Change |
| MTD-PSF Amounts-This Year | 1 MTD-Gross Sales Amounts-This Year
2 MTD-Gross Sales Amounts-Change 3 MTD-PSF Amounts-This Year 4 MTD-PSF Amounts-Change 5 MTD-Percent Change 6 QTD-Gross Sales Amounts-This Year 7 QTD-Gross Sales Amounts-Change 8 QTD-PSF Amounts-This Year 9 QTD-PSF Amounts-Change 10 QTD-Percent Change 11 YTD-Gross Sales Amounts-This Year 12 YTD-Gross Sales Amounts-Change 13 YTD-PSF Amounts-This Year 14 YTD-PSF Amounts-Change 15 YTD-Percent Change 16 CYP-Gross Sales Amounts-This Year 17 CYP-Gross Sales Amounts-Change 18 CYP-PSF Amounts-This Year 19 CYP-PSF Amounts-Change 20 CYP-Percent Change |
| MTD-PSF Amounts-Last Year | 1 MTD-Gross Sales Amounts-Last Year
2 MTD-Gross Sales Amounts-Change 3 MTD-PSF Amounts-Last Year 4 MTD-PSF Amounts-Change 5 MTD-Percent Change 6 QTD-Gross Sales Amounts-Last Year 7 QTD-Gross Sales Amounts-Change 8 QTD-PSF Amounts-Last Year 9 QTD-PSF Amounts-Change 10 QTD-Percent Change 11 YTD-Gross Sales Amounts-Last Year 12 YTD-Gross Sales Amounts-Change 13 YTD-PSF Amounts-Last Year 14 YTD-PSF Amounts-Change 15 YTD-Percent Change 16 CYP-Gross Sales Amounts-This Year 17 CYP-Gross Sales Amounts-Last Year 18 CYP-Gross Sales Amounts-Change 19 CYP-PSF Amounts-Last Year 20 CYP-PSF Amounts-Change 21 CYP-Percent Change |
| QTD-Gross Sales Amounts-This Year | 1 QTD-Gross Sales Amounts-Change Amounts
2 QTD-PSF Amounts-This Year 3 QTD-PSF Amounts-Change 4 QTD-Percent Change 5 YTD-Gross Sales Amounts-This Year 6 YTD-Gross Sales Amounts-Change 7 YTD-PSF Amounts-This Year 8 YTD-PSF Amounts-Change 9 YTD-Percent Change 10 CYP-Gross Sales Amounts-This Year 11 CYP-Gross Sales Amounts-Change 12 CYP-PSF Amounts-This Year 13 CYP-PSF Amounts-Change 14 CYP-Percent Change |
| QTD-Gross Sales Amounts-Last Year | 1 QTD-Gross Sales Amounts-Change
2 QTD-PSF Amounts-Last Year 3 QTD-PSF Amounts-Change 4 QTD-Percent Change 5 YTD-Gross Sales Amounts-Last Year 6 YTD-Gross Sales Amounts-Change 7 YTD-PSF Amounts-Last Year 8 YTD-PSF Amounts-Change 9 YTD-Percent Change 10 CYP-Gross Sales Amounts-This Year 11 CYP-Gross Sales Amounts-Last Year 12 CYP-Gross Sales Amounts-Change 13 CYP-PSF Amounts-Last Year 14 CYP-PSF Amounts-Change 15 CYP-Percent Change |
| YTD-Gross Sales Amounts-This Year | 1 YTD-Gross Sales Amounts-Change
2 YTD-PSF Amounts-This Year 3 YTD-PSF Amounts-Change 4 YTD-Percent Change 5 CYP-Gross Sales Amounts-This Year 6 CYP-Gross Sales Amounts-Change 7 CYP-PSF Amounts-This Year 8 CYP-PSF Amounts-Change 9 CYP-Percent Change |
| YTD-Gross Sales Amounts-Last Year | 1 YTD-Gross Sales Amounts-Change
2 YTD-PSF Amounts-Last Year 3 YTD-PSF Amounts-Change 4 YTD-Percent Change 5 CYP-Gross Sales Amounts-This Year 6 CYP-Gross Sales Amounts-Last Year 7 CYP-Gross Sales Amounts-Change 8 CYP-PSF Amounts-This Year 9 CYP-PSF Amounts-Change 10 CYP-Percent Change |
| YTD-PSF Amounts-This Year | 1 YTD-Gross Sales Amounts-This Year
2 YTD-Gross Sales Amounts-Change 3 YTD-PSF Amounts-Change 4 YTD-Percent Change 5 CYP-Gross Sales Amounts-This Year 6 CYP-Gross Sales Amounts-Change 7 CYP-PSF Amounts-This Year 8 CYP-PSF Amounts-Change 9 CYP-Percent Change |
| YTD-PSF Amounts-Last Year | 1 YTD-Gross Sales Amounts-Last Year
2 YTD-Gross Sales Amounts-Change 3 YTD-PSF Amounts-Change 4 YTD-Percent Change 5 CYP-Gross Sales Amounts-This Year 6 CYP-Gross Sales Amounts-Last Year 7 CYP-Gross Sales Amounts-Change 8 CYP-PSF Amounts-Last Year 9 CYP-PSF Amounts-Change 10 CYP-Percent Change |
| CYP-Gross Sales Amounts-Last Year | 1 CYP-Gross Sales Amounts-This Year
2 CYP-Gross Sales Amounts-Change 3 CYP-PSF Amounts-Last Year 4 CYP-PSF Amounts-Change 5 CYP-Percent Change |
| Square Footage This Year | 1 MTD-PSF Amounts-This Year
2 MTD-PSF Amounts-Change 3 QTD-PSF Amounts-This Year 4 QTD-PSF Amounts-Change 5 YTD-PSF Amounts-This Year 6 YTD-PSF Amounts-Change 7 CYP-PSF Amounts-This Year 8 CYP-PSF Amounts-Change |
| Square Footage Last Year | 1 MTD-PSF Amounts-Last Year
2 MTD-PSF Amounts-Change 3 QTD-PSF Amounts-Last Year 4 QTD-PSF Amounts-Change 5 YTD-PSF Amounts-Last Year 6 YTD-PSF Amounts-Change 7 CYP-PSF Amounts-Last Year 8 CYP-PSF Amounts-Change |
| MTD-Empty Months | 1 QTD-Empty Months
2 YTD-Empty Months |
| QTD-Empty Months | 1 YTD-Empty Months |
| MTD-Abs Chg SF (absolute change in square footage) | 1 QTD-Abs Chg SF
2 YTD-Abs Chg SF |
| QTD-Abs Chg SF | 1 YTD-Abs Chg SF |
These fields are not affected by the recalculation process, nor does a change to them trigger the process:
-
Rolling 12 Months Sales
-
MTD-Net Change SF
-
Count Field
-
QTD-Net Change SF
-
PY Empty Mos (prior year empty months)
-
YTD-Empty Months
-
YTD-Net Change SF
-
YTD-Abs Chg SF
12.5.3 Forms Used to Revise Sales Analysis Information
| Form Name | FormID | Navigation | Usage |
|---|---|---|---|
| Work With Sales Analysis | W15043B | Sales Analysis Processing (G15222), Sales Analysis Revisions. | Review and select sales analysis records. |
| Sales Analysis Revisions | W15043C | On the Work With Sales Analysis form, click Add. | Revise sales analysis information. |
12.5.4 Setting Processing Options for Sales Analysis Revisions (P15043)
Processing options enable you to specify the default processing for programs and reports.
12.5.4.1 Process
- 1. Recalculate Amounts
-
Specify which method of calculation to use. Values are:
Blank: Allow the amount fields to be changed without the automatic recalculation of related amount fields.
1: Automatically recalculate the related amount fields based on the changed amount fields.