3 Running One View Reports
This chapter contains the following topics:
-
Running One View Reports from One View Reporting Applications
-
Running One View Reports from JD Edwards Standard or Custom Applications
3.1 Introduction to Running One View Reports
You can run One View reports from any One View Reporting application, custom find browse form, or from Data Browser. After you determine the data for a report, you select a report layout from the One View menu. If desired, you can modify several run-time options, such as selecting different output types. When you run the report, the results display automatically in a separate browser window.
The basic steps for running One View reports are:
-
Access a One View Reporting enabled form.
-
Select or define a query.
-
Select a report from the One View menu.
-
Modify the run-time options (optional).
-
Run the report.
3.2 Defining the Data for a One View Report
On a find browse form or in Data Browser, select or define a query to locate the data that you want to appear in a report. After you have defined the data, select a report from the One View menu. The report processes automatically and then appears in a pop-up window. If you have the report set to use the current grid data, you must click the Find button to display the data before running the report.
3.2.1 Creating Queries
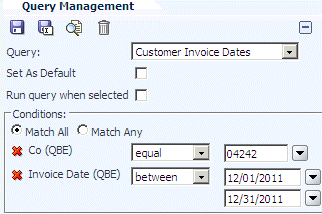
Queries enable you to select fields and QBE (Query By Example) columns and then add conditions to narrow your search results. In this way, the data is more specific than the search results from filter fields and QBE columns alone. For example, instead of entering >120111 in the Invoice Date QBE column for dates after December 1, 2011, a query enables you to specify a date range, such as between December 1, 2011, and December 31, 2011. The query feature enables you to refine the data selection so that the report displays only those records that meet your needs. The system combines the conditions defined in the filter fields, the QBE line, and the query itself to retrieve desired records.
The following example shows a query that specifies a date range for an invoice date:
You can save queries that you use frequently so that you can easily retrieve them and modify the data that you want to appear in a report.
For more information about queries, see "Understanding the Query Control" in the JD Edwards EnterpriseOne Foundation Guide.
3.3 Run-time Options
When running One View reports, you have the option to change several default settings according to your needs. Run-time options include:
-
Selecting various data options, such as changing the number of records that you want to show in a report.
-
Selecting different output types for a report.
Perhaps the default output type is PDF but you want to view the output in an Excel spreadsheet; you can change the output to any type that is available for a report.
-
Selecting different report layouts.
The JD Edwards EnterpriseOne standard One View reports have one layout per report, but you can create additional layouts if desired. When running a report, you can select a different layout if one is available.
3.3.1 Layout Tab
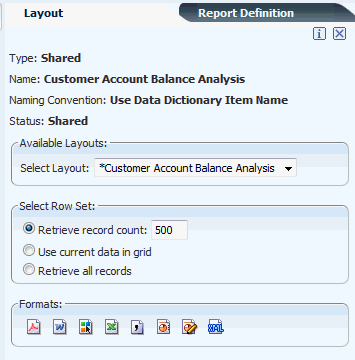
The Layout tab enables you to change various run-time options. To access these options, use the Manage Reports selection in the One View menu and then select a report. This is an example of the Layout tab:
The following table describes the information and options shown in the Layout tab.
| Layout Options | Description |
|---|---|
| Type | The two types of reports are:
|
| Name | The name of a report. |
| Naming Convention | You can select one of two options when adding a new report:
|
| Status | A report can have three statuses:
|
| Available Layouts | Select a layout from the drop-down list if more than one layout is defined for a report. |
| Select Row Set | Three row set options are available for the grid data used in a report:
With Tools Release 9.1 Update 5, if the report data is limited due to this setting, whether by the field value, system limit, or number of grid records, the user running the report will receive the following pop-up warning: "Warning! The report has exceeded the maximum number of records. Query found xx rows but report is limited to yy rows." Xx represents the total number of rows retrieved and yy represents the Retrieve Record Count field value. The user must click OK on this warning in order for the report to appear. |
| Formats | Depending on the template used for the report, BI Publisher can create output in the following formats:
|
3.3.1.1 Output Formats
Oracle BI Publisher can render One View reports in multiple formats. Although each report has a default output format, the output icons on the Layout tab enable you to view the report in any format that was created for the report. Regardless of whether the report is shared or personal, you can change the output format to view the report in any format that is available.
The following table describes the output formats:
| Output Icon | Description |
|---|---|
Description of the illustration ''output_pdf.gif'' |
Use this option to view the report in Adobe Reader. |
Description of the illustration ''output_word_rtf.gif'' |
Use this option to view the report in Microsoft Word RTF format. |
Description of the illustration ''output_interactv_viewer.gif'' |
Use this option to view the report with the BI Publisher Interactive Viewer.
Interactive reports can include pop-up chart details, scrollable tables, table filtering, table sorting, and propagated filtering across different components of the report.You can modify the standard report layout by adding or removing columns, defining how the data is sorted, adding level breaks, totaling columns, and changing how the data appears in the report, for example, as a grid, a graph, or a chart. |
Description of the illustration ''output_excel.gif'' |
Use this option to view the report in Microsoft Excel 2007. |
Description of the illustration ''output_csv.gif'' |
Use this option to view the report in CSV format. |
Description of the illustration ''output_ppt.gif'' |
Use this option to view the report in Microsoft PowerPoint. |
Description of the illustration ''output_ppt_2007.gif'' |
Use this option to view the report in Microsoft PowerPoint 2007 format. |
Description of the illustration ''output_xml.gif'' |
Use this option to view the report in XML format. |
Changing Report Output Formats
Access a One View Reporting enabled form.
-
To locate data for the report, select or create a query.
-
From the One View menu, select Manage Reports.
-
From the Manage Reports menu, select a shared or a personal report.
The Manage Reports side panel appears.
-
On the Layout tab, select the desired output format.
BI Publisher processes the report for the selected output format and displays it in a separate window.
3.4 Running One View Reports from One View Reporting Applications
Although you can run One View reports from any find browse form, One View Reporting applications were designed specifically for reporting. The business views for One View Reporting find browse forms include most columns in each table and join multiple tables, which results in more data for each record than the data displayed in a standard JD Edwards EnterpriseOne find browse form. Moreover, One View Reporting applications include additional calculations and processing. Therefore, One View Reporting applications can derive more information from the tables on which they are based. Because they include more data, calculations, and logic, One View Reporting applications produce reports that are not available elsewhere in JD Edwards EnterpriseOne.
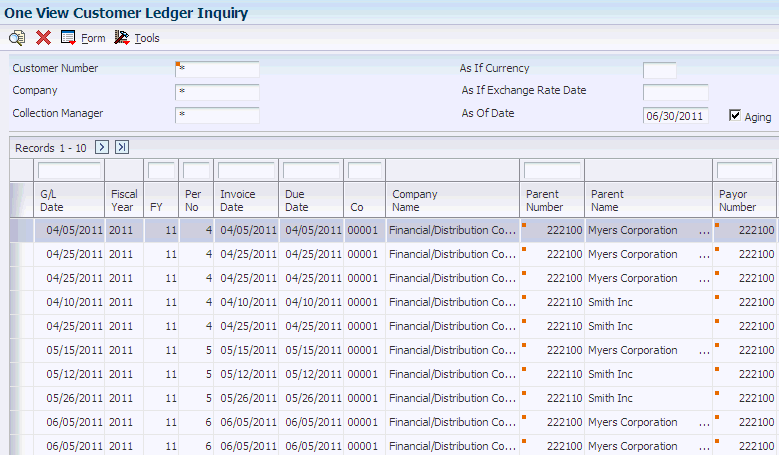
The following example shows the find browse form in the One View Customer Ledger Inquiry application (P03B2022):
Figure 3-3 One View Customer Ledger Inquiry find browse form

Description of ''Figure 3-3 One View Customer Ledger Inquiry find browse form''
3.4.1 Running One View Reports from One View Reporting Applications
The find browse forms in One View Reporting applications include predefined One View reports that you can run. You can easily create your own personalized reports to run One View reports from other applications.
To run One View reports from a One View Reporting application:
-
Retrieve data for the report using a query or by entering values in the filter fields and QBE columns of the find browse form.
-
From the One View menu, select a report.
BI Publisher processes the report and displays it in a separate window.
-
If the report output format is set to interactive, filter the data to display specific information.
3.5 Running One View Reports from JD Edwards Standard or Custom Applications
Running One View reports from standard or custom JD Edwards find browse forms requires that you first add a custom report based on data from the application. After the report is created, follow the same procedure to run the report as you do in One View Reporting applications.
See Running One View Reports from One View Reporting Applications.
3.6 Running One View Reports from Data Browser
If a find browse form or One View Reporting application does not have the information you need for a One View report, you can use Data Browser to create a query over a table or business view and select the data items the report requires. You can easily create your own reports to run One View reports from Data Browser. After determining the data items, you can design the report layout.
For more information about Data Browser, see "Creating Personal Search Queries to Search for Data in Tables and Business Views" in the JD Edwards EnterpriseOne Foundation Guide.
3.6.1 Running One View Reports from Data Browser
Access Data Browser.
-
On the Query selector form, enter a table or business view name and then click OK.
-
On the Data Browser form, locate the records for the report.
-
Select a report from the One View menu.
BI Publisher processes the report and displays it in a separate window.
-
If the report output format is set to interactive, filter the data to display specific information.

