19 One View Reporting for Warehouse Management (Release 9.1 Update)
This chapter provides overview information, processing options, special process, and reports for the following applications:
-
Section 19.2, "One View Warehouse Suggestion Inquiry (P46271)"
-
Section 19.3, "One View License Plate Quantity Inquiry (P46L272)"
-
Section 19.4, "One View Warehouse Location Inquiry (P46273)"
19.1 One View Warehouse Request Inquiry (P46270)
Access the One View Warehouse Request Inquiry application (P46270) on the Warehousing Inquiries & Reports menu (G4614). Use One View Warehouse Request Inquiry to query confirmed warehouse request information and create warehouse requests inquiry reports including related data from the Warehouse Requests (F4600) and Warehouse Requests Tag (F4600T1) tables. One View Warehouse Request Inquiry uses the One View Warehouse Request Inquiry business view (V46270A), which includes columns from the Warehouse Requests table and the Warehouse Requests Tag table.
This application provides the ability to create and run reports on current confirmed warehouse requests for a specific branch/plant and provides comparative information for putaway, picking, and replenishment requests. You can set up reports to run based on any combination of filter fields in the header of the One View Warehouse Request Inquiry form. The header filter fields include:
-
Request Status.
Enter a code (46/PS) that identifies the current status of a putaway, picking, or replenishment request.
-
Branch/Plant.
Enter a code that identifies a warehouse branch plant.
-
Request Confirmed Date From.
Enter a start date for the request confirmed date range.
-
Request Confirmed Date Thru.
Enter an end date for the request confirmed date range.
You can review warehouse requests to analyze trends with to items and the amount of time to process warehouse requests through various statuses in the movement process.
19.1.1 Processing Options
Processing options enable you to specify the default processing for programs and reports.
19.1.2 Special Processing
One View Warehouse Request Inquiry processes requests to analyze trends for putaway, picking, and replenishment. The system uses the request confirmed date range and the branch/plant to filter information and design reports for the specified branch/plant. You can use the processing option to specify which warehouse status you want the system to filter on during processing.
The system uses the date and a 24-hour clock to calculate duration time. The system displays the duration time in hours. For example, the system displays the difference between 1430 (2:30 pm) today and 1130 (11:30 am) today as 3 hours. On the otherhand the system displays the difference between 1430 yesterday and 1130 today as 21 hours.
19.1.3 Reports
The reports delivered with the One View Warehouse Request Inquiry (P46270) application are:
-
Warehouse Pick Request Analysis
-
Warehouse Putaway Request Analysis
-
Warehouse Replenishment Request Analysis
-
Warehouse Request Summary
19.1.3.1 Warehouse Pick Request Analysis
The Warehouse Pick Request Analysis report enables you to view pick request information. This report contains the following components:
| Component | Description |
|---|---|
| Average Hours Spent Processing Pick Request by Month (line graph) | This line graph enables you to compare the number of hours spent each month to process pick requests for the selected branch/plant. The pick requests are categorized by averaged time unsuggested, average time from suggestion to confirmation, and average time to process the entire request. |
| Average Pick Request Hours by Status (bar graph) | This bar graph enables you to review, for the selected branch/plant, the average time taken for a request to be confirmed, the average time a requests is unsuggested, and the average amount of time a request is suggested but unconfirmed. |
| Backlog - Number of Pick Requests not Processed with 24 Hours (bar graph) | This bar graph enables you to review the number of pick requests for the selected branch/plant that are not processed during a 24 hour period. The bar graph displays information by month and categorizes the 24-hour periods as between 24-48 hours, between 48-72 hours, and 72 hours are more. |
| Number of Pick Request by Week (line graph) | This line graph charts the number of pick request for each week over a 52-week period for the selected branch/plant. |
| Summary of Average Hours Spent Processing Pick Request by Year and Month (table) | This table displays a historical summary of pick request average hourly information used in the graphs for the selected branch/plant. |
| Number of Pick Requests not Processed within 24 Hours by Year and Month (table) | This table displays a historical summary of pick request backlog information used in the graphs for the selected branch/plant. |
| Summary of Number of Pick Requests by Year and Week (table) | This table displays a historical summary of total pick requests information used in the graphs for the selected branch/plant. |
| Warehouse Pick Request Analysis Details Table | This table displays all the historical date and time detail records that were used to create the graphs for the selected branch/plant. |
19.1.3.2 Warehouse Putaway Request Analysis
The Warehouse Putaway Request Analysis report enables you to view putaway request information. This report contains the following components:
| Component | Description |
|---|---|
| Average Hours Spent Processing Putaway Request by Month (line graph) | This line graph enables you to compare the number of hours spent each month to process putaway requests for the selected branch/plant. The putaway requests are categorized by averaged time unsuggested, average time from suggestion to confirmation, and average time to process the entire request. |
| Average Putaway Request Hours by Status (bar graph) | This bar graph enables you to review, for the selected branch/plant, the average time taken for a request to be confirmed, the average time a requests is unsuggested, and the average amount of time a request is suggested but unconfirmed. |
| Backlog - Number of Putaway Requests not Processed with 24 Hours (bar graph) | This bar graph enables you to review the number of putaway requests for the selected branch/plant that are not processed during a 24 hour period. The bar graph displays information by month and categorizes the 24-hour periods as between 24-48 hours, between 48-72 hours, and 72 hours are more. |
| Number of Putaway Request by Week (line graph) | This line graph charts the number of putaway request for each week over a 52-week period for the selected branch/plant. |
| Summary of Average Hours Spent Processing Putaway Request by Year and Month (table) | This table displays a historical summary of putaway request average hourly information used in the graphs for the selected branch/plant. |
| Number of Putaway Requests not Processed within 24 Hours by Year and Month (table) | This table displays a historical summary of putaway request backlog information used in the graphs for the selected branch/plant. |
| Summary of Number of Putaway Requests by Year and Week (table) | This table displays a historical summary of total putaway requests information used in the graphs for the selected branch/plant. |
| Warehouse Putaway Request Analysis Details Table. | This table displays all the historical date and time detail records that were used to create the graphs for the selected branch/plant. |
19.1.3.3 Warehouse Replenishment Request Analysis
The Warehouse Replenishment Request Analysis report enables you to view replenishment request information. This report contains the following components:
| Component | Description |
|---|---|
| Average Hours Spent Processing Replenishment Request by Month (line graph) | This line graph enables you to compare the number of hours spent each month to process replenishment requests for the selected branch/plant. The replenishment requests are categorized by averaged time unsuggested, average time from suggestion to confirmation, and average time to process the entire request. |
| Average Replenishment Request Hours by Status (bar graph) | This bar graph enables you to review, for the selected branch/plant, the average time taken for a request to be confirmed, the average time a requests is unsuggested, and the average amount of time a request is suggested but unconfirmed. |
| Backlog - Number of Replenishment Requests not Processed with 24 Hours (bar graph) | This bar graph enables you to review the number of replenishment requests for the selected branch/plant that are not processed during a 24 hour period. The bar graph displays information by month and categorizes the 24-hour periods as between 24-48 hours, between 48-72 hours, and 72 hours are more. |
| Number of Replenishment Request by Week (line graph) | This line graph charts the number of replenishment request for each week over a 52-week period for the selected branch/plant. |
| Summary of Average Hours Spent Processing Replenishment Request by Year and Month (table) | This table displays a historical summary of replenishment request average hourly information used in the graphs for the selected branch/plant. |
| Number of Replenishment Requests not Processed within 24 Hours by Year and Month (table) | This table displays a historical summary of replenishment request backlog information used in the graphs for the selected branch/plant. |
| Summary of Number of Replenishment Requests by Year and Week (table). | This table displays a historical summary of total replenishment requests information used in the graphs for the selected branch/plant. |
| Warehouse Replenishment Request Analysis Details Table. | This table displays all the historical date and time detail records that were used to create the graphs for the selected branch/plant. |
19.1.3.4 Warehouse Request Summary
The Warehouse Request Summary report enables you to compare the activity associated with picking, putaway, and replenishment requests. The report contains the following components:
| Component | Description |
|---|---|
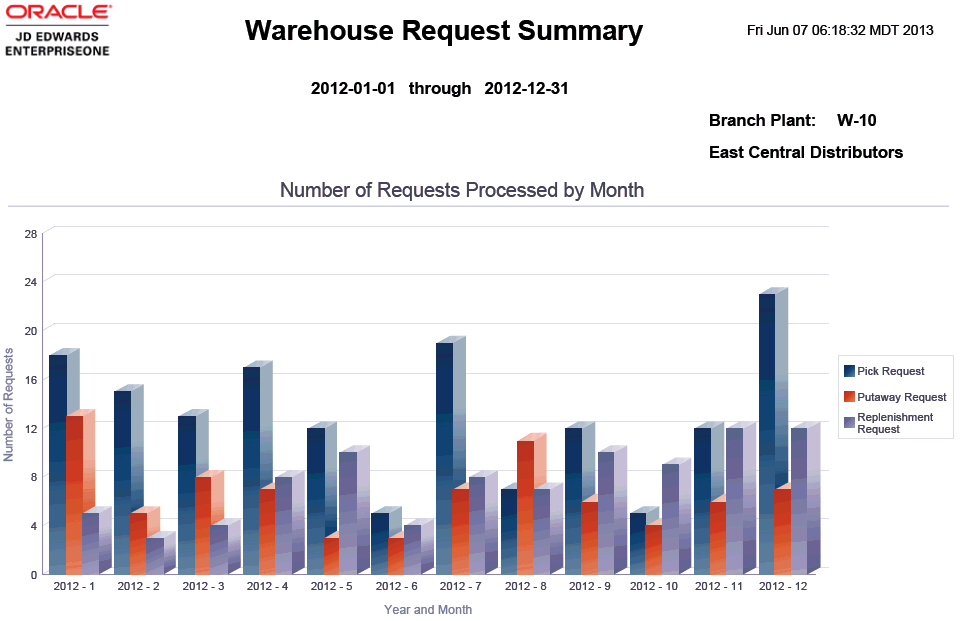
| Number of Requests Processed by Month (bar graph) | This bar graph enables you to compare the number of requests processed each month for picking, putaway and replenishments for the selected branch/plant. |
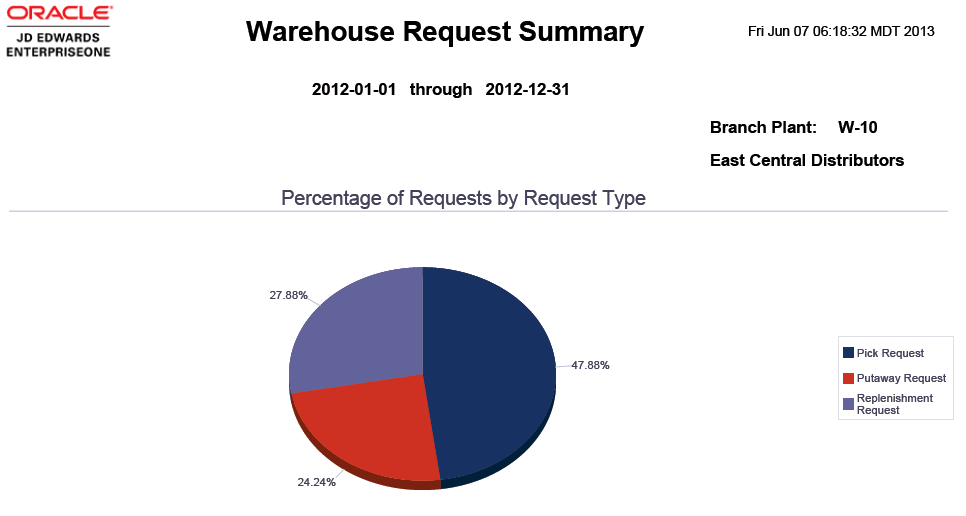
| Percentage of Requests by Request Type (pie chart) | This pie chart enables you to view the percentage of total request that each request type represents for the selected branch/plant. The request types are categorized as picking, putaway, and replenishment. |
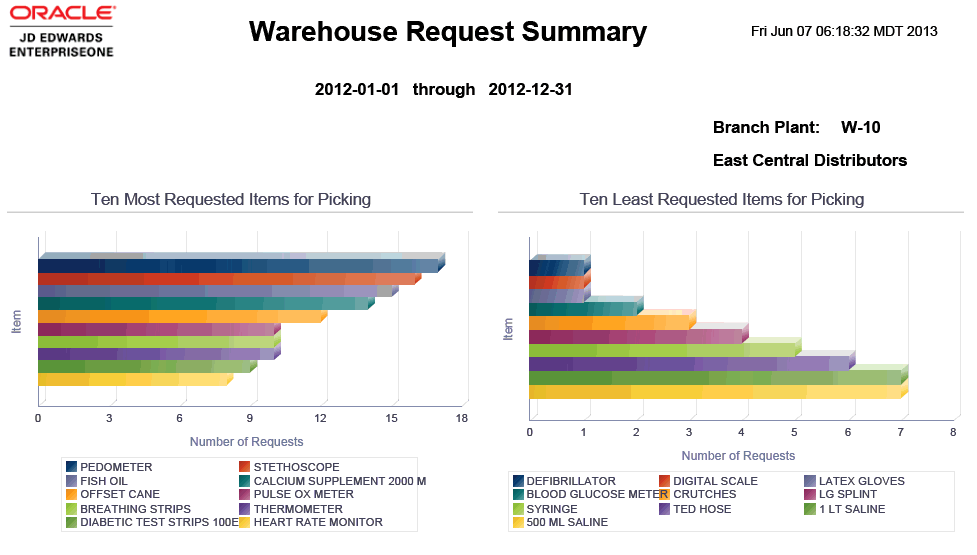
| Ten Most Requested Items for Picking (bar graph) | This bar graph enables you to view the 10 most requested items for picking during a period that you specify. |
| Ten Least Requested Items for Picking (bar graph) | This bar graph enables you to view the 10 least requested items for picking during a period that you specify. |
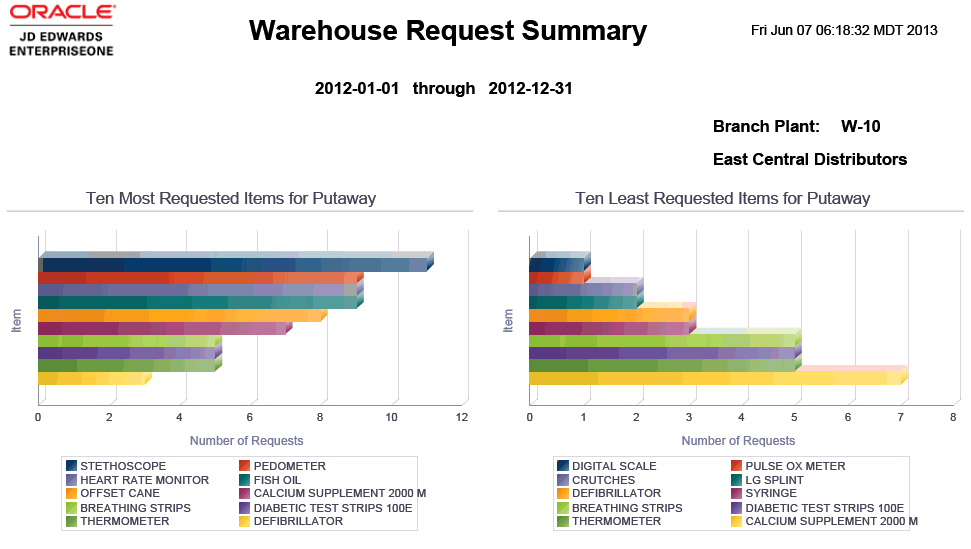
| Ten Most Requested Items for Putaway (bar graph) | This bar graph enables you to view the 10 most requested items for putaway during a period that you specify. |
| Ten Least Requested Items for Putaway (bar graph) | This bar graph enables you to view the 10 least requested items for putaway during a period that you specify. |
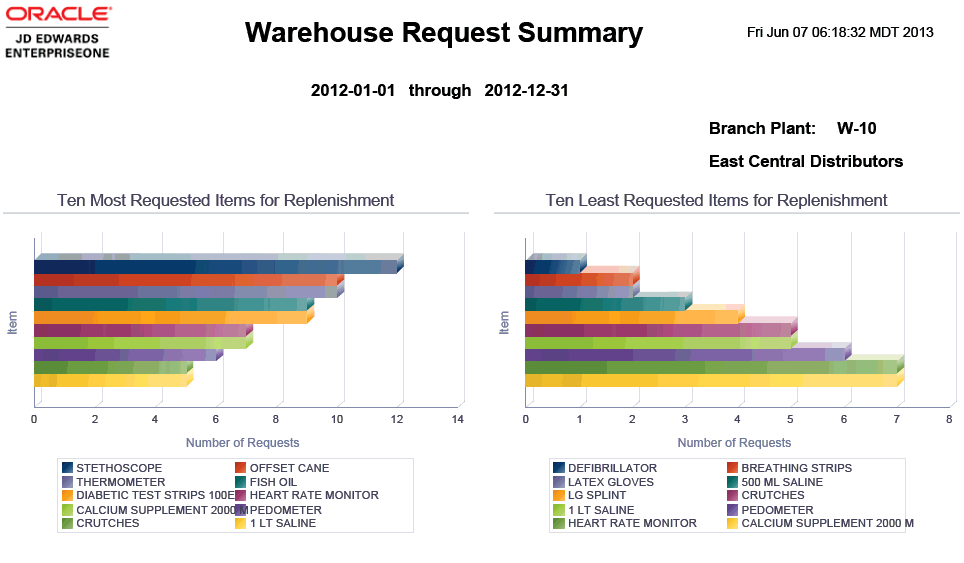
| Ten Most Requested Items for Replenishment (bar graph) | This bar graph enables you to view the 10 most requested items for replenishment during a period that you specify. |
| Ten Least Requested Items for Replenishment (bar graph) | This bar graph enables you to view the 10 least requested items for replenishment during a period that you specify. |
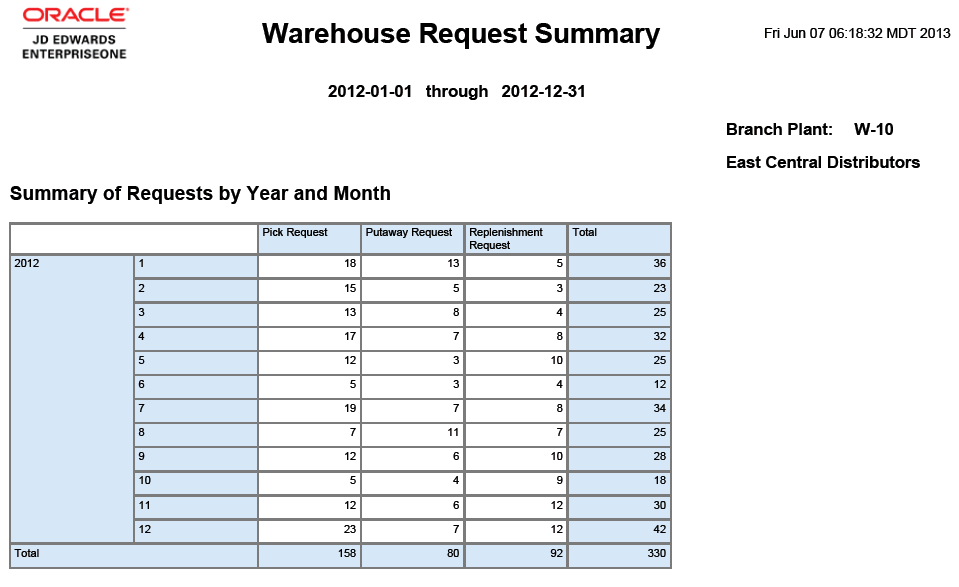
| Summary of Requests by Year and Month (table) | This table displays a historical summary of total picking, putaway, and replenishment requests information used in the graphs for the selected branch/plant. |
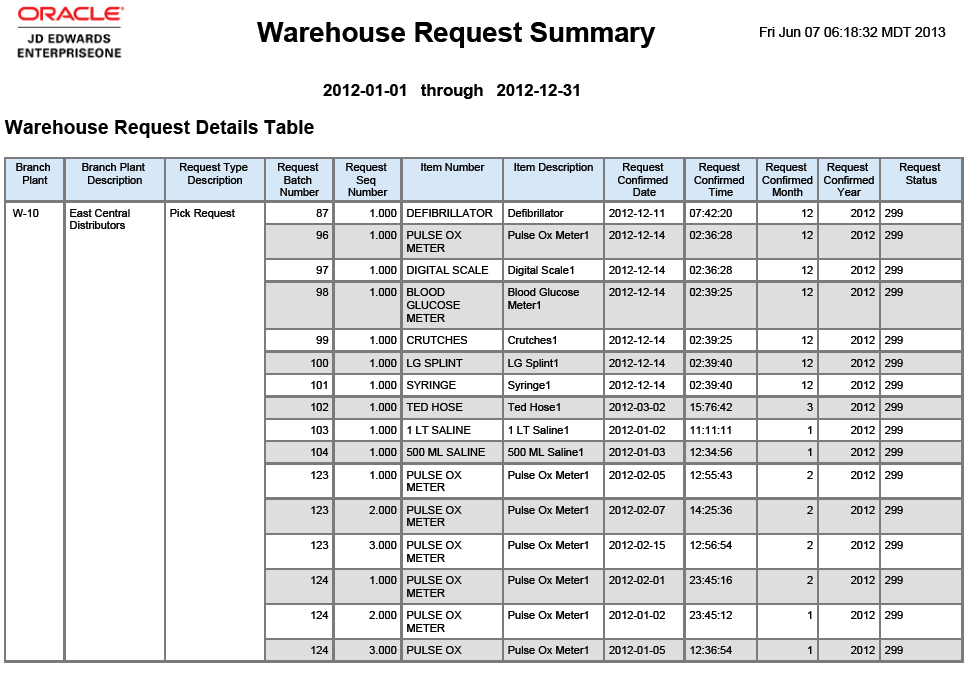
| Warehouse Request Details Table | This table displays all the historical date and time detail records that were used to create the graphs for the selected branch/plant. |
19.2 One View Warehouse Suggestion Inquiry (P46271)
Access the One View Warehouse Suggestion Inquiry application (P46271) on the Warehousing Inquiries & Reports menu (G4614). Use One View Warehouse Suggestion Inquiry to query suggested picking, putaway, and replenishment location information and create suggested picking, putaway, and replenishment location inquiry reports including related data from the Warehouse Suggestions (F4611) and Warehouse Suggestions Tag File (F4611T1) tables. One View Warehouse Suggestion Inquiry uses the One View Warehouse Suggestion Inquiry business view (V46271A), which includes columns from the Warehouse Suggestions table and the Warehouse Suggestions Tag File table.
This application provides the ability to create and run reports on current picking, putaway, and replenishment suggestions for a specific branch/plant. You can set up reports to run based on any combination of filter fields in the header of the One View Warehouse Suggestion Inquiry form. The header filter fields include:
-
Suggestion Creation Date.
Enter the date the warehouse suggestion was created.
-
Branch Plant.
Enter a code that identifies a warehouse branch plant.
-
Suggestion Confirmed Date From
Enter a start date for the suggestion confirmed date range.
-
Suggestion Confirmed Date Thru.
Enter an end date for the suggestion confirmed date range.
19.2.1 Processing Options
There are no processing options for the One View Warehouse Suggestion Inquiry application.
19.2.2 Special Processing
One View Warehouse Suggestion Inquiry processes suggestions to analyze trends for picking, putaway, and replenishment. The system requires a single branch/plant to filter information and design reports for the specified branch/plant.
For the Warehouse Location Velocity Analysis report, the system uses confirmed suggestions over a specified date range to process the Warehouse Location Velocity Analysis report. Before running the report, you must use status 399 (confirmed suggestion) to filter the information.
For the Warehouse Suggestion Productivity Analysis report, the system uses the current system date to report suggestions at all status for a single day.
19.2.3 Reports
The reports delivered with the One View Warehouse Suggestion Inquiry application are:
-
Warehouse Location Velocity Analysis
-
Warehouse Suggestion Productivity Analysis
19.2.3.1 Warehouse Location Velocity Analysis
The Warehouse Location Velocity Analysis report enables you to analyze the warehouse suggestions frequency rate, which is associated with locations and zones, occurs for a specified branch/plant. This report contains the following components:
| Component | Description |
|---|---|
| Ten Most Suggested Picking Locations (bar chart) | This bar chart lists the picking locations with the most confirmed suggestions for a specified period. |
| Ten Least Suggested Picking Locations (bar chart) | This bar chart lists the picking locations with the least confirmed suggestions for a specified period. |
| Ten Most Suggested Putaway Locations (bar chart) | This bar chart lists the putaway locations with the most confirmed suggestions for a specified period. |
| Ten Least Suggested Putaway Locations (bar chart) | This bar chart lists the putaway locations with the least confirmed suggestions for a specified period. |
| Percentage of Pick Suggestions by Zone (pie chart) | This pie chart enables you to view the percent of confirmed pick suggestions categorized by picking zone. |
| Percentage of Putaway Suggestions by Zone (pie chart) | This pie chart enables you to view the percent of confirmed putaway suggestions categorized by putaway zone. |
| Percentage of Replenishment Suggestions by Zone (pie chart) | This pie chart enables you to view the percent of confirmed replenishment suggestions categorized by replenishment zone. |
| Number of Pick Suggestions by Zone (table) | This table displays a historical summary of total confirmed pick suggestions by zone. This information is used in the graphs for the selected branch/plant. |
| Number of Putaway Suggestions by Zone (table) | This table displays a historical summary of total confirmed putaway suggestions by zone. This information is used in the graphs for the selected branch/plant. |
| Number of Replenishment Suggestions by Zone (table) | This table displays a historical summary of total confirmed replenishment suggestions by zone. This information is used in the graphs for the selected branch/plant. |
| Warehouse Location Velocity Details Table | This table displays all of the historical detail records for picking, putaway, and replenishment suggestions. This information includes locations, zones, batch numbers, and sequence numbers. The system uses this information to create the graphs and charts for the selected branch/plant. |
19.2.3.2 Warehouse Suggestion Productivity Analysis
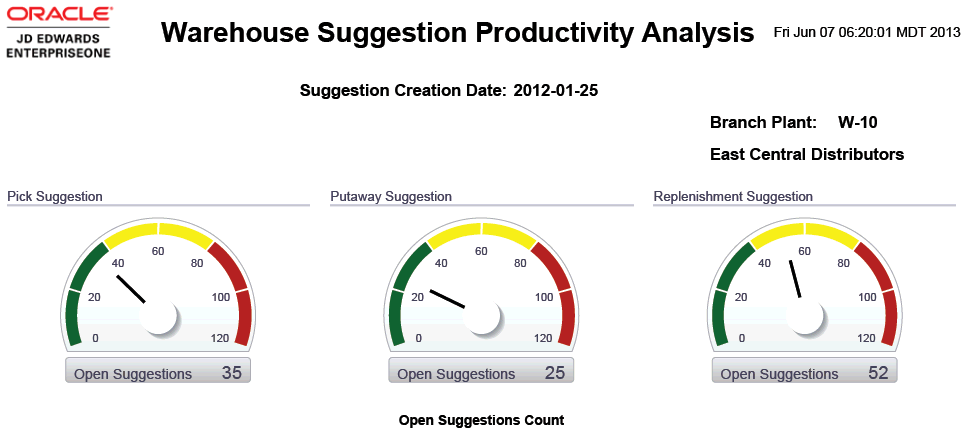
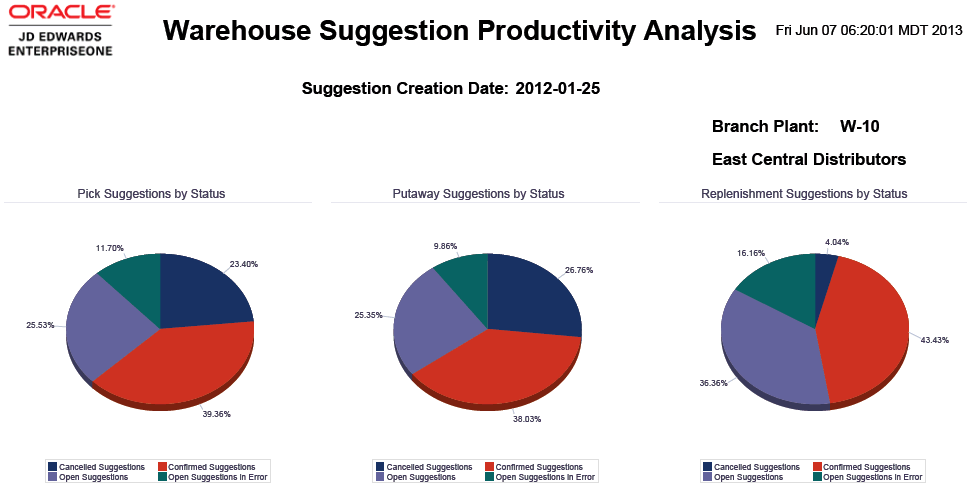
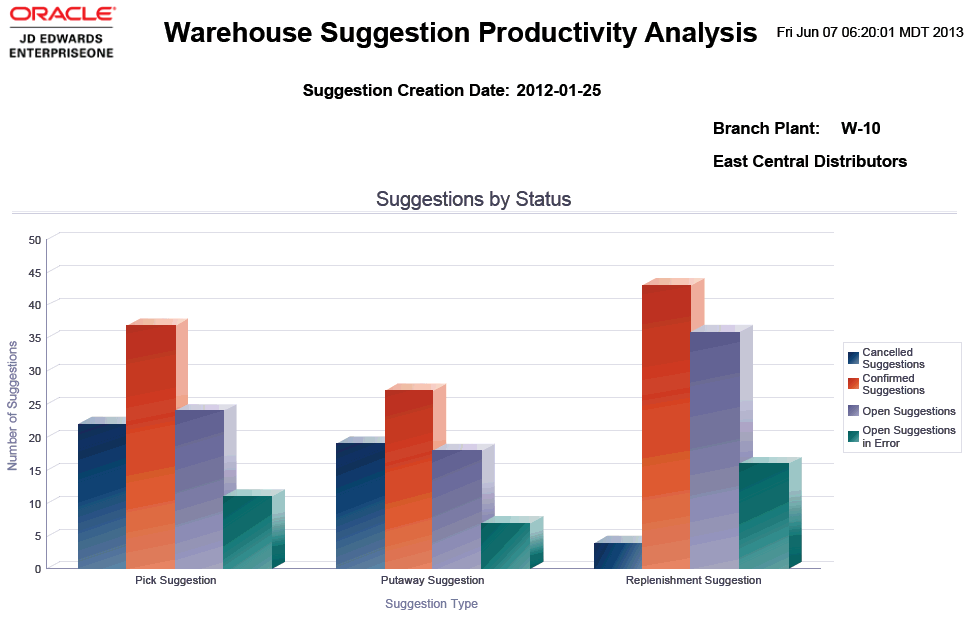
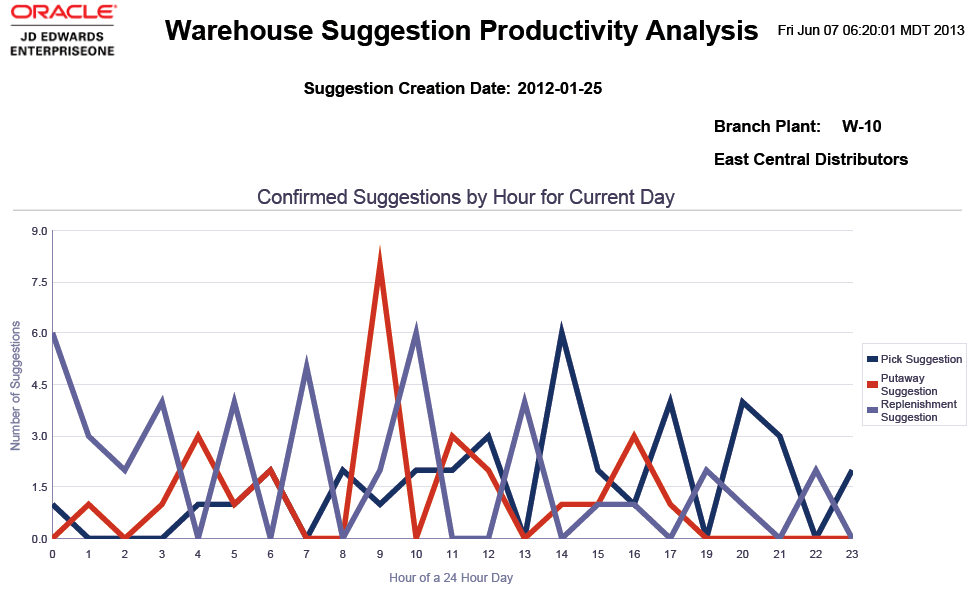
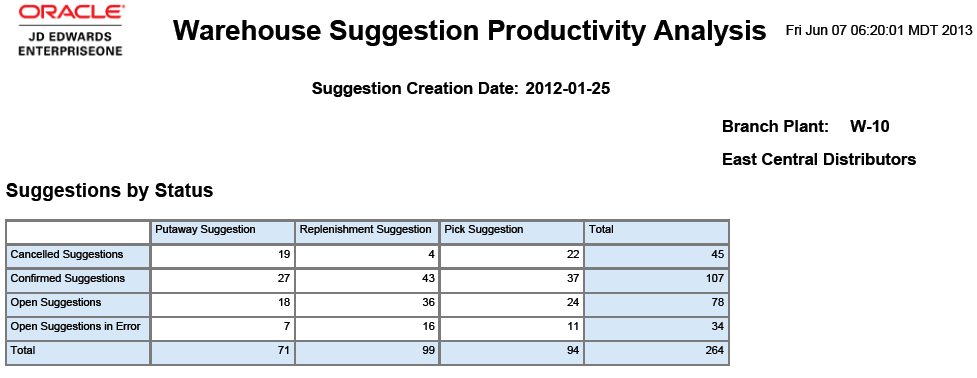
The Warehouse Suggestion Productivity Analysis report enables you to view warehouse suggestion information for a specified day.
|
Note: Three of the components use a color coded gauge to report results. The color codes are to be interpreted as follows:
|
This report contains the following components:
| Component | Description |
|---|---|
| Open Pick Suggestions (gauge) | This gauge enables you to quickly estimate the number of open pick suggestions for the selected day. The gauge displays three color-coded categorical ranges:
|
| Open Putaway Suggestions (gauge) | This gauge enables you to quickly estimate the number of open putaway suggestions for the selected day. The gauge displays three color-coded categorical ranges:
|
| Open Replenishment Suggestions (gauge) | This gauge enables you to quickly estimate the number of open replenishment suggestions for the selected day. The gauge displays three color-coded categorical ranges:
|
| Pick Suggestions by Status (pie chart) | This pie chart enables you to view the total number of pick suggestions for the selected day. The total count reflects pick suggestions that are open, confirmed, and cancelled. |
| Putaway Suggestions by Status (pie chart) | This pie chart enables you to view the total number of putaway suggestions for the selected day. The total count reflects pick suggestions that are open, confirmed, and cancelled. |
| Replenishment Suggestions by Status (pie chart) | This pie chart enables you to view the total number of replenishment suggestions for the selected day. The total count reflects pick suggestions that are open, confirmed, and cancelled. |
| Suggestions by Status (bar chart) | This bar chart enables you to compare pick, putaway, and replenishment suggestions for the selected day based on status. The statuses are divided into four categories:
|
| Confirmed Suggestions by Hour for Current Day (line chart) | This line graph enables you to view the number of confirmed warehouse suggestions each hour for the selected day. |
| Suggestions by Status (table) | This table displays a historical summary of total picking, putaway, and replenishment suggestions categorized by status. The respective suggestions are categorized by four statuses: open suggestions, cancelled suggestions, confirmed suggestions, and open suggestions in error. The system uses this information in the graphs for the selected branch/plant. |
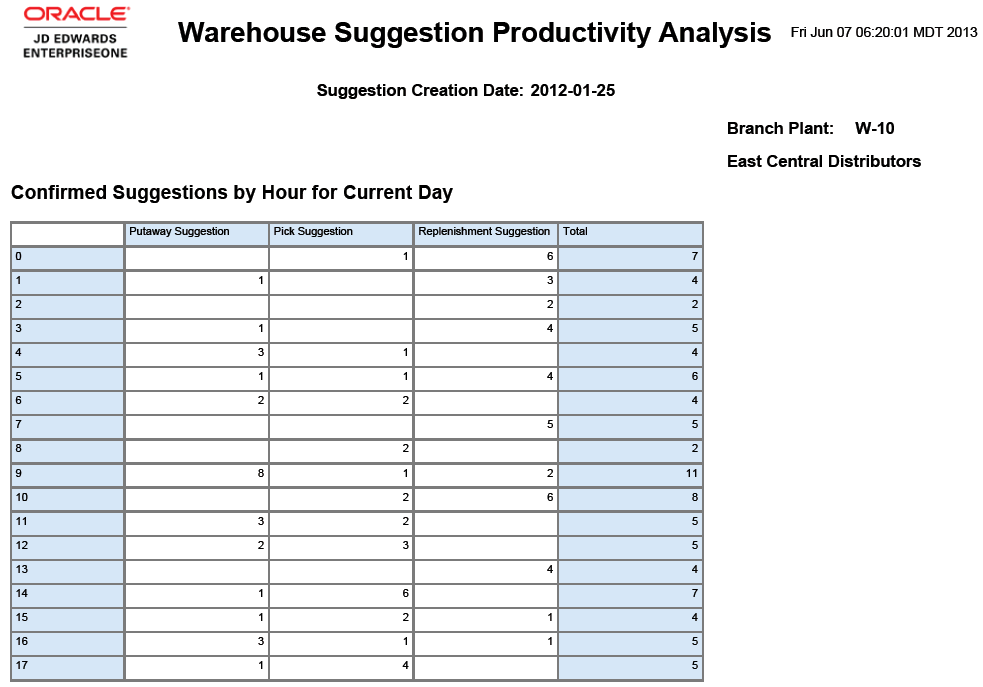
| Confirmed Suggestions by Hour for Current Day (table) | This table displays a historical summary of total picking, putaway, and replenishment suggestions that are confirmed each hour of the selected day. The system uses this information in graphs for the selected branch/plant. |
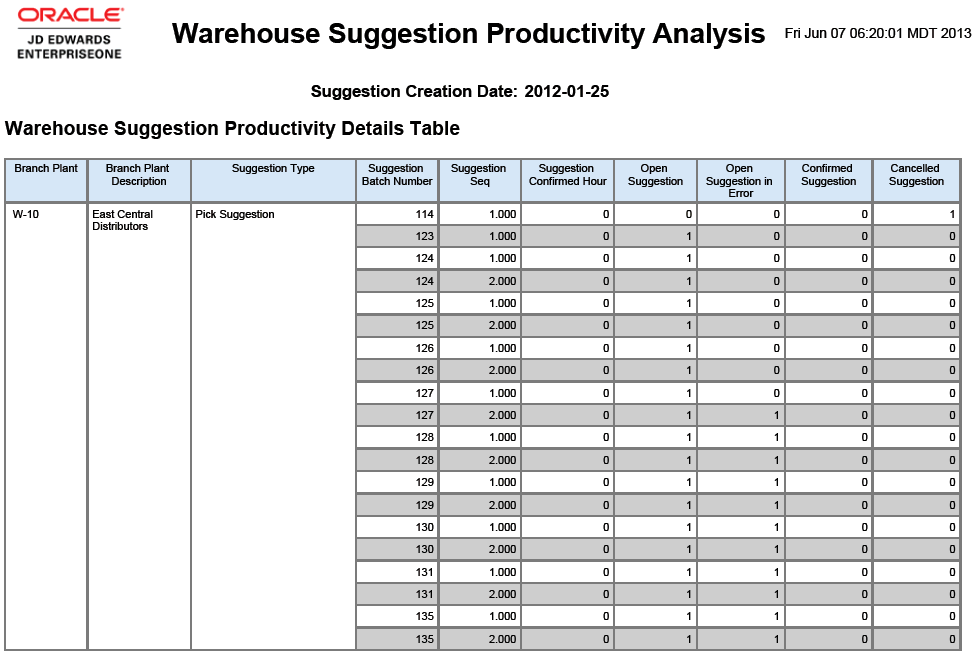
| Warehouse Suggestion Productivity Details Table | This table displays all of the historical detail records for picking, putaway, and replenishment suggestions. This information includes statuses, batch numbers, sequence numbers, and the hour the suggestion is confirmed. The system uses this information to create the graphs and charts for the selected branch/plant. |
The system indicates that the suggestion is open, confirmed, or cancelled by inserting 1 in the respective column fields.
The system inserts 0 to indicate that the suggestions are not open, confirmed, or cancelled in accordance with the status criteria.
| Suggestion | Status |
|---|---|
| Open Suggestion | 300 and 340 |
| Open Suggestion in Error | 300 and 340 |
| Confirmed Suggestion | 399 |
| Cancelled Suggestion | 391 |
19.3 One View License Plate Quantity Inquiry (P46L272)
Access the One View License Plate Quantity Inquiry application (P46L272) on the Warehousing Inquiries & Reports menu (G4614). Use One View License Plate Quantity Inquiry to query license plate information associated with locations. The report includes related data from the Item Location File (F41021), Lot Master (F4108), and License Plate Item Detail (F46L11) tables. One View License Plate Quantity Inquiry uses the One View License Plate Quantity Inquiry business view (V46L272A), which includes columns from the Item Location File, Lot Master, and License Plate Item Detail tables.
The application provides the ability to create and run reports to display the license plate numbers associated to the location and compare how much of the location has been utilized by the license plate to how much capacity the location can support. You can set up reports to run based on any combination of filter fields in the header of the One View License Plate Quantity Inquiry form. The header filter fields include:
-
Item Number.
Enter a number that the system assigns to an item. It can be in short, long, or third item number format.
-
Branch/Plant.
Enter a code that identifies a warehouse branch plant.
-
Location.
Enter the location that you want to inquire on.
-
Lot/Serial Number.
Enter a number that identifies a lot or a serial number. A lot is a group of items with similar characteristics.
19.3.1 Processing Options
There are no processing options for the One View License Plate Quantity Inquiry application.
19.3.2 Special Processing
Before you use this application, you must set up the branch/plant to process license plates. If the branch/plant is not set up to process license plates, the system displays an error message. You can activate license plates for a branch/plant only if there are no records in the Location Detail Information (F4602) table for that branch/plant.
19.3.3 Reports
The report delivered with the One View License Plate Quantity Inquiry is the License Plate Quantity Analysis report.
19.3.3.1 License Plate Quantity Analysis
The License Plate Quantity Analysis report enables you to view license plate quantity associated with locations assigned to a specified branch/plant. This report contains the following components:
| Component | Description |
|---|---|
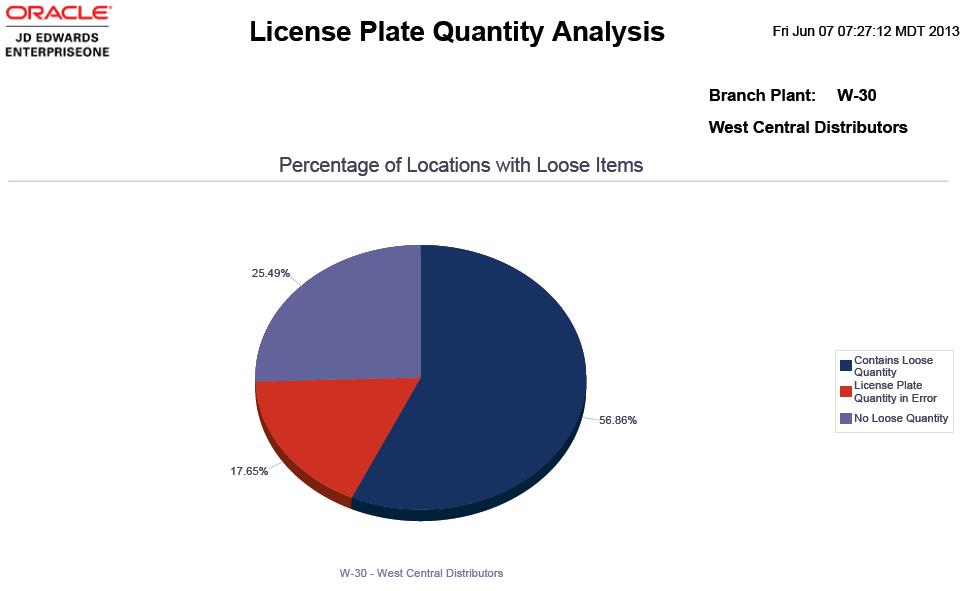
| Percentage of Locations with Loose Items (pie chart) | This pie chart enables you to quickly identify the percent of locations that contain loose items compared to the percent of locations that do not contain loose items. |
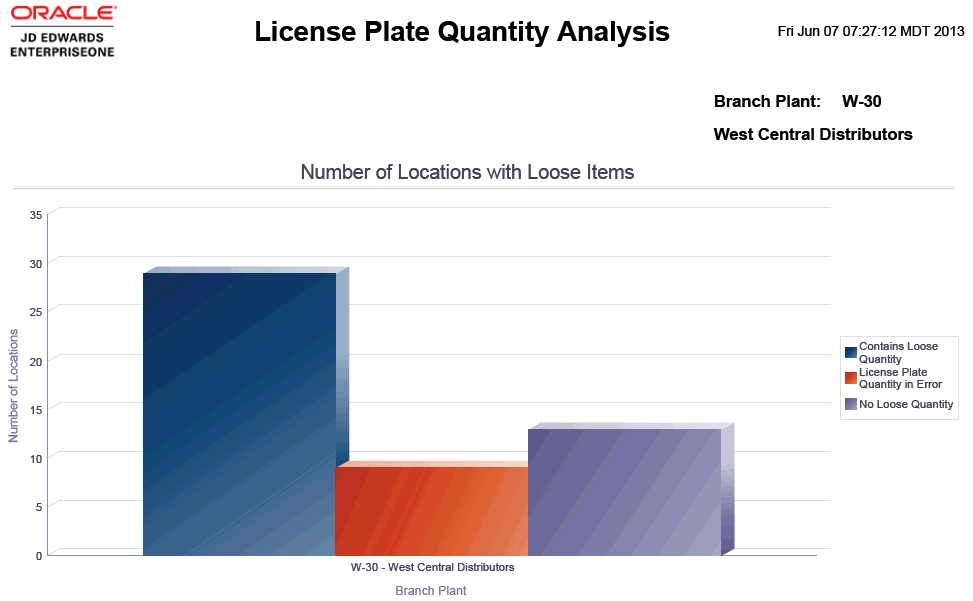
| Number of Locations with Loose Items (bar chart) | This bar chart enables you to view the number of locations that contain loose items compared to the number of locations that do not contain loose items. |
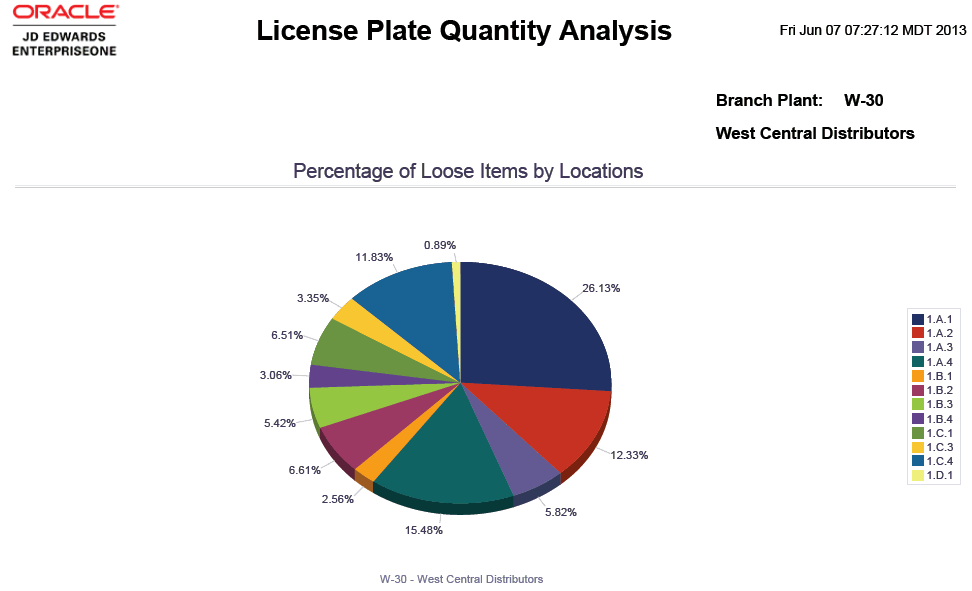
| Percentage of Loose Items by Locations (pie chart) | This pie chart enables you to identify the locations with loose items and the specific items that are loose in those locations. |
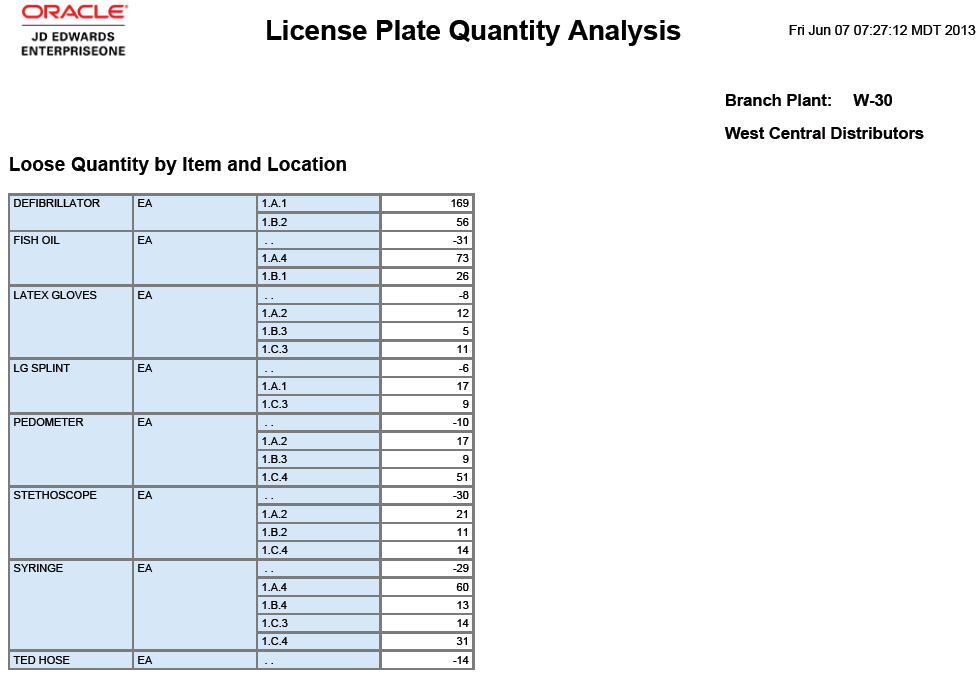
| Loose Quantity by Item and Location (table) | This table displays a historical summary of the total number of loose items and the locations in which these items are currently stored in the warehouse. The system uses this information in graphs for the selected branch/plant. |
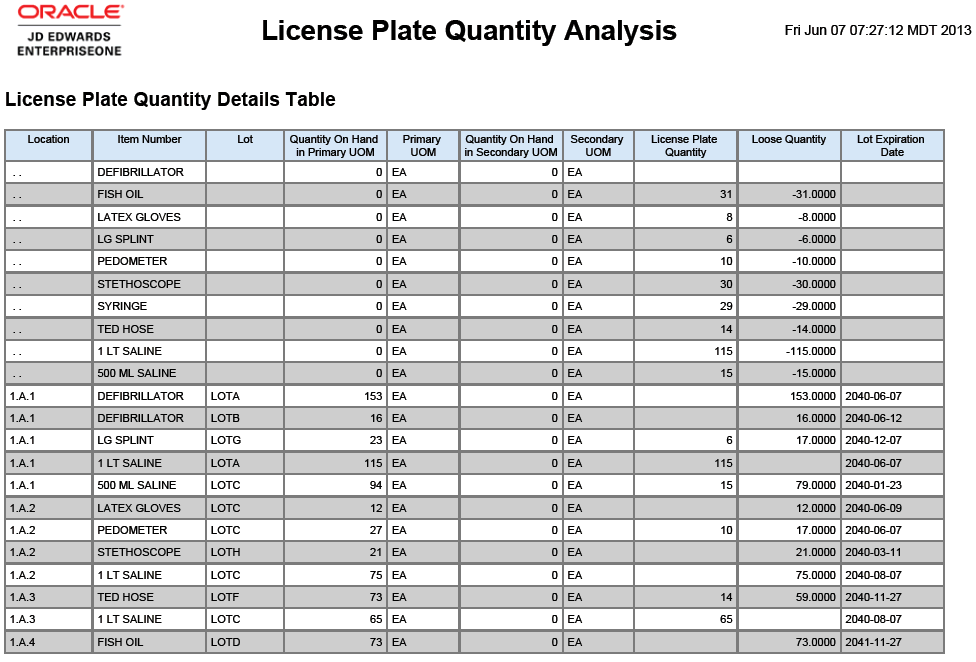
| License Plate Quantity Details Table | This table displays all of the historical detail records for license plate quantities. This information includes item number, location, lot, license plates and quantity. The system uses this information to create the graphs and charts for the selected branch/plant. |
19.4 One View Warehouse Location Inquiry (P46273)
Access the One View Warehouse Location Inquiry application (P46273) on the Warehousing Inquiries & Reports menu (G4614). Use One View Warehouse Location Inquiry to query location capacity and percentage fill information and create reports that provide a snapshot of the capacity and percentage fill of a location in the warehouse. The reports include related data from the Location Master (F4100), Location Detail (F4602), Location Dimensions (F46022), License Plate Items (F46l11), and LPN Location Capacity (F46L30) tables. One View Warehouse Location Inquiry uses the One View Warehouse Location Inquiry business view (V46273A), which includes columns from the Location Master, Location Detail, Location Dimensions, License Plate Items and LPN Location Capacity tables.
This application provides the ability to query by percentage of space used and display all the locators below or above a certain percentage. It can also be used to find empty locators. The percentage usage can be queried by units, volume, and weight. Distribution managers may use this information to create replenishment transactions, run the min-max report, or analyze item locator storage relationships. You can set up reports to run based on any combination of filter fields in the header of the One View Warehouse Location Inquiry form. The header filter fields include:
-
As If Volume UOM (unit of measure).
This field identifies the As If Volume UOM as entered in Warehouse Location Inquiry header.
-
As If Dimension UOM (unit of measure).
This field identifies the As If Dimension UOM as entered in the Warehouse Location Inquiry header.
-
As If Weight UOM (unit of measure).
This field identifies the As If Weight UOM as entered in the Warehouse Location Inquiry header.
-
Branch/Plant.
Enter a code that identifies a warehouse branch plant.
19.4.1 Processing Options
There are no processing options for the One View Warehouse Location Inquiry application.
19.4.2 Special Processing
The system requires a single branch/plant to filter information and design reports for the specified branch/plant.
19.4.3 Reports
The reports delivered with the One View Warehouse Location Inquiry application are:
-
Warehouse Location Usage Analysis
-
Warehouse Utilization Analysis
19.4.3.1 Warehouse Location Usage Analysis
The Warehouse Location Usage Analysis report enables you to view areas within the warehouse to determine location usage with zones, aisles, and dimension groups. This report contains the following components:
| Component | Description |
|---|---|
| Percentage of Locations Used in the Warehouse (pie chart) | This pie chart enables you to view the percentage of locations in the warehouse that currently contain inventory and those that do not currently contain inventory. |
| Number of Locations by Pick Zone (bar chart) | This bar chart enables you to review and compare the locations containing inventory with empty locations in each of the respective picking zones in your warehouse. |
| Number of Locations by Putaway Zone (bar chart) | This bar chart enables you to review and compare the locations containing inventory with empty locations in each of the respective putaway zones in your warehouse. |
| Number of Locations by Replenishment Zone (bar chart) | This bar chart enables you to review and compare the locations containing inventory with empty locations in each of the respective replenishment zones in your warehouse. |
| Number of Locations by Aisle (bar chart) | This bar chart enables you to review and compare the locations containing inventory with empty locations in each of the respective aisles in your warehouse. This bar chart also displays the number of locations within each aisle that contain mixed items. |
| Number of Locations by Dimension Group (bar chart) | This bar chart enables you to review and compare the locations containing inventory with empty locations in each of the respective dimension groups in your warehouse. |
| Number of Locations by Pick Zone (table) | This table displays a historical summary of total number of locations assigned to a picking zone. This information is categorized by the number of locations containing inventory, number of locations containing mixed items, and number of empty locations. The system uses this information in graphs for the selected branch/plant. |
| Number of Locations by Putaway Zone (table) | This table displays a historical summary of total number of locations assigned to a putaway zone. This information is categorized by the number of locations containing inventory, number of locations containing mixed items, and number of empty locations. The system uses this information in graphs for the selected branch/plant. |
| Number of Locations by Replenishment Zone (table) | This table displays a historical summary of total number of locations assigned to a replenishment zone. This information is categorized by the number of locations containing inventory, number of locations containing mixed items, and number of empty locations. The system uses this information in graphs for the selected branch/plant. |
| Number of Locations by Aisle (table) | This table displays a historical summary of total number of locations in an aisle in the warehouse. This information is categorized by the number of locations containing inventory, number of locations containing mixed items, and number of empty locations. The system uses this information in graphs for the selected branch/plant. |
| Warehouse Location Usage Details Table | This table displays all of the historical detail records for picking, putaway, and replenishment zones; and dimension groups. This information includes locations, volume, and unit of measure. The system uses this information to create the graphs and charts for the selected branch/plant. |
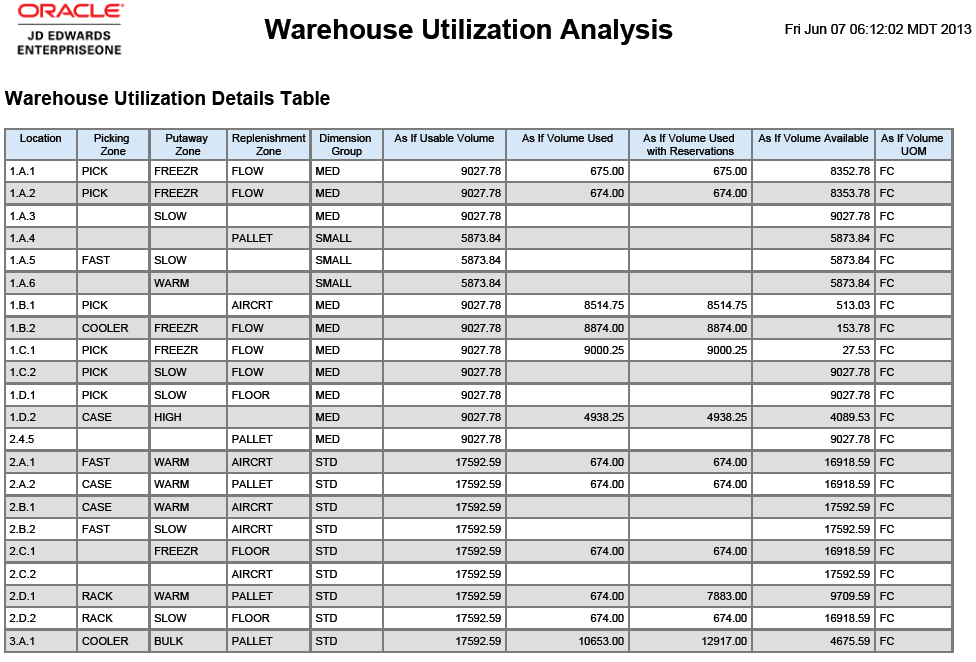
19.4.3.2 Warehouse Utilization Analysis
The Warehouse Utilization Analysis report enables you to view areas within the warehouse to determine location volume usage with zones and aisles. This report contains the following components:
| Component | Description |
|---|---|
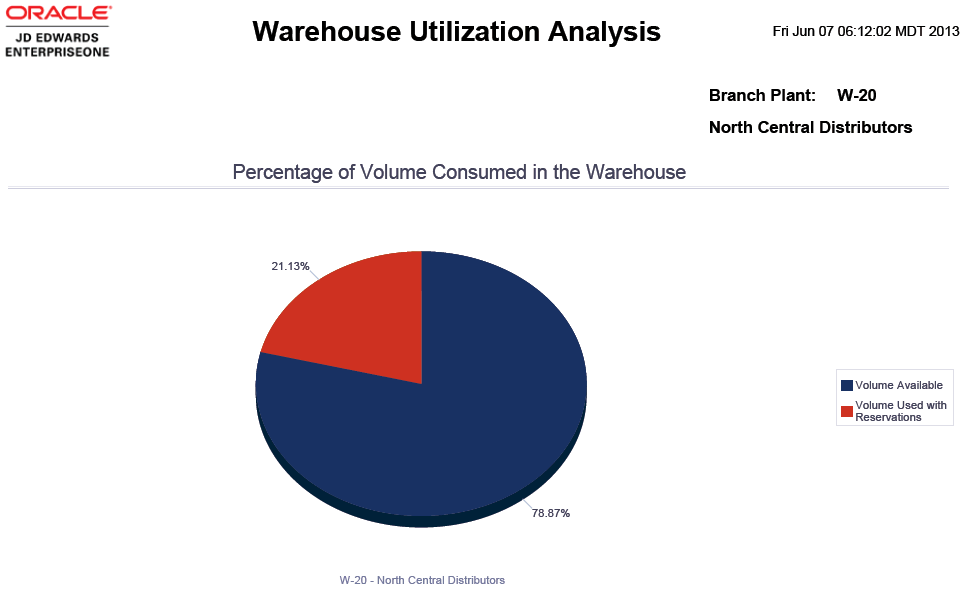
| Percent of Volume Consumed in the Warehouse (pie chart) | This pie chart enables you to view the combined total of the available volume in the warehouse plus the used volume in the warehouse. The used volume includes reservations. |
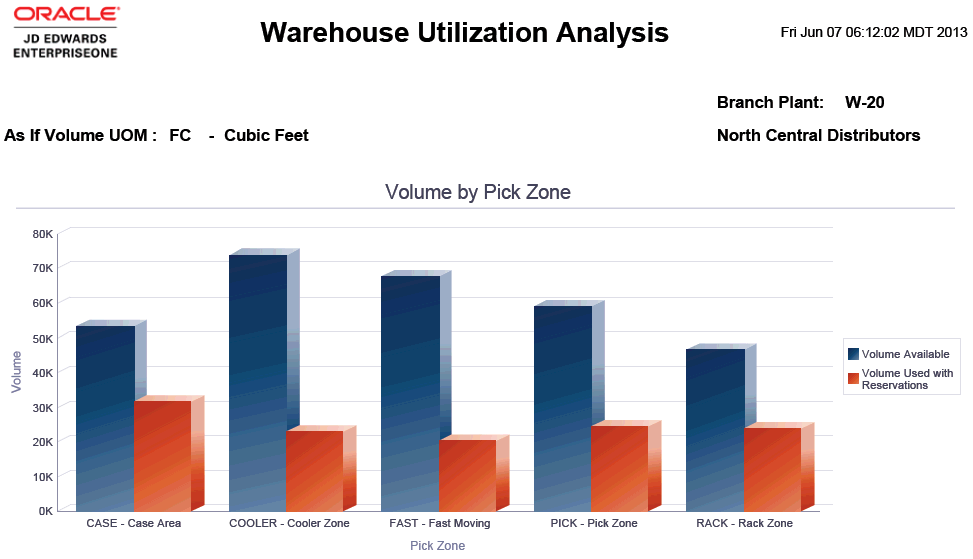
| Volume by Pick Zone (bar chart) | This bar chart enables you to review and compare the available and used volume in each of the respective picking zones in your warehouse. |
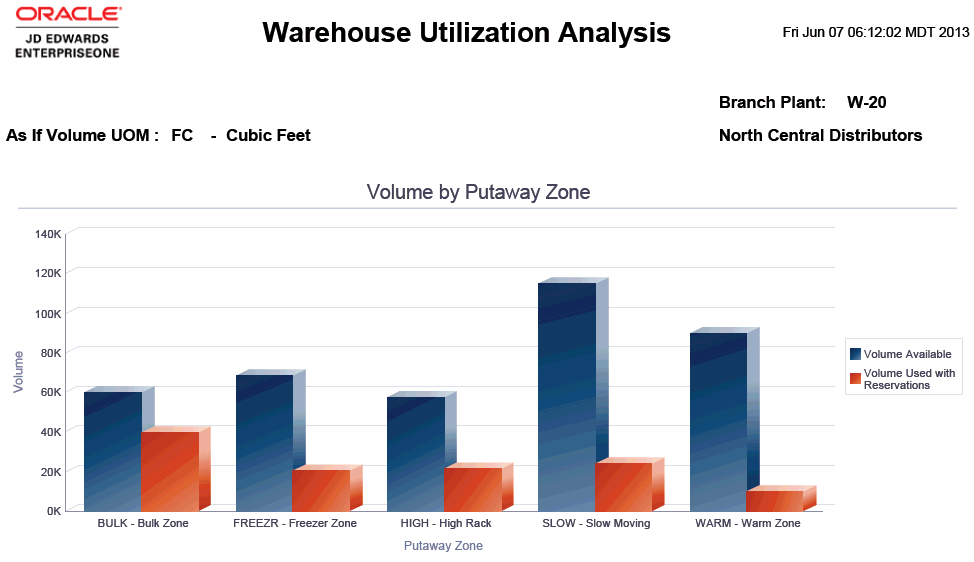
| Volume by Putaway Zone (bar chart) | This bar chart enables you to review and compare the available and used volume in each of the respective putaway zones in your warehouse. |
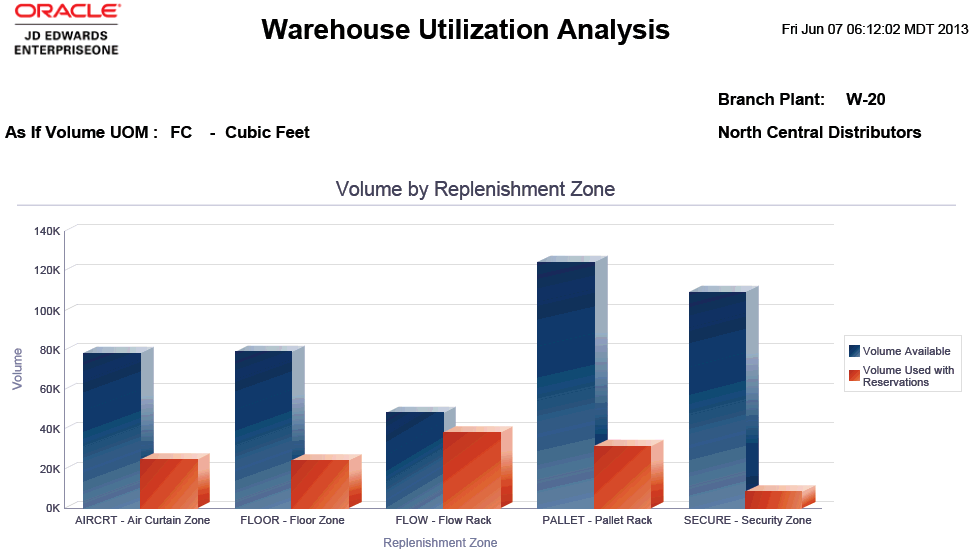
| Volume by Replenishment Zone (bar chart) | This bar chart enables you to review and compare the available and used volume in each of the respective replenishment zones in your warehouse. |
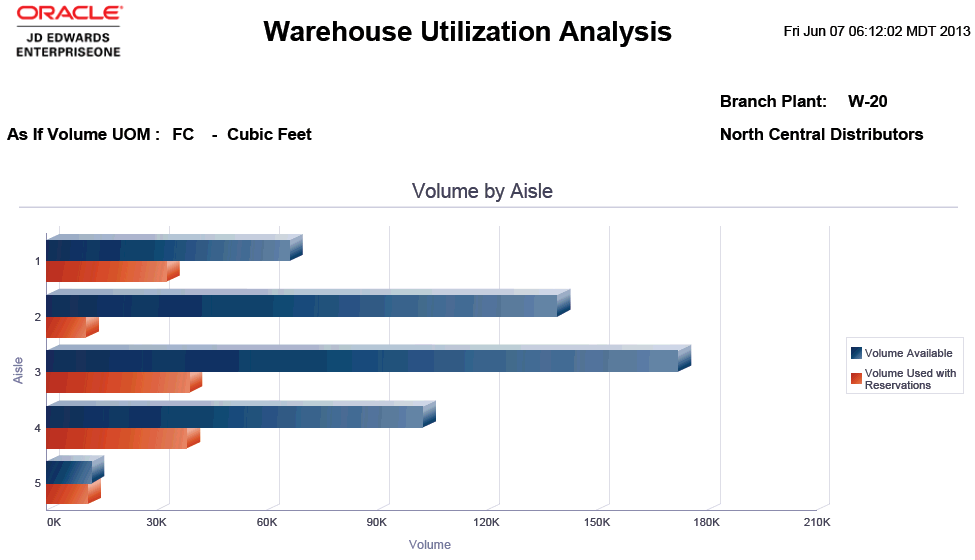
| Volume by Aisle (bar chart) | This bar chart enables you to review and compare the available and used volume in each of the respective aisles in your warehouse. |
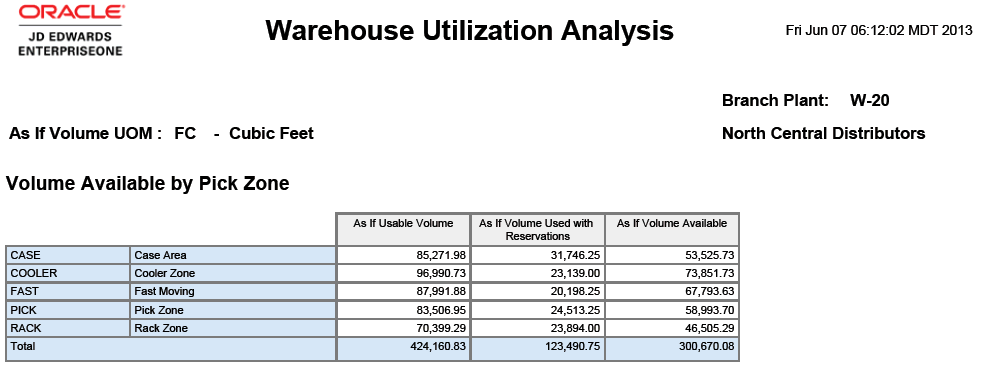
| Volume Available by Pick Zone (table) | This table displays a historical summary of total volume available in the selected UOM in the picking zones of the warehouse. This information is categorized by the total as if usable volume, as if volume used with reservations, and as if volume available. The system uses this information in graphs for the selected branch/plant. |
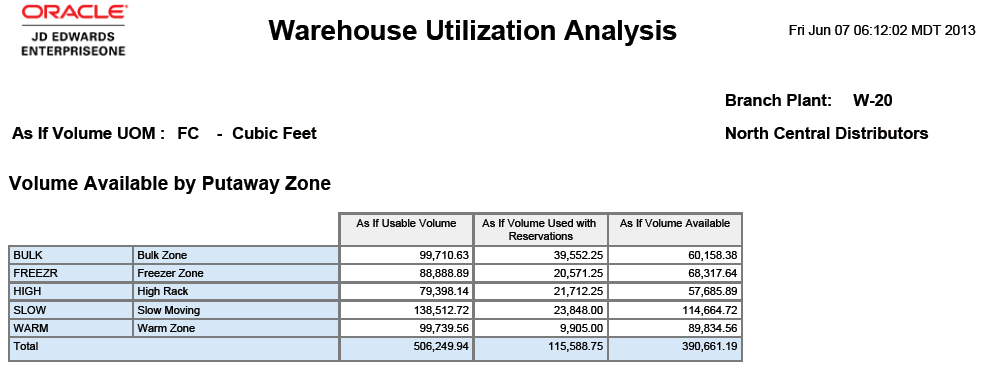
| Volume Available by Putaway Zone (table) | This table displays a historical summary of total volume available in the selected UOM in the putaway zones of the warehouse. This information is categorized by the total as if usable volume, as if volume used with reservations, and as if volume available. The system uses this information in graphs for the selected branch/plant. |
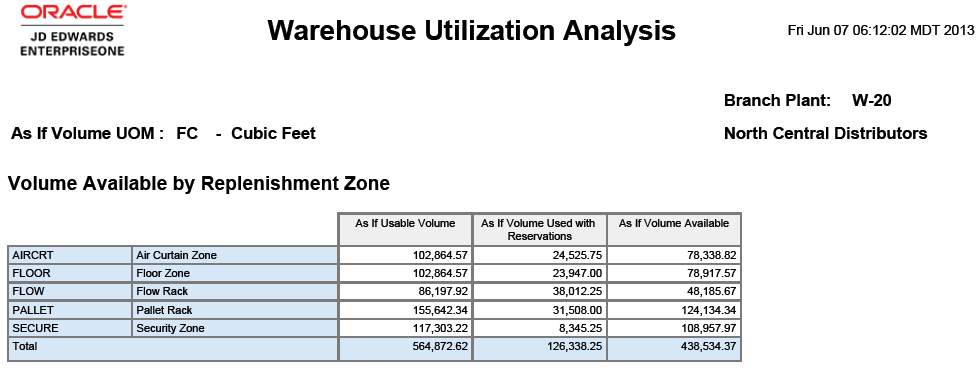
| Volume Available by Replenishment Zone (table) | This table displays a historical summary of total volume available in the selected UOM in the replenishment zones of the warehouse. This information is categorized by the total as if usable volume, as if volume used with reservations, and as if volume available. The system uses this information in graphs for the selected branch/plant. |
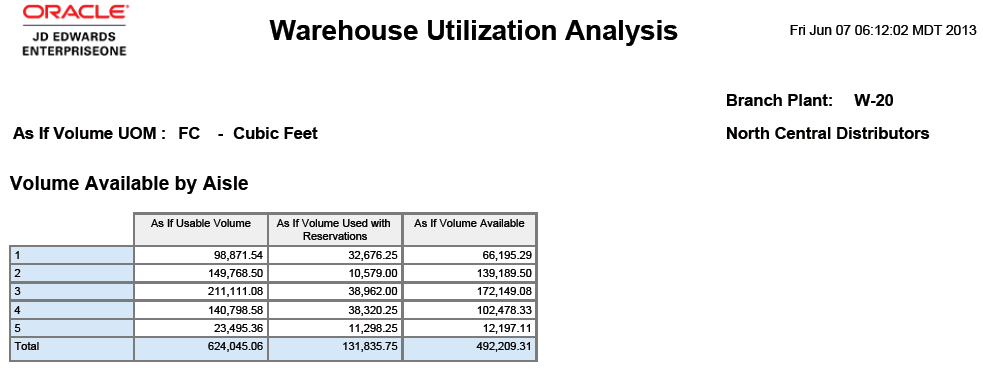
| Volume Available by Aisle (table) | This table displays a historical summary of total volume available in the selected UOM in the aisles of the warehouse. This information is categorized by the total as if usable volume, as if volume used with reservations, and as if volume available. The system uses this information in graphs for the selected branch/plant. |
| Warehouse Utilization Details Table | This table displays all of the historical detail records for picking, putaway, and replenishment zones; and dimension groups. This information includes locations, volume usage and availability; and unit of measure. The system uses this information to create the graphs and charts for the selected branch/plant. |
