7 Simulating Profit and Revenue
This chapter contains the following topics:
7.1 Understanding Profit and Revenue Simulation
Insight into revenue and profit drivers improve executive decision making for product pricing and reduces the risk of incorrect pricing. When sales executives can analyze "what if" scenarios, they gain visibility into factors that drive revenue and profit and make informed decisions on future pricing and sales. The variability of cost, price, and forecasts impact both profit and revenue. To analyze the impact of changes to these factors, executives must run multiple scenarios or simulations.
The JD Edwards EnterpriseOne In-Memory Sales Advisor solution provides real-time "what if" profit simulations. You can simulate changing cost and price conditions along with forecasted demand and sales history, to immediately view the impact on revenue and profit. Analysis on "what if" scenarios using large volumes of data enable you to make quick and informed decisions. The Profitability Simulator program (P42X20) enables you to run and analyze simulations for a variety of changing conditions quickly without creating batch applications or custom reports. This eliminates the need to inquire on cost, price, and forecasts, export the data to a spreadsheet, and then create scenarios within the spreadsheet to determine how changes to these factors impact revenue and profit.
Profit and revenue simulation also enhances price management by providing you the ability to simulate profit and revenue scenarios based on price and cost changes. You use the Profitability Simulator feature to:
-
Analyze sales history and forecast demand to facilitate product pricing.
-
Execute future price changes based on analysis.
-
Enhance price negotiations.
-
Improve customer relationships.
-
Improve price management.
You can enter item and customer information along with price and cost information to simulate price, cost, profit margin, revenue, and profit.
7.2 Working With the Profitability Simulator Program
This section provides an overview of the Profitability Simulator program (P42X20) and discusses how to:
-
Set processing options for the Profitability Simulator program (P42X20).
-
Work with profit and revenue simulations.
7.2.1 Understanding the Profitability Simulator Program (P42X20)
The Profitability Simulator program (P42X20) enables you to view and compare profit and revenue scenarios for a specified period with graphic chart display. You can set processing options to specify:
-
Whether the system displays or hides the charts.
-
The order in which the system displays the charts.
-
Whether the Profitability Simulator program opens in comparison mode or single mode.
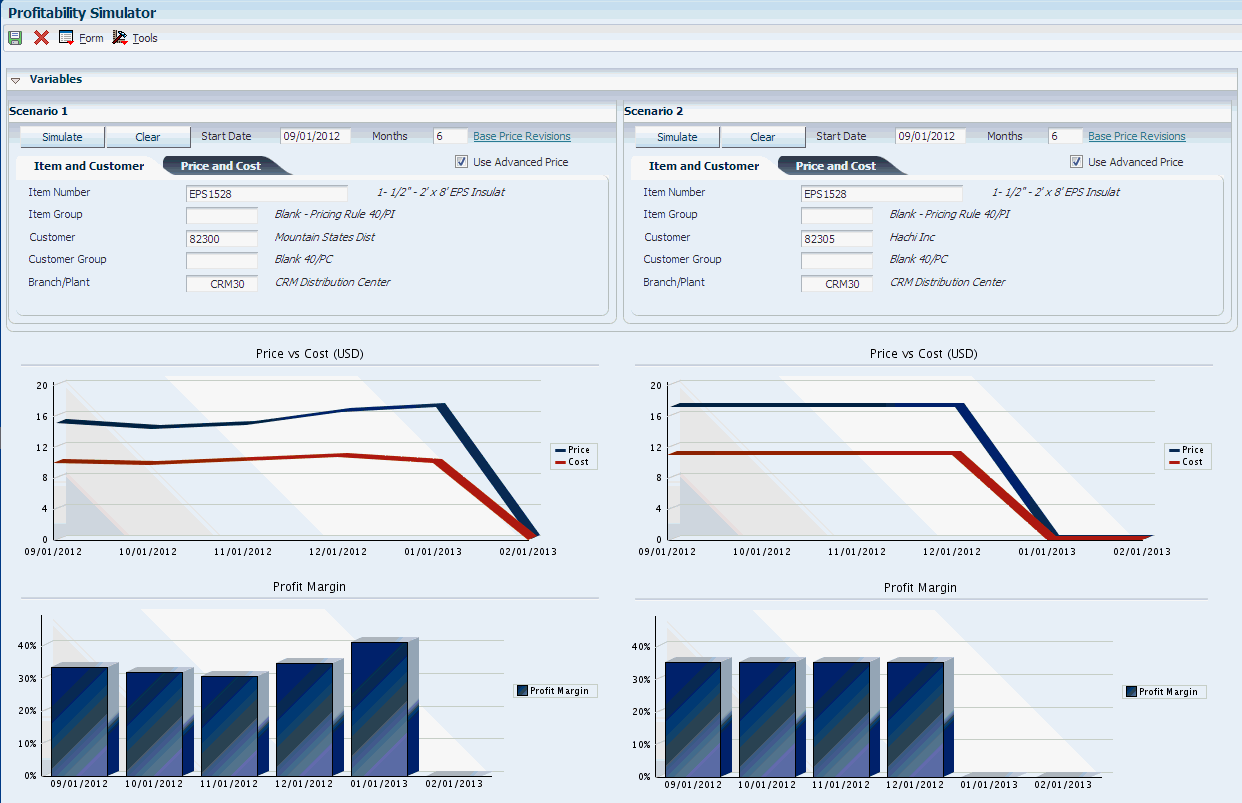
Comparison mode is a vertical side-by-side format that enables you to compare two profit scenarios on the same form.
You can define the document types to display for past sales order information. Past sales information includes data stored in the Sales Order Detail File (F4211) and Sales Order History (F42119) tables.
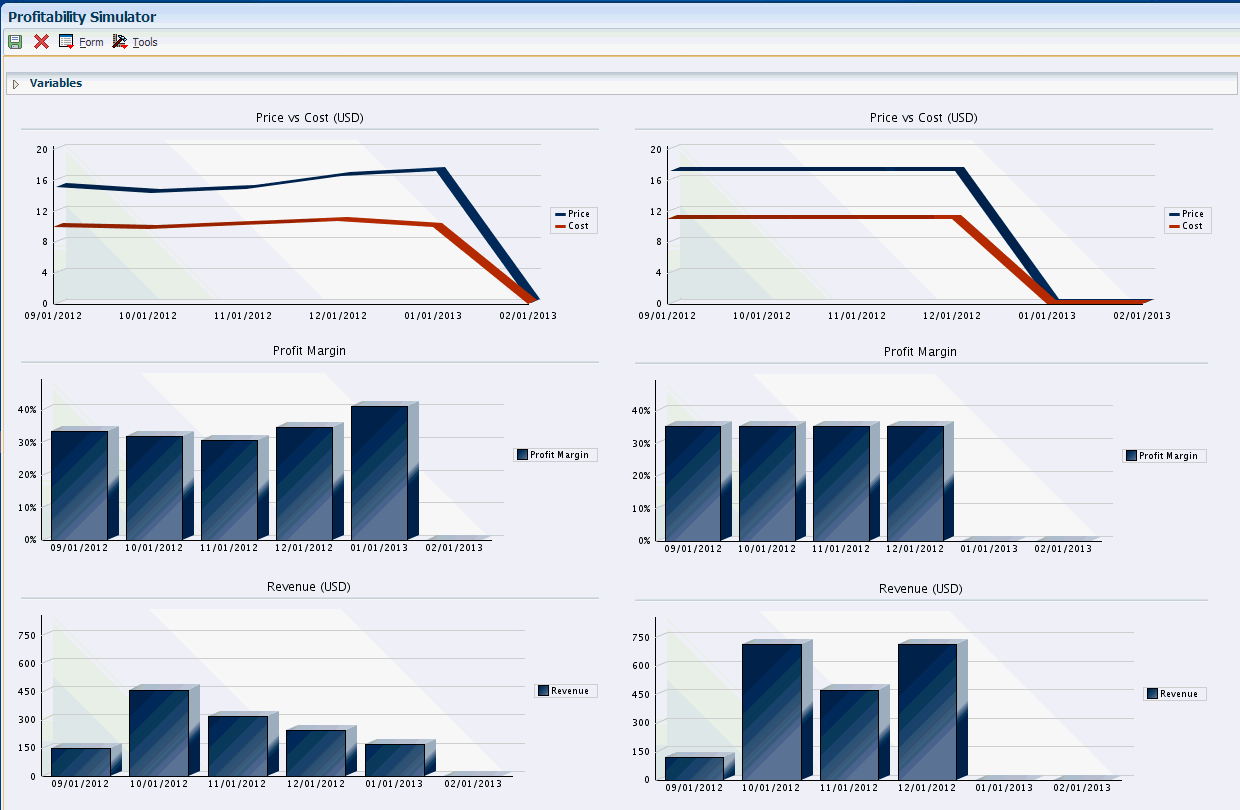
The Profitability Simulator program displays charts that depict information related to price and cost comparison, profit margin, revenue, and profit. The system uses historical data stored in the Sales Order Detail (F4211) and Sales Order History Files (F42119) tables. For future quantities and price information, the system uses information stored in the Forecast File (F3460), Item Base Price File (F4106), and Item Cost File (F4105) tables. If you select the Use Advance Price option, the system uses the item price information stored in the Price Adjustment Details table (F4072).
Each chart displays its respective information based on the period type (weekly, monthly, quarterly, yearly) and the number of periods that you specify in the processing options on the Process tab. However, you can change the number of periods while using the Profitability Simulator form. You can set the Profitability Simulator program to display these charts:
-
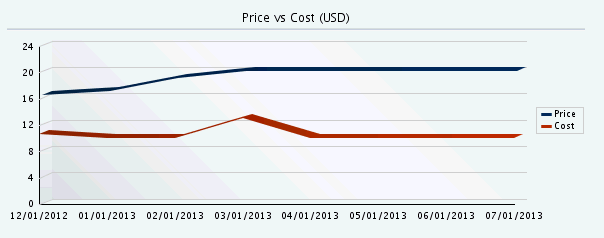
This line chart displays two lines that compare the item price to the item cost for the specified number of periods.
The x-axis is the date with increments based upon the number of periods. The y-axis is the currency amount. The currency is built into the chart title when you activate multicurrency processing.
-
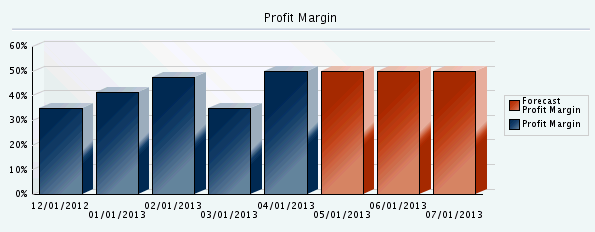
This bar chart displays a vertical bar for each period based on the number of periods that you specify. It compares the profit margin for each period to show you a view of historical and forecast trends based on the start date that you specify.
The x-axis is the date with increments based upon the number of periods. The y-axis is the profit margin percent.
-
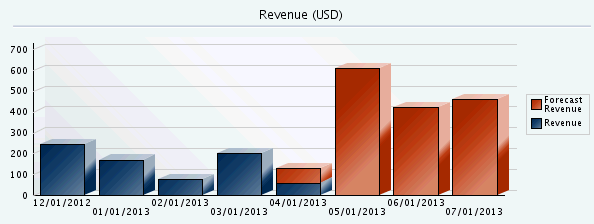
This bar chart displays a vertical bar for each period based on the number of periods that you specify. It compares the revenue for each period to show you a view of historical and forecast trends based on the start date that you specify.
The x-axis is the date with increments based upon the number of periods. The y-axis is the currency amount. The currency is built into the chart title when you activate multicurrency processing.
-
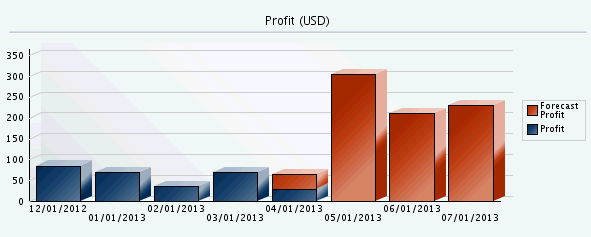
This bar chart displays a vertical bar for each period based on the number of periods that you specify. It compares the profit for each period to show you a view of historical and forecast trends based on the start date that you specify.
The x-axis is the date with increments based upon the number of periods. The y-axis is the currency amount. The currency is built into the chart title when you activate multicurrency processing.
The system displays the currency of the company that you indicate in the Company processing option. This processing option is on the Process tab of the Profitability Simulator program.
You can hover over any bar in the chart to display the actual value that is being depicted by the bar.
7.2.1.1 Item and Customer
When you run scenarios for the future, you must enter item, customer, and branch/plant information to retrieve future adjusted price information. To fetch historical price information, enter item information only and the system uses the actual information in the past. The item and customer criteria to enter for simulations include:
-
Item Number.
The item can be in short, long, or third item number format.
-
Item Group.
This is a UDC (40/PI) that identifies an inventory price group for an item. Item price groups have unique pricing structures that direct the system to incorporate discounts or markups on items on sales orders. The discounts or markups are based on the quantity, dollar amount, or weight of the item ordered. When you assign a price group to an item, the item takes on the same pricing structure defined for the inventory price group.
Note:
If you enter an item number and an item group on the Profitability Simulator form, the system simulates pricing based on the item group. -
Customer.
This is a user-defined name or number that identifies an address book record. If you enter a value other than the address book number, such as the long address or tax ID, you must precede it with the special character that is defined in the Address Book Constants. When the system locates the record, it returns the address book number to the field.
-
Customer Group.
This is a UDC (40/PC) that identifies a customer group. Customer groups are an optional way of organizing pricing schemes. You can set up customer price groups to enter and update price information for multiple customers simultaneously. For example, you can create a customer price group for preferred customers, named PREFER, who purchase a bike for 420.00 USD, while other customers buy the bike at 450.00 USD.
A simple price group is a group of customers that are assigned to the same group name in the Customer Billing Instructions. In JD Edwards EnterpriseOne base pricing, a customer can belong to only one customer price group.
To allow for greater pricing flexibility, you can use the JD Edwards EnterpriseOne Advanced Pricing system to set up complex customer price groups. Complex price groups are groups of customers that are assigned to a group name, but might be part of a different subgroup. You can define subgroups in a complex price group with values that you assign to category codes such as customer geographic location, line of business, or sales volume.
Note:
If you enter a customer number and a customer group on the Profitability Simulator form, the system simulates pricing based on the customer group. -
Branch/Plant.
Enter an alphanumeric code that identifies a separate entity within a business for which you want to track costs. For example, a business unit might be a warehouse location, job, project, work center, branch, or plant.
You must specify a branch/plant as part of your criteria. If you do not enter a branch/plant, you must enter cost and price information on the Price and Cost tab.
7.2.1.2 Price and Cost
You can enter item price and item cost information instead of pricing information in the system. The price and cost criteria to enter for simulations include:
-
Unit Cost.
Enter a value the system uses to project a static cost for all future periods. If you leave this field blank, the system does not retrieve the cost for future periods.
-
Cost Factor (%).
Enter a factor value that the system applies to the future cost for future periods. The system uses the factor value to adjust the cost value in the Unit Cost field above or the cost retrieved from the F4105 table. You can enter a positive or negative value. If you leave this field blank, the system does not apply a cost factor.
-
Unit Price.
Enter a value the system uses to project a static price for all future periods. If you do not select the Use Advanced Price option, the system applies the factor in the Price Factor field. If you select the Use Advanced Price option, the system uses this value as the base price and applies price adjustments to it.
-
Price Factor (%).
Enter a factor value that the system applies to the future price for future periods. The system uses the factor value to adjust the price value in the Unit Price field above or the price retrieved from the advanced price adjustment schedule, or the base price table (F4106). You can enter a positive or negative value. If you leave this field blank, the system does not apply a factor.
-
Forecast Factor (%).
Enter a factor value that the system applies to the future forecast for future periods. The system uses the factor value to adjust the forecast quantity retrieved from the forecast. You can enter a positive or negative value. If you leave this field blank, the system does not apply a factor.
|
Note: If you do not input item, customer, and branch/plant information, the system issues an error message instructing you to enter the required variables or to input cost and price information. |
7.2.2 Setting Processing Options for the Profitability Simulator Program (P42X20)
Use these processing options to specify company and forecast information that the system uses to process simulation information. These options also specify which charts the system shows or hides.
7.2.2.1 Process
- 1. Company (Required)
-
Enter a company code that the system uses to determine the currency to display on all amount fields. The system retrieves the currency from the Company Constants table (F0010). If you are using line of business, this value restricts results to only customers who belong to this company. You must select a specific company. The value 00000 is not valid.
- 2. Period Type (Required)
-
Specify the amount of time between periods. You must enter a value between 1 and 4. Values are:
1: Weekly
2: Monthly
3: Quarterly
4: Yearly
- 3. Default Number of Periods
-
Enter a numeric value that the system uses as the default value in the Periods field. You can change the value while you are using the application.
There is a limit to the number of periods you can use. The limit varies based on two factors: the chart types that the system displays and the amount of data that the chart displays. When the system exceeds the limit for one or both factors, the system displays an error message to indicate that the system has exceeded display limits.
If you leave this option blank the system displays zero as the number of periods when you access the Profitability Simulator program. When you enter data and click the Simulate button, the system displays an error indicating that the number of periods is invalid. Therefore, you should enter a value greater than zero.
- 4. Order Template
-
You use the order template to get a standard quantity for an item/customer that the system uses to find a future price using advanced pricing. If you do not specify a template or the system does not find the item/customer for the specified template, the system uses a quantity of one to get a future price.
Select a value from the Order Template (40/OT) UDC table that the system uses for simulations. In order for this option to function, you must:
-
Activate Advanced Pricing.
-
Enter a valid order template for this processing option.
-
Select the Use Advanced Price option when you work with the Profitability Simulator program.
If you select the Use Advanced Price option, the system validates the item, quantity, and customer found in the order template to calculate pricing for the profit simulation. The quantity is important because you can set up pricing based on quantity breaks.
The system does not display the Order Template form to allow edits. The system uses the order template default values only.
-
- 5. Simulation Mode
-
Specify whether the system opens the Profitability Simulator form in comparison or single mode. Values are:
Blank: Comparison mode; the system displays two scenarios to simulate in a side-by side view with the criteria in a tab view.
1: Single mode; the system displays one scenario to simulate and expands the size of the form to display all criteria without any tabs.
7.2.2.2 Forecast
- 1. Forecast Type
-
Specify the forecast type that the system uses to simulate future periods. When simulating future periods, the system searches for data corresponding to this forecast type.
Leave this option blank if you do not want the system to simulate future periods or generate profit and revenue charts for future periods.
Note:
When you activate this option, the remaining options on this tab are active. If you leave this option blank, the remaining options on this tab are inactive. - 2. Date Period
-
Specify the period type the system uses when simulating future periods. The system uses this value to determine which period type to use from the Fiscal Date Pattern that you entered in the Fiscal Date Pattern processing option. This value must be equal to the one used when the forecast type was generated. Values are:
1: Weekly
2: Monthly
Note:
This option is active when the Forecast Type option is activated. - 3. Fiscal Date Pattern
-
Enter a code from the Date Pattern (H00/DP) UDC table to determine the period start and end dates for querying the forecast table.
Note:
This option is active when the Forecast Type option is activated.
7.2.2.3 Chart Selection
Use these processing options to specify the sequence in which you want the system to display the charts. The system accepts numeric values and displays the charts based on sequence value. However, if you enter duplicate numeric values greater than zero for multiple charts, the system randomly displays only one of the charts. For example, if you enter 30 as the sequence value for the Profit Margin chart and Revenue chart, the system does not display both charts.
- 1. Cost vs. Price
-
Specify the sequence in which the system displays the Price vs. Cost chart in the simulation results.
Enter zero or leave blank to indicate that you do not want the system to display this chart in the simulation results.
- 2. Profit Margin
-
Specify the sequence in which the system displays the Profit Margin chart in the simulation results.
Enter zero or leave blank to indicate that you do not want the system to display this chart in the simulation results.
- 3. Revenue
-
Specify the sequence in which the system displays the Revenue chart in the simulation results.
Enter zero or leave blank to indicate that you do not want the system to display this chart in the simulation results.
- 4. Profit
-
Specify the sequence in which the system displays the Profit chart in the simulation results.
Enter zero or leave blank to indicate that you do not want the system to display this chart in the simulation results.
7.2.3 Working with Profit and Revenue Simulations
This section discusses how to:
-
Simulate profit and revenue scenarios.
-
Save profit and revenue simulations.
-
Load and execute saved simulations.
7.2.3.1 Simulating Profit and Revenue Scenarios
To simulate profit and revenue scenarios:
-
Access the Profitability Simulator form.
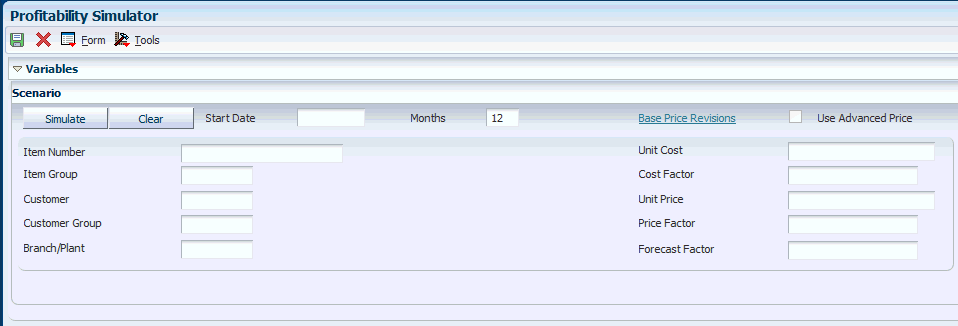
Form Name Form ID Navigation Profitability Simulator W42X20A Sales Advisor (G42X31) Select Profitability Simulator - Comparison Mode or select Profitability Simulator - Single Mode (P42X20).
If you specify in the processing options for the system to display the form in comparison mode, the system displays two scenarios to simulate in a side-by side view with the criteria in a tab view.
You can collapse the Variables group box to hide the scenarios variables and display more chart information on your computer screen.
-
On the Profitability Simulator form, complete these fields for each scenario:
- Start Date
-
Enter a date that the system uses to begin extracting simulation data. The date can be past or future.
- Months
-
Specify the number of months to chart.
Note:
The system displays Weeks, Months, Quarters, or Years based on the option you select for the Period Type processing option. This option is found on the Process tab of the Profitability Simulator program (P42X20). - Item Number
-
Enter the item number for which to run the simulation. This is a required field; you must enter an item number.
- Item Group
-
Enter a UDC value (40/PI) that identifies the item price group for which to run the simulation. The item group may be simple or complex. If you enter an item group, you must enter a representative item of that item group in the Item Number field. You must also enter a value in the Branch/Plant field.
In order for the system to calculate discounts and markups on the item, you must assign the item price group to the item.
- Customer
-
Enter the customer number for which to run the simulation. If you leave this field blank, the system runs the simulation for all customers. You can also leave this field blank and enter a customer group for which to run the simulation.
- Customer Group
-
Enter a UDC value (40/PC) that identifies the customer group for which to run the simulation. The group may be simple or complex. If you enter a complex group, you must enter a representative customer of that complex group in the customer field. You enter a representative customer so that the system recognizes the category codes associated with the complex group.
- Branch Plant
-
Enter the branch/plant for which to run the simulation. If you leave this field blank, the system runs the simulation for all branch/plants within the specified company.
- Unit Cost
-
Enter a value that the system uses to project a static cost for all future periods. If you leave this field blank, the system does not retrieve the cost for future periods.
- Cost Factor (%)
-
Enter a factor value that the system applies to the future cost for future periods. The system uses the factor value to adjust the cost value in the Unit Cost field or the cost retrieved from the Item Cost File table (F4105). The value that you enter can be positive or negative. If you leave this field blank, the system does not apply a cost factor.
- Unit Price
-
Enter a value that the system uses to project a static price for all future periods. If you do not select the Use Advanced Price option, the system applies the factor in the Price Factor field. If you select the Use Advanced Price option, the system uses this value as the base price and applies price adjustments to it.
- Price Factor (%)
-
Enter a factor value that the system applies to the future price for future periods. The system uses the factor value to adjust the price value in the Unit Price field, or the price retrieved from the advanced price adjustment schedule, or the Item Base Price File table (F4106). The value that you enter can be positive or negative. If you leave this field blank, the system does not apply a price factor.
- Forecast Factor (%)
-
Enter a factor value that the system applies to the future forecast for future periods. The system uses the factor value to adjust the forecast quantity retrieved from the forecast. The value that you enter can be positive or negative. If you leave this field blank, the system does not apply a factor and uses the forecast values in the Forecast File table (F3460).
-
Click the Simulate button.
When you click the Simulate button, the system generates the charts. The system displays only those charts that you selected for display by setting the processing options on the Chart Selection tab for the Profitability Simulator program.
While simulating profit and revenue scenarios, you can click the Base Price Revisions link to access the Base Price Revisions program (P4106). After you access the Base Price Revisions program, you can update the base price of the item in your simulation.
To view the chart data for the profitability simulator, you can click one of the data points (either a bar in a bar chart or the points in the line chart) and the system displays the data in grid format.
You can click the Clear button to refresh the form and clear all data entry. When you use the program in comparison mode, each scenario has its own clear button. Thus, it only clears the associated scenario and not the entire form.
7.2.3.2 Saving Simulations
You can click the Save button to save the simulation scenarios based on the criteria you have entered.
To save a simulation scenario:
-
Access the Save Simulation form.
Form Name Form ID Navigation Save Simulation W42X20D Sales Advisor (G42X31) Select Profitability Simulator - Comparison Mode or select Profitability Simulator - Single Mode (P42X20).
On the Profitability Simulator form, enter data for the scenarios.
Click the Save button.
-
On the Save Simulation form, complete these fields:
- Profitability Simulation Name
-
Enter a name for the simulation.
- Scenario Revision Level
-
Specify the numbered revision for the simulation.
-
Click the OK button.
When you save simulation scenarios (single mode or comparison mode), the system stores the information in three tables:
-
The Profitability Simulator Saved Scenarios table (F42X201) contains the filter field criteria that you saved for a given scenario.
-
The Profitability Simulator Saved Charts table (F42X201B) contains the graphic information that represents the filter criteria that you saved for a given scenario.
-
The Profitability Simulator Saved Data table (F42X201C) contains the data for saved simulation scenarios.
7.2.3.3 Loading and Executing Saved Simulations
After you save simulation scenarios, you can minimize repeating data entry by loading and executing the saved information.
To load and execute saved simulations:
-
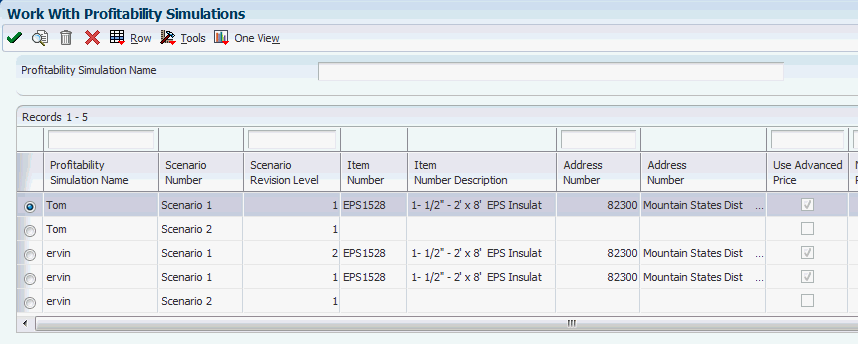
Access the Work With Profitability Simulations form.
Form Name Form ID Navigation Work With Profitability Simulations W42X20F Sales Advisor (G42X31). Select Profitability Simulator - Comparison Mode or select Profitability Simulator - Single Mode (P42X20).
On the Profitability Simulator form, select Select Scenario from the Form menu.
-
On the Work With Profitability Simulations form, select a record.
-
Select Load Scenario or select Execute Scenario from the Row menu.
When you select Load Scenario, the system displays the Profitability Simulator form with data for the saved scenario and does not allow you to edit the fields and save your changes when you exit the form.
When you select Execute Scenario, the system enables you to edit the criteria and create new charts. When you save the scenario, the system defaults to a new revision number to enable you to update the revision level so you do not inadvertently override the previously saved scenario.
