Application Viewer
The Application Viewer allows you to explore meta-data driven relationships and other deliverable files online.
Running Stand-Alone. You can also launch the Application Viewer as a stand-alone application (i.e., you do not need to start it from within the system). Refer to Application Viewer Stand-Alone Operation for more information about running the Application Viewer as a stand-alone application.
To open the application viewer from within your application, navigate to Admin Menu, Application Viewer. The application viewer may also be launched from other locations for example when viewing a section of the online help files that contain hypertext for a table name, clicking on that hypertext brings you to the definition of that table in the data dictionary.
Contents
Application Viewer Preferences
Application Viewer Stand-Alone Operation
The Tool Bar provides the main controls for using the Application Viewer. Each button is described below.
Contents
Group and Ungroup List Buttons
Data Dictionary Button
![]()
The Data Dictionary button switches to the Data Dictionary application.
Physical and Logical Buttons
![]()
![]()
The Physical button changes the display in the List Panel from a logical name view to a physical name view. Note that the Tables are subsequently sorted by the physical name and therefore may not be in the same order as the logical name view. Once clicked, this button toggles to the Logical button.
The Logical button changes the display in the List Panel from a physical name view to a logical name view. Note that the Tables are subsequently sorted by the logical name and therefore may not be in the same order as the physical name view. Once clicked, this button toggles to the Physical button.
These buttons are only available in the Data Dictionary.
Collapse Button
![]()
The Collapse button closes any expanded components on the list panel so that the child items are no longer displayed.
This button is only available in the Data Dictionary viewer.
Attributes and Schema Button
![]()
![]()
The Attributes button changes the display in the Detail Panel from a related tables view to an attribute view. Once clicked, this button toggles to the Schema button.
The Schema button changes the display in the Detail Panel from an attribute view to a related tables view. Once clicked, this button toggles to the Attributes button. Note that only tables have this view available. Columns are always displayed in an attribute view.
These buttons are only available in the Data Dictionary.
Maintenance Object Button
![]()
The Maint. Object button switches to the Maintenance Object viewer application.
Group and Ungroup List Buttons
![]()
![]()
The Group List button groups the list of maintenance objects by the function modules they are associated with. A maintenance object may appear in multiple groups if it is part of more than one module. Once clicked, this button toggles to the Ungroup List button.
The Ungroup List lists the maintenance objects in alphabetical order. Once clicked, this button toggles to the Group List button.
These buttons are only available in the Maintenance Object viewer.
Algorithm Button
![]()
The Algorithm button switches to the Algorithm viewer application.
Batch Control Button
![]()
The Batch Control button switches to the Batch Control viewer application.
To Do Type Button
![]()
The To Do Type button switches to the To Do Type viewer application.
Description and Code Buttons
![]()
![]()
The Description button changes the display in the List Panel to Description (Code) from Code (Description). Note that the list is subsequently sorted by the description. Once clicked, this button toggles to the Code button.
The Code button changes the display in the List Panel to Code (Description) from Description (Code). Note that the list is subsequently sorted by the Code. Once clicked, this button toggles to the Description button.
These buttons are only available in the Batch Control and To Do Type viewers.
Cobol Source Button
![]()
This functionality is not available in every product. This button only appears when you are using the Oracle Utilities Customer Care and Billing product.
The Cobol Source button switches to the Source Code viewer. This button is not available when you are already in the Source Code viewer.
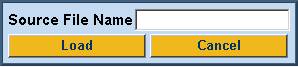
You are prompted to enter the name of the source file you want to view. The name of the source code file should be entered without the extension.

Load Source Button
![]()
The Load Source button loads another source file that you specify. This button is only available in the Source Code viewer.
You are prompted to enter the name of the source file you want to view. The name of the source code file should be entered without the extension.
Used By and Uses Buttons
![]()
![]()
The Used By switches the tree in the list panel to a child-parent view. The source file is used by the files listed in the tree. Once clicked, this button toggles to the Uses button.
The Uses button switches the tree in the list panel to a parent-child view. The source file uses the files listed in the tree. Once clicked, this button toggles to the Used By button.
These buttons are only available in the Source Code viewer.
Service XML Button

The Service XML button switches to the Service XML viewer. This button is not available when you are already in the Service XML viewer.
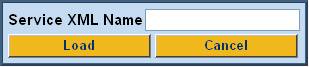
You are prompted to enter the name of the service XML file you want to view. The name of the service XML file should be entered without the extension.

Load Service XML Button
![]()
The Load Service XML button loads another service XML file that you specify. This button is only available in the Service XML viewer.
You are prompted to enter the name of the service XML file you want to view. The name of the service XML file should be entered without the extension.
Java Docs Button

The Java Docs button switches to the Java Docs viewer.
Classic Button
![]()
This button is only available in the Java Docs viewer.
The Classic button launches the classic Javadocs viewer on a separate window. If you are more comfortable with that look you can use this viewer instead.
Preferences Button
![]()
The Preferences button allows you to set optional switches used by the Application Viewer. Refer to Application Viewer Preferences for more information.
Help Button
![]()
The Help button opens the Application Viewer help system. You used this button to access this information.
About Button
The About button opens a window that shows when was each Application Viewer data component recently built.
Data for all application viewer components may be regenerated to incorporate up-to-date implementation-specific information. Refer to Application Viewer Generation for further details.
Slider Icon
![]()
This "slider" icon allows you to resize the list panel and detail panel to your preferred proportions.
The data dictionary is an interactive tool that allows you to browse the database schema and to graphically view relationships between tables in the system.
To open the data dictionary, click the Data Dictionary button. You can also open the data dictionary by clicking the name of a table in other parts of the application viewer or in the online help documentation.
Data Is Generated. A background process generated the data dictionary information. Refer to Application Viewer Generation for further details.
Contents
Using the Data Dictionary List Panel
Using the Data Dictionary Detail Panel
Using the Data Dictionary List Panel
The list panel displays a list of tables and their columns. The list panel can list the table names by either their logical names or their physical names. Click the appropriate button on the tool bar to switch between the two views. The list is displayed in alphabetical order, so the order may not be the same in both views. Both views function in a similar manner.
In the list panel, you can navigate using the following options:
· Click the right arrow icon to expand a table to show its columns.
· Click the down arrow icon to collapse the column list for a table. Optionally, collapse all column lists by using the Collapse button.
· Click the column name to display information about the column in the detail panel.
· If the detail panel is in related table view, click the table name to view its related tables. If the detail panel is in table detail view, click the table name to display its information.
Contents
Primary And Foreign Keys
The columns in the list panel may display key information as well as the column name:
· A yellow key indicates that the column is a primary key for the table.
· A light blue key indicates that the column is a foreign key to another table. If you hover the cursor over the icon, the tool tip indicates the foreign table.
· A dark blue key indicates that the column is a conditional foreign key. A conditional foreign key represents rare relationships between tables where a single field (or set of fields) may reference multiple primary key constraints of other tables within the application as a foreign key.
· A red key indicates that the column is a logical key field. A logical key represents an alternate unique identifier of a record based on a different set of fields than the primary key.
If you hover your cursor over an icon, the tool tip indicates the key type.
Field Descriptions Shown
The language-specific, logical name of each field is shown adjacent to the physical column name in the data dictionary. You can enter an override label for a table / field's to be used throughout the system as the field's logical name. Here too it is the override label that is shown.
Regenerate. You should regenerate the data dictionary after overriding labels. Refer to Application Viewer Generation for further details.
Using the Data Dictionary Detail Panel
The Data Dictionary detail panel displays the details of the selected item. There are three main displays for the Detail Panel:
· Related tables view
· Table detail view
· Column detail view
Contents
Related Tables View
The Related Tables view displays information about the table's parent tables and child tables. Click the Schema button in the tool bar to switch to related tables view.
In the related tables view, you can navigate using the following options:
· Click the left arrow and right arrow icons to view the related tables for that linked table. The List Panel is automatically positioned to the selected table.
·
Click the maintenance object icon (![]() ) to
view the table’s maintenance object.
) to
view the table’s maintenance object.
· If you want to position the List Panel to view the columns for different table click the name of the table for which you want to view the columns.
Table Detail View
The table detail view displays information about the selected table. Click Attributes (in the toolbar) to switch to the table detail view.
In the table detail view, you can navigate using the following options:
· If user documentation is available for the table, click the View User Documentation link to read the user documentation that describes the table’s maintenance object.
· If the table has an associated Language Table, click the link to view the Language Table details.
· If there is an associated Maintenance Program, click the link to view the source code for the maintenance program (you are transferred to the Source Code Viewer).
· If there is an associated Key Table, click the link to view the Key Table details.
Column Detail View
Click on a column name in the list panel to switch to the column detail view. The Column Detail view displays information about the selected column.
In the column detail view, you can navigate using the following options:
· If user documentation is available for the column, click the View User Documentation link to read about the column’s related maintenance object.
· If the column is a foreign key, click the table name to switch to the Table Detail view for that table.
· If the column has a Field Validation Copybook available (normally only present for flag and switch fields), click the link to view the source code for the copybook (you are transferred to the Source Code Viewer).
Lookup Values
If the selected column is a lookup field its valid values are also listed. Notice that you can enter an override description for lookup values. In this case the override description is shown.
Regenerate. You should regenerate the data dictionary after overriding lookup value descriptions. Refer to Application Viewer Generation for further details.
The maintenance object viewer is an interactive tool that allows you to view a schematic diagram of a maintenance object. A maintenance object is a group of tables that are maintained as a unit.
To open the Maintenance Object Viewer, click the Maint. Object button in the application viewer or click a maintenance object icon in the Data Dictionary.
Data Is Generated. A background process generated the maintenance object information. Refer to Application Viewer Generation for further details.
Contents
Using the Maintenance Object List Panel
Using the Maintenance Object Detail Panel
Using the Maintenance Object List Panel
The list panel displays a list of maintenance objects. The list panel can also group the maintenance objects by their function module. Click the appropriate button on the tool bar to switch between the grouped and ungrouped lists. The grouped list may include a maintenance object more than once (if it is included in more than one module).
In the list panel, you can navigate using the following options:
·
If the list panel is grouped, click the ![]() icon to expand a module and view its
maintenance objects.
icon to expand a module and view its
maintenance objects.
·
If the list panel is ungrouped, click the ![]() icon to collapse the list of maintenance
objects for a module.
icon to collapse the list of maintenance
objects for a module.
· Click the maintenance object name to display information about the maintenance object in the detail panel.
Using the Maintenance Object Detail Panel
The Maintenance Object detail panel displays a schematic of the selected maintenance object.
In the detail panel, you can navigate using the following options:
· Click a table name to transfer to the Data Dictionary table detail view for a table. (Click the Maint. Object button in the tool bar to return to the maintenance object.)
·
Click the source code icon (![]() ) to
view the Service Program used to maintain the displayed object. (Click the Main. Object button in the tool bar
to return to the maintenance object.)
) to
view the Service Program used to maintain the displayed object. (Click the Main. Object button in the tool bar
to return to the maintenance object.)
·
Click the service XML icon (![]() ) to
view the XML file of the Service Program used to maintain the displayed object.
(Click the Main. Object button
in the tool bar to return to the maintenance object.)
) to
view the XML file of the Service Program used to maintain the displayed object.
(Click the Main. Object button
in the tool bar to return to the maintenance object.)
The algorithm viewer is an interactive tool that allows you to view algorithm types (grouped by their plug-in spot) and their related algorithms.
To open the Algorithm Viewer, click the Algorithm button in the application viewer. The Algorithm viewer may also be opened from certain locations in the online help documentation.
Data Is Generated. A background process generates algorithm information. Refer to Application Viewer Generation for further details.
Contents
Using the Algorithm Viewer List Panel
Using the Algorithm Plug-In Spot Detail Panel
Using the Algorithm Type Detail Panel
Using the Algorithm Detail Panel
Using the Algorithm Viewer List Panel
The list panel displays a list of algorithm types and their related algorithms, grouped by their plug-in spot.
In the list panel, you can navigate using the following options:
· Click the algorithm plug-in spot description to display information about the plug-in spot in the detail panel.
·
Click the ![]() icon to expand a plug-in spot and view its
algorithm types and their related algorithms.
icon to expand a plug-in spot and view its
algorithm types and their related algorithms.
·
Click the ![]() icon to collapse the list of algorithm types
for a plug-in spot.
icon to collapse the list of algorithm types
for a plug-in spot.
· Click the algorithm type name to display information about the algorithm type in the detail panel.
· Click the algorithm name to display information about the algorithm in the detail panel.
Using the Algorithm Plug-In Spot Detail Panel
The Algorithm plug-in spot detail panel displays further information about the selected plug-in spot.
Using the Algorithm Type Detail Panel
The Algorithm Type detail panel displays further information about the selected algorithm type.
In the Algorithm Type detail panel, you can navigate using the following options:
· Click on the program name to view its source in the source viewer or Java docs viewer.
Using the Algorithm Detail Panel
The Algorithm detail panel displays further information about the selected algorithm.
The batch control viewer is an interactive tool that allows you to view batch controls.
To open the Batch Control Viewer, click the Batch Control button in the application viewer. The Batch Control viewer may also be opened from certain locations in the online help documentation.
Data Is Generated. A background process generates batch control information. Refer to Application Viewer Generation for further details.
Contents
Using the Batch Control Viewer List Panel
Using the Batch Control Detail Panel
Using the Batch Control Viewer List Panel
The list panel displays a list of batch controls. The list panel can display the list of batch controls sorted by their code or sorted by their description. Click the appropriate button on the tool bar to switch between sorting by the code and description.
In the list panel, you can click the batch control to display information about the batch control in the detail panel.
Not All Batch Controls Included. Note that the insertion and key generation programs for conversion (CIPV*) are not included.
Using the Batch Control Detail Panel
The batch control detail panel displays further information about the selected batch control.
In the batch control detail panel, you can navigate using the following options:
· Click on the program name to view its source in the source viewer or the Java docs viewer.
· If a To Do type references this batch control as its creation or routing process, click on the To Do type to view its detail in the To Do type viewer.
The to do type viewer is an interactive tool that allows you to view to do types defined in the system.
To open the To Do Type Viewer, click the To Do Type button in the application viewer. The To Do Type viewer may also be opened from certain locations in the online help documentation.
Data Is Generated. A background process generates To Do type information. Refer to Application Viewer Generation for further details.
Contents
Using the To Do Type Viewer List Panel
Using the To Do Type Detail Panel
Using the To Do Type Viewer List Panel
The list panel displays a list of To Do types. The list panel can display the list of To Do types sorted by their code or sorted by their description. Click the appropriate button on the tool bar to switch between sorting by the code and description.
In the list panel, you can click the To Do type to display information about the To Do type in the detail panel.
Using the To Do Type Detail Panel
The To Do type detail panel displays further information about the selected To Do type.
In the To Do type detail panel, you can navigate using the following options:
· If the To Do type references a creation process or a routing process, click on the batch process to view its detail in the batch control viewer.
· Click on the table listed in the drill key section to view its detail in the data dictionary.
· Click on the field(s) listed in the drill key section to view its detail in the data dictionary.
The source code viewer is an interactive tool that allows you to browse the source code of modules that execute on the application server. It currently supports Cobol modules only.
This functionality is not available in every product. The source code viewer currently supports COBOL modules only and is available only as part of Oracle Utilities Customer Care and Billing.
Proprietary modules. The source code of a small number of modules has been suppressed due to their proprietary nature.
There are many ways to access the source code viewer:
· The data dictionary allows you to view the source code of the program responsible for validating and updating information on a given table. This feature is implemented by viewing the table’s attributes and then drilling down on the maintenance program’s name.
· The maintenance object viewer allows you to view the source code of the maintenance object’s service program. This feature is implemented by viewing the maintenance object and then clicking on the source code icon.
· If you know the name of a program, you can navigate to the source code viewer and enter the program name. To open the source code viewer from within the application viewer, click the COBOL Source button. When you are prompted to enter the program name, enter the name without the extension.
Contents
Using the Source Code Viewer List Panel
Using the Source Code Viewer Detail Panel
Using the Source Code Viewer List Panel
The list panel displays a tree of Program Sections, Copybooks, SQL Includes, Programs, and SQL statements that are used by the selected source file. You can change the listed items types using Application Viewer Preferences.
The list panel can list the source code’s children (source code that the file uses) or the parents (source code that uses the file). Click the appropriate button on the tool bar to switch between the two views.
In the list panel, you can navigate using the following options:
· Click the "+" icon to expand an included source file to view its includes.
· Click the "-" icon to collapse the includes for a source file.
· Click the open folder icon to view the source of a file in the detail panel. The list panel changes to display the source code tree for the file displayed in the detail panel.
· Click an item’s name or description to position the detail panel to view that item.
Using the Source Code Viewer Detail Panel
The detail panel displays the source code of the selected file.
You can navigate using the following options:
· If another file is referenced in the code, click the link to view the code for the referenced file. The list panel changes to display the source code tree for the file displayed in the detail panel.
· If a perform statement is referenced in the code, click the link to go to the referenced section.
· When an SQL statement references a table name, click the link to view the table in the Data Dictionary’s related tables view.
·
The ![]() (back button) becomes active once subsequent
files of source code are viewed. The
name of the source that is displays when the button is clicked appears to the
right of the button.
(back button) becomes active once subsequent
files of source code are viewed. The
name of the source that is displays when the button is clicked appears to the
right of the button.
·
The ![]() forward button) becomes active once the back
button (described above) is used. The name of the source that is displays when
the button is clicked appears to the left of the button.
forward button) becomes active once the back
button (described above) is used. The name of the source that is displays when
the button is clicked appears to the left of the button.
The service XML viewer is an interactive tool that allows you to browse the XML files of service programs that execute on the application server.
You can access the service XML viewer as follows:
· The maintenance object viewer allows you to view the XML file of the maintenance object’s service program. This feature is implemented by viewing the maintenance object and then clicking on the Service XML icon.
· When setting up a Function, you may want to view the XML document used to pass data to and from the service. Clicking the View XML hyperlink causes the XML document to be displayed in the Service XML Viewer.
Contents
Using the Service XML Viewer Overview Panel
Using the Service XML Viewer Detail Panel
Using the Service XML Viewer Overview Panel
The overview panel displays a high level nodes and list names structure of the XML document.
In the overview panel, you can click on any node item to position the detail panel to view that item.
Using the Service XML Viewer Detail Panel
The detail panel displays nodes and attributes of the selected XML file.
You can click on the xpath button to view the XML path that should be used to reference the selected node in the XML document. The box at the top of the overview panel changes to display this information.
The Java Docs viewer is an interactive tool that allows you to browse Java documentation files (Javadocs) for Java classes that execute on the application server.
Proprietary Java Classes. A small number of Java classes have been suppressed due to their proprietary nature.
Classic view. If you are more comfortable using the classic Javadocs viewer you may use the Classic button.
To open the Java Docs viewer from within the application viewer, click the Java Docs button. Additionally, the algorithm viewer allows you to view the Javadocs of an algorithm program written in Java.
Contents
Using the Java Docs Viewer List Panel
Using the Java Package Detail Panel
Using the Java Interface / Class Detail Panel
Using the Java Docs Viewer List Panel
The list panel displays a tree of Java packages where each package may be expanded to list the Java interfaces classes it includes.
In the list panel, you can navigate using the following options:
· Click the right arrow icon to expand a Java package to view the Java interfaces and classes it includes.
· Click the down arrow icon to collapse the list for a Java package. Optionally, collapse all lists by using the Collapse button.
· Click the Java interface or class name to display information about it in the detail panel.
The list details panel designates the interfaces and the classes as follows:
· A green dot indicates Java interfaces.
· A blue key indicates Java classes.
If you hover the cursor over the icon, the tool tip indicates whether it's an interface or a class.
Using the Java Package Detail Panel
The package detail panel displays a summary of the various Java classes that are included in the selected Java package.
Click the Java class name to display information about the Java class in the detail panel.
Using the Java Interface / Class Detail Panel
The detail panel displays Java documentation information about the selected Java interface or class.
You can navigate using hyperlinks to other locations in the current detail panel or to view the details of other Java interfaces / classes.
This panel displays Optional Switches that can be used to affect the behavior of the Application Viewer.
When you are using a product that includes the source code viewer, the preferences panel includes Source Tree Icon Display options. These options are used to suppress the display of certain icons from the Source Tree. This is used to (for example) hide the copybooks from the display. Select the items that you want view in the source tree and click OK.
The Available Languages allows you to select the language in which the labels and buttons are displayed. Select your desired language and click OK.
You can run the Application Viewer as a stand-alone application (i.e., you do not need to launch it from the online application environment). To run it as a stand-alone application, you should copy the Application Viewer files (all files in the appViewer directory) and the online help files (all files in the help directory) to the server on which you want to run the Application Viewer.
Online Help. If you do not copy the online help files, online help will not be available for the Application Viewer, nor will you be able to view business descriptions of the tables’ maintenance objects.
To start the application viewer in stand-alone mode, launch the appViewer.html file (located in the appViewer directory).
Contents
Stand-Alone Configuration Options
Example Application Viewer Configuration
Stand-Alone Configuration Options
You can configure the Application Viewer for stand-alone operation by modifying options in a configuration file. The Application Viewer comes with a default configuration file called config_default.xml (located in the appViewer\config directory). Create a copy of the default configuration file and rename it to config.xml. Modify the options described in the following table to suit the needs of your installation.
Default Configuration. If you do not create the config.xml file, the Application Viewer launches with its default (internal) configuration.
|
Option |
Description |
|
defaultLanguage |
The default language used when the application viewer is started. Available values are those marked as language enabled on the language page. |
|
defaultView |
The default view then the application viewer is started. Available values include: - Data Dictionary - Source Viewer |
|
dataDictionary |
Whether the Data Dictionary is available or not: - Y - N |
|
sourceCode |
Whether the Source Code Viewer is available or not: - Y - N |
|
baseHelpLocation |
The location of the stand-alone online help in relation to the application viewer. Specify the directory structure relative to the location of the directory in which the Application Viewer files are located. Note that this is the directory in which the language subdirectories for the online help are located. The default location is: ../help |
|
appViewerHelp |
The default help topic that is launched when the Help button is clicked in the Application Viewer. Specify a help file and anchor that is under the appropriate language directory under the baseHelpLocation. The default is: Framework/Admin/91AppViewer.html#SPLINKApplication_Viewer |
Example Application Viewer Configuration
The following excerpt shows an example Application Viewer configuration.
<?xml version="1.0" encoding="UTF-8" ?>
<configuration>
<option id="defaultLanguage">PTB</option>
<option id="defaultView">Data Dictionary</option>
<option id="dataDictionary">Y</option>
<option id="sourceCode">Y</option>
<option id="baseHelpLocation">../help</option>
<option id="appViewerHelp">Framework/Admin/91AppViewer.html#SPLINKApplication_Viewer</option>
</configuration>
The Application Viewer is initially delivered with Cobol source and service XML information only.
Note. Cobol source information is only available as part of Oracle Utilities Customer Care and Billing.
The other components of the application viewer are generated on site.
· Use the background process F1-AVALG to regenerate algorithm information
· Use the background process F1-AVBT to regenerate batch control information.
· Use the background process F1-AVMO to regenerate maintenance object information
· Use the background process F1-AVTBL to regenerate data dictionary information.
· Use the background process F1-AVTD to regenerate To Do type information.
These processes have been introduced so that you can more easily incorporate your implementation-specific information into the application viewer.
To keep the information shown in the application viewer current it is important to execute these background processes after you introduce changes to the corresponding system data.
Data Generation Is Not Incremental. Each new execution of these processes first deletes existing data (if any) in the corresponding folder before it generates new data.
Other Extensions. Cobol source and service XML may also be extended to include implementation-specific information. The base package is provided with special scripts that handle this type of extension. Refer to the Software Development Kit User Guide for further information on application viewer extensions.
War File. If your application is installed in war file format, each generation of application viewer data rebuilds the corresponding war file. The web application server then needs to be "bounced" in order to make the newly generated data available to the application viewer. Please consult your system administrator for assistance.
Certain Web Application Servers Are Special. WebSphere and Oracle Application web application servers require an additional step in order to make the newly generated data available to the application viewer. These web application servers require a rebuild of the application ear file and its redeployment in the web application server. This step is described in the installation document. Please consult your system administrator for further details.