15 Enterprise Manager Ops Center and Grid Control
The Oracle Enterprise Manager Ops Center and Enterprise Manager Grid Control applications monitor assets, or targets, in different sections of the data center stack:
-
Oracle Enterprise Manager Grid Control manages applications, middleware, databases, and operating systems
-
Oracle Enterprise Manager Ops Center manages operating systems, virtual machines, servers, and storage devices
Use plug-in sofware that configures Oracle Enterprise Manager Ops Center and Grid Control to work together to monitor the entire asset stack in your data center. When you configure the applications to work together, each application shares information with the other application:
-
Each user interface includes information from the other application. Resources managed by Oracle Enterprise Manager Ops Center are visible on the Oracle Enterprise Manager Grid Control user interface and resources managed by Oracle Enterprise Manager Grid Control are visible on the Oracle Enterprise Manager Ops Center user interface.
-
Alerts generated in one application are reported in the other application.
See the Oracle Enterprise Manager documentation library for more information about Oracle Enterprise Manager Grid Control.
Note:
If you installed and configured the connector for Ops Center 2.5 and Oracle Enterprise Manager, uninstall the connector before upgrading to Oracle Enterprise Manager Ops Center. Beginning with Oracle Enterprise Manager Ops Center 11g Release 1, the connector is not needed for integration.Oracle Enterprise Manager Ops Center and Grid Control monitor assets, or targets, in different sections of the data center IT stack. Enterprise Manager Grid Control manages the applications, middleware, databases, and operating systems at the top of the stack and Enterprise Manager Ops Center manages operating systems, virtual machines, servers, and storage devices at the bottom of the stack.
Figure 15-1 Scope of Product Operations in IT Stack
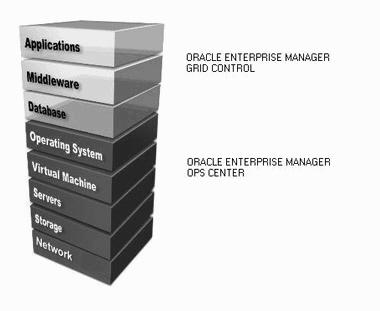
Description of "Figure 15-1 Scope of Product Operations in IT Stack"
You can link the monitoring functionality of both products. You can install Enterprise Manager Ops Center and Grid Control in your data center and then configure the applications to communicate with each other.Even though both products monitor operating system status, they do not share overlapping information. The OS status and alerts from one application do not display in the other application's user interface. Because there is no overlap, the OS monitoring parameters specific to Oracle Solaris Zones and Oracle VM Server for SPARC appear in Enterprise Manager Grid Control.
See the Oracle Enterprise Manager System Monitoring Plug-In for Oracle Enterprise Manager Ops Center Guide for the steps to install the plug-in software.
Configuring the Applications
Install Enterprise Manager Ops Center and Grid Control in your data center and then configure the applications to communicate with each other. You must have the following access:
-
Enterprise Manager Grid Control user
or
-
DB user on the Oracle Enterprise Manager Grid Control repository with select permissions for the management repository and Enterprise Configuration Management view
To display basic application, middleware, and database monitoring information for a target in Enterprise Manager Ops Center, configure the Enterprise Controller to communicate with the Enterprise Manager Grid Control repository. The monitoring information appears in the Targets tab in the Asset view. Click a target to view basic information. To view more details, double-click the problem and launch the target home page in Enterprise Manager Grid Control.
To display information collected by Enterprise Manager Ops Center in the Enterprise Manager Grid Control console, you must install and configure a plug-in application. The plug-in creates a new Infrastructure Stack target type in the console. Select Infrastructure Stack targets to display information collected by Enterprise Manager Ops Center. To get more details about the problem, you can drill down into the Enterprise Manager Ops Center UI.
The following reports are available with the Infrastructure Stack plug-in:
-
Topology report – Provides stack layers report
-
Hardware sensors report – Provides hardware sensors details based on the service processor, including current value and status, and thresholds
-
Configuration report – Provides basic configuration of each layer within the stack
To view reports, go to the target's home page, then click the Reports tab.
See the Enterprise Manager Ops Center Administration Guide for information about configuring the Enterprise Controller to communicate with the Enterprise Manager Grid Control repository.
Viewing Enterprise Manager Grid Control Alerts in Enterprise Manager Ops Center
When configured, you can view the status of targets that are being monitored by Oracle Enterprise Manager Grid Control in the Oracle Enterprise Manager Ops Center UI. You can drill down for greater detail by double-clicking on a Grid Control generated problem to launch the Oracle Enterprise Manager Grid Control console. You can also launch the console from Administration in the Navigation pane.
Both applications monitor the OS, but only Oracle Enterprise Manager Ops Center monitoring is displayed in the UI.
Viewing Oracle Enterprise Manager Grid Control Alerts
-
Expand Assets in the the Navigation pane.
-
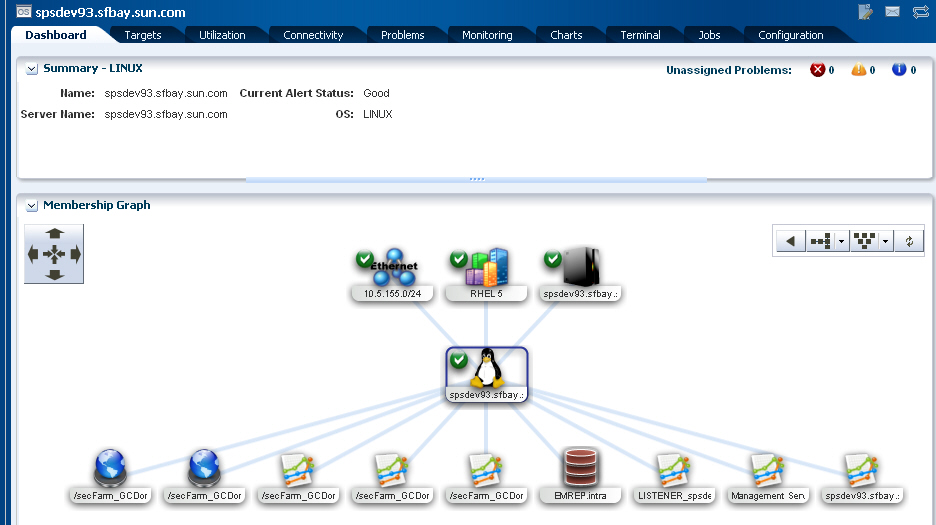
Click an OS that has the Oracle Enterprise Manager Grid Control Agent installed. The Dashboard page is displayed. The OS and the members above the OS are monitored by Ops Center. Applications below the OS are monitored by Oracle Enterprise Manager Grid Control, as shown in the following graphic. If you have a Solaris OS installed with Oracle Containers or Oracle VM Server for SPARC, the zones or guests are monitored by Ops Center and will appear below the OS.
-
Click the Targets Tab to view Grid Control target information, including status alerts, and availability.
-
To view details about a specific target, either double-click the target or highlight the target, then click the Go To Grid Control icon.
Figure 15-4 is an example of a Database Instance target.
Figure 15-4 Details of a Grid Control Target
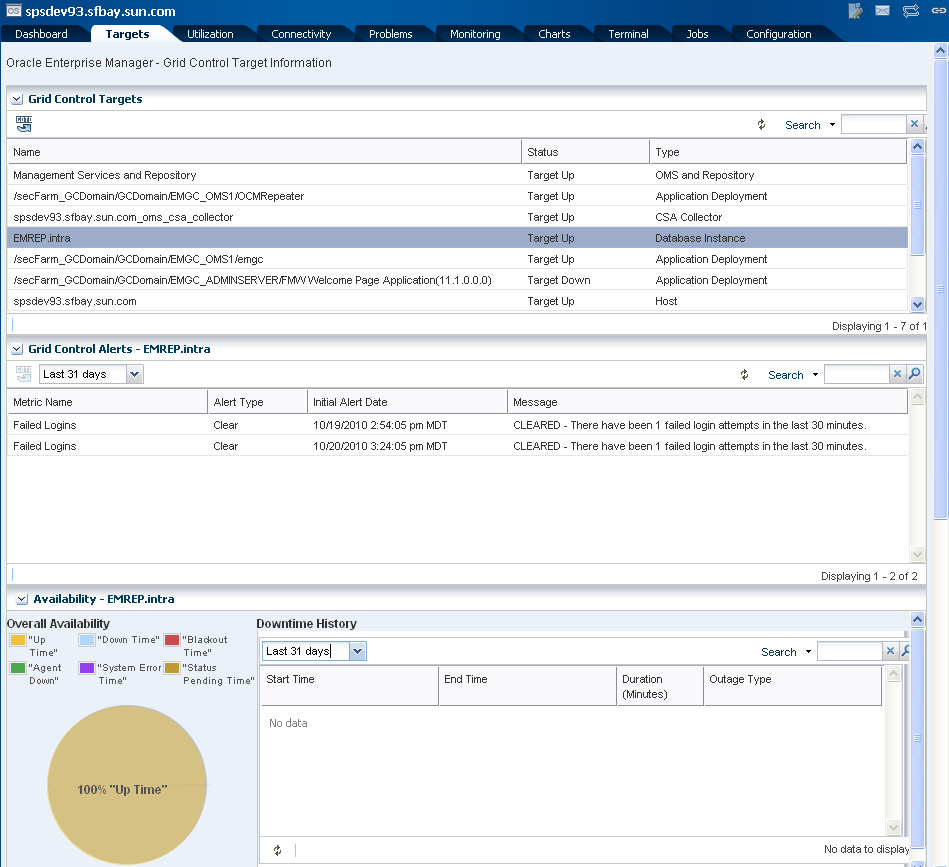
Description of "Figure 15-4 Details of a Grid Control Target"
-
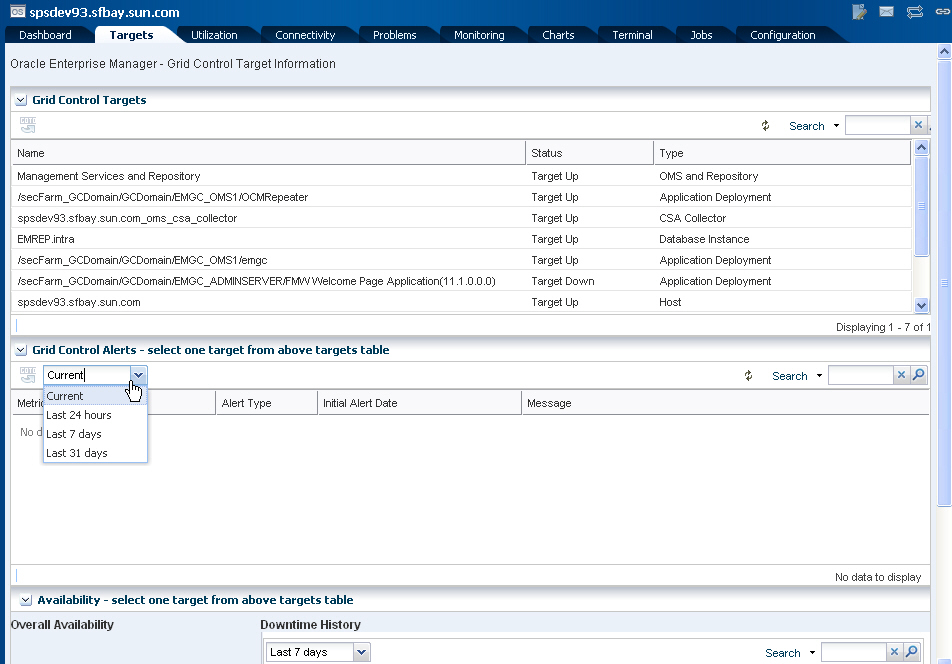
For Alert history, you can choose from the following time frames in the drop- down list:
-
Current
-
Past 24 hours
-
Past 7 day history
-
Past 31 day history
-
For more information about Oracle Enterprise Manager Grid Control, see Additional Resources.
Viewing Enterprise Manager Ops Center Details in Enterprise Manager Grid Control
Before you can view details collected from the Enterprise Manager Ops Center in the Grid Control console, you must deploy and configure an infrastructure stack plug-in on your Oracle Enterprise Manager Grid Control Agents. Deploying the plug-in creates a new Infrastructure Stack target type in the Oracle Enterprise Manager Grid Control console. To begin sharing monitoring information, you must define the targets.
Once configured, you can search for Infrastructure Stack target types to display information collected by the Oracle Enterprise Manager monitoring functionality and you can perform the following actions:
-
View hardware alerts
-
Run sensor reports
-
Run OS update and baseline comparisons
See the Oracle Enterprise Manager documentation for information about displaying monitoring information by target type.