9 Monitoring Rules and Profiles
Monitoring rules and profiles are used to define the monitoring parameters. This section discusses the types of monitoring rules and how the software uses the monitoring rules and profiles that you define to generate alerts and problems in the UI.
About Monitoring Rules and Profiles
Monitoring rules, profiles, and plans detect components or attributes of a managed asset or resource that are not operating within specified parameters. A resource is a generic term for any resource managed through Enterprise Manager Ops Center, it can be an asset (hardware or OS), a group, a network, or a library. An Enterprise Manager Ops Center administrator has permissions to edit and add monitoring rules and profiles.
-
Monitoring Rules – Express alerting conditions. You can apply one or more rules to an asset in order to monitor the asset and raise an alert when the monitoring rule condition is met.
-
Monitoring Profiles – A set of monitoring rules targeted to a specific asset type. Default monitoring profiles contain a set of rules that are automatically applied. You can copy a profile and manually configure the rules in the profile.
The following are the main components of a complete monitoring configuration:
Other features, such as annotations and operational profiles, will greatly enhance monitoring and problem management capabilities. Annotations enable you to add comments, suggested actions, or automated scripts for a specific problem, or you can add associate an annotation with a specific problem and asset type and add it to the Problems Knowledge Base. Operational profiles and plans are another method of adding consistency to problem management. You can create an operational profile that contains a script that can be run against a known problem. Annotations and operational profiles are discussed in more detail in their respective sections.
Monitoring Rules
Monitoring rules define the alerting conditions. Rules are associated with, and determined by, the type of managed resource. You can apply a generic alert rule to many different attributes, but other monitoring rules are attribute specific, hard-coded into drivers and cannot be moved or reconfigured.
Two main types of rules exist:
-
System-defined rules – These are attribute specific and are hard-coded into drivers. You can disable a system-defined rule, but you cannot edit, move, or reconfigure these types of rules.
-
User-defined rules – These are associated with, and determined by, the type of managed resource. You can apply a user-defined rule to many different attributes.
The following types of editable user-defined rule parameters are available:
-
Threshold – a numeric value above or below a defined level
-
Boolean Control – a true-false check
-
Enumerated Control – a series of values
-
Expression – an instruction to execute something that will return a value
Not all rule parameters can be modified, but most rules include some parameters that an administrator can tune, or edit to meet your organization's requirements. The following are some examples of editable parameters:
-
Severity
-
Raising and clearing values
-
Time constraints after an alert is raised, after what time period is a rule disabled (timer-driven alert condition check)
-
Data collection script to trigger upon alert
-
Other monitoring parameters that are specific to the rule type, such as threshold settings trigger level, clear level, time-across-threshold-before-alert
Generally, you can add, edit, enable, disable, and remove resource monitoring rules. For each managed resource, there is a Monitoring tab. You can tune the rules for a specific managed resource from this tab.
Each rule is associated with a severity level of Info, Warning, or Critical. Default values and severity levels are provided at installation, but are editable. For user-defined rules, you can define the time between when the alerting condition is identified and when an alert or problem is generated.
You can configure the software to send an e-mail or pager message when a Warning or Critical problem is identified.
Monitoring Profiles
A monitoring profile contains information to monitor a managed asset with user-defined alert configurations, including defining thresholds and setting up alert monitors.
Monitoring profiles are automatically applied when an asset becomes a managed asset, when an agent is deployed. Some assets, such as networks, are managed and monitored at inception. You can apply any monitoring profile to an arbitrary managed asset or group of assets to change the monitoring configuration on the subset of those resources of a compatible type.
The following pre-defined monitoring profiles are included in the software:
-
System-defined - For Sun Oracle hardware and operating systems
-
User-defined - Customized profiles for your managed assets
-
Generic - Default set of profiles for systems that do not have a specific profile
Some monitoring profiles install probes or agents on managed resources, while other profiles are designed to invoke arbitrary actions or scripts against the managed resource.
Enabled and Active Rules
Monitoring rules have two types of states:
-
Enabled or Disabled – Determined by the user configuration. Disabling a rule removes that attribute from monitoring. You can disable and enable rules on a per asset or group basis.
-
Active or Inactive – Reflects the system's state and indicates whether or not monitoring is actually being performed. When a rule is not enabled, monitoring is not active.
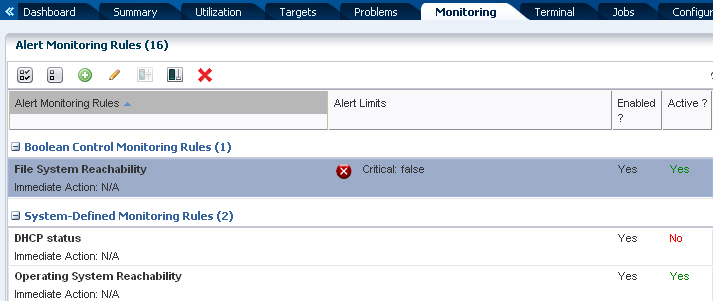
The status is displayed on the Alert Monitoring Rules page, which is accessed from the Monitoring tab. Text in the Enabled? and Active? fields indicates if the rule is enabled and active. A rule is disabled or inactive if "No" appears in the corresponding field. The following graphic shows the DHCP status as enabled, but not active.
Figure 9-1 IActive and Inactive Monitoring Rules
Description of "Figure 9-1 IActive and Inactive Monitoring Rules"
When a rule is enabled, the active state reflects the system's actual state and indicates if monitoring is being performed. The following are some of the reasons that an enabled rule might display as not active:
-
The specific attribute is not hard-coded into the driver and monitoring is not possible for that attribute.
-
The resource not reachable or the attribute cannot be refreshed at this time.
-
Some type of misconfiguration, such as a missing mandatory parameter or an illegal value for a parameter.
-
An internal error specific to the monitor, particularly in the case of driver-specific monitors.
Annotations
For more robust problem management, you can associate an annotation with a rule and store the annotation in the Problems Knowledge Base. Annotations in the Problems Knowledge Base enable you to provide an automated solution or a suggested action when a specific problem is detected. To provide an automated solution, create an operational plan that contains a shell script. When a specific problem occurs, the script is executed automatically. To provide a suggested fix or course of action for a specific problem, you can create a text only annotation that provides a suggested course of action, or you can include a shell script.
When a rule is triggered, and an alert or problem is identified, the software checks the Problems Knowledge Base and Problem Profiles for the Problem Type and any associated Annotations. It generates a problem of the defined type and severity level and attaches any annotations. If an automated operation annotation is associated with the problem, the script is executed. If a suggested action annotation is associated with the problem, the text and script (if available) appear in the problem details.
Monitoring Rules
Monitoring rules state the values and boundaries for an asset's activity. The set of rules is called a monitoring profile. When the profiles are applied to all the assets, they enforce consistency. The monitoring profiles contain rules for threshold levels. Default profiles for monitoring hardware, operating systems, and Oracle Solaris Clusters are included in the software. You can use the default profiles, but you cannot edit them. To edit or add monitoring rules to a monitoring profile, you must make a copy.
Editing a Monitoring Rule
Monitoring rules have pre-defined parameters. You can change the parameters, including the threshold values and the monitoring level, to meet your data center guidelines. You can define the parameters by system or by group. By creating a group for each type of asset, such as operating systems, you can set specific threshold values for all members of that group and apply a monitoring profile to the group instead of editing each individual OS. By defining a group of asset and applying a monitoring profile to that group, you can easily apply a given set of monitoring rules to a large number of assets.
You might want to edit the monitoring rule parameters for an individual system if that system is on a critical path. For example, if the Enterprise Controller is considered a critical path system, you can monitor the system continuously and create more stringent monitoring thresholds for that system.
You might want to create separate monitoring groups for a set of high priority systems and a set of low priority systems. By establishing the groups, you can consistently and efficiently define the parameters for all systems in each group.
As an administrative user, you can edit monitoring rules to change the values of the monitoring variables to meet your data center guidelines.
You can perform the following tasks:
-
Change the values for the Warning and Critical thresholds.
-
Change file system thresholds.
-
Change the thresholds by system or by group.
-
Set specific threshold values for different operating systems.
For example, you can create a threshold on the Enterprise Controller system that sends a warning if the file system use rises above 90%. This will alert you if the Enterprise Controller file system is almost full.
You can edit a monitoring rule in the context of the asset or the monitoring rule.
To Edit a Monitoring Rule From the Asset View
-
Select Assets in the Navigation pane.
-
Select an asset The Summary page is displayed with the status of the asset.
-
Select the Monitoring Configuration tab.
-
Click the Monitoring tab to see a list of all the monitoring variables, both hardware and OS, the latest value of each one, and the values of their thresholds.
-
Select the monitoring variable you want to change.
-
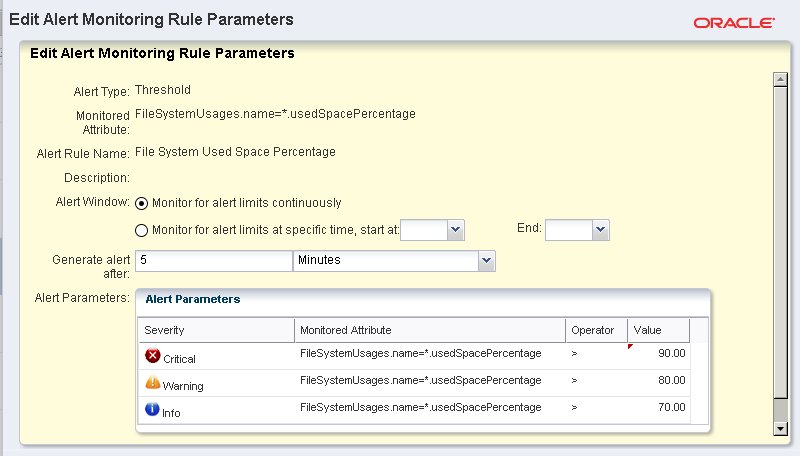
Click the Edit Alert Monitoring Rule Parameters icon. The Edit Alert Monitoring Rule Parameters window is displayed. The following is an example of the Edit Alert Rule parameter.
The details of the selected rule are displayed.
Figure 9-2 Edit Alert Monitoring Rule Parameters
Description of "Figure 9-2 Edit Alert Monitoring Rule Parameters"
-
For a threshold alert, you can change how often and for how long the value is monitored, and you can change the threshold values.
-
Alert window – Enables you to specify a period of the day when the monitoring rule is enabled. For example, if a daily maintenance operation that will cause a monitored attribute to exceed a threshold, you can exclude monitoring for that time. Effectively disabling monitoring for that maintenance window.
-
Generate alert after – Enables you to configure monitoring to ignore a monitored attribute that is outside the defined monitoring parameters for a short period of time. You might want to do this if you do not want an alert to generate when a short peak occurs. Specifying a delay here means an alert is generated only if the value remains above the specified limit for a given duration. An alert is not generated if the value goes above the limit at one time and then immediately goes back to normal.
-
-
To change a value, click the entry in the Value column and type the new value.
-
Click Apply to submit the changes.
To Edit a Monitoring Rule in the Profile
-
Click Plan Management in the Navigation pane.
-
Expand Monitoring Profiles and click a profile. The Profile Details page is displayed.
-
Click the Edit Alert Monitoring Rule Parameters icon. The Edit Alert Monitoring Rule Parameters window is displayed.
-
For a threshold alert, you can change how often and for how long the value is monitored, and you can change the threshold values.
-
Alert window – Enables you to specify a period of the day when the monitoring rule is enabled. For example, if a daily maintenance operation that will cause a monitored attribute to exceed a threshold, you can exclude monitoring for that time. Effectively disabling monitoring for that maintenance window.
-
Generate alert after – Enables you to configure monitoring to ignore a monitored attribute that is outside the defined monitoring parameters for a short period of time. You might want to do this if you do not want an alert to generate when a short peak occurs. Specifying a delay here means an alert is generated only if the value remains above the specified limit for a given duration. An alert is not generated if the value goes above the limit at one time and then immediately goes back to normal.
-
-
To change a value, click the entry in the Value column and type the new value.
-
Click Apply to submit the changes.
See Appendix A, "Scenario – Deploying a Bare-Metal System" for a list of the attributes that are available for use in monitoring rules.
Adding a Monitoring Rule
Each monitoring profile contains a default set of rules. The ruleset and default parameters depend on the managed asset subtype.
The following rule parameters, also known as rule types, are available:
-
Threshold – Sets an upper or lower monitoring threshold for the monitored attribute.
-
Boolean Control – Sets a logical operator of true or false for the monitored attribute.
-
Enumerated Control – Defines a subset of specific values among the possible values of the monitored attribute. An alert is raised if the attribute matches one of those specific values.
-
Expression – Defines the variables, literals, and operators for an attribute.
When specifying an Expression monitoring rule, you use a specific language to write a logical expression that defines the alerting condition for one or more resource attributes. The logical expression includes attribute names, logical operators, and literal values.
When adding a Threshold, Enumerated, or Boolean monitoring rule, you must define the Monitored Attribute. This is not required for the Expression rule type. The following are some examples of monitored attributes:
-
CpuUsage.usagePercentage -
ProcessUsage.topMemoryProcesses.pid=*.physicalMemoryUsage -
DiskUsageSet.name=*.busyPercentage.
Monitored attributes are available in the javadoc that is published in the Enterprise Manager Ops Center Software Developer's Kit (SDK). Install the SUNWxvmoc-sdk.pkg package, which is located in the dvd/platform/Product/components/packages directory.
Browse the available attributes and names for the monitoring framework. Attributes always start with an upper case letter, such as SystemUpTime, and fields always start with a lower-case letter.
For example, if you want to list the valid monitored attributes for an operating system, go to the com.sun.hss.type.os.OperatingSystem javadoc page. This page displays all of the attributes of an OperatingSystem
Each of these attributes is either a simple type, a structure or struct-like type, or a collection type. The following are examples of the different types of attributes:
-
Simple – You can use the name, such as
SystemUpTime -
Struct-like – You can drill-down into a field of the structure type. The fields always start with a lower-case letter, such as
SystemLoad.average1Minute -
Collection – You can drill-down into a member of the collection. For Maps you do this by specifying the appropriate 'key'. When the key is set, you need to specify the value for the 'name' field, to get the value of a single member. For example, use the following to check the 'enabled' value of the interface named 'eth0': InterfaceInfos.name=eth0.enabled
Note:
Structures are sometimes nested. For example, a struct-like attribute can contain another struct-like field, or a collection. Collections will typically contain struct-like values. To drill down, continue to append the appropriate field names.You can perform a query which scans across all members of a collection by specifying the '*' wildcard value for the key or name. If you do, you must use one of the 'max', 'min' or 'like' operators. These are the only ones that understand the manipulation of collections. The DomainQuery java class's javadoc defines the query syntax to use. See Appendix A, "Scenario – Deploying a Bare-Metal System" for a list of the attributes you can use in monitoring rules.
You can edit a monitoring rule in the context of the asset or the monitoring profile.
To Add a Monitoring Rule in the Profile
-
Expand Plan Management in the Navigation pane.
-
Click Monitoring Profiles, then double-click the profile in the center content pane or click the profile from the Navigation pane.
The Profile Details page is displayed.
-
Click the Add Alert Monitoring Rule icon in the center pane.
-
Provide a name and description for the rule that will appear in the Profile Details page.
-
Select the Asset type. The asset type is based on the profile. If another asset type is available, the option will appear in the drop-down menu.
-
Complete the Monitored Attribute. If you selected Expression, the Monitored Attribute option is not available.
-
Define the monitoring schedule, either continuously or for a specific time period. The start and end times are based on the monitored asset's time zone.
-
Define how long the alerting condition must last to be considered an alert. The default setting is 5 minutes. You can change the amount of time and the unit of measurement to be either minutes, hours, or days.
-
Complete the Alert parameters for the different severity levels.
-
Use the Immediate Action field to define what action should take place when a problem is detected.
-
Click Apply to save the rule. The new rule will appear in the profile.
To Add a Monitoring Rule From the Asset View
-
Click Assets in the Navigation pane, expand the tree and click the asset to which you want to add the rule.
-
Click the Monitoring tab to see a list of all the monitoring rules.
-
Click the Add Alert Monitoring Rule icon in the center pane. The Add Alert Monitoring Rule Parameters window is displayed.
-
Select a Rule Type from the drop-down menu: Threshold, Boolean Control, Enumerated Control or Expression
-
Select an Asset Type from the drop-down menu.
-
Complete the Monitored Attribute. If you selected Expression, the Monitored Attribute option is not available.
-
Provide a name and description for the rule that will appear in the Profile Details page.
-
Define the monitoring schedule, either continuously or for a specific time period. The start and end times are based on the monitored asset's time zone.
-
Define how long the alerting condition must last to be considered an alert. The default setting is 5 minutes. You can change the amount of time and the unit of measurement to be either minutes, hours, or days.
-
Complete the Alert parameters for the different severity levels.
-
Use the Immediate Action field to define what action should take place when a problem is detected.
-
Click Apply to save the rule. The new rule will appear in the profile.
See Appendix A, "Scenario – Deploying a Bare-Metal System" for a list of the attributes that are available for use in monitoring rules.
Disabling and Enabling Monitoring Rules
By default, all monitoring rules are enabled. You can disable one or more rules for a specific asset. An Enabled field appears in the list of monitoring rules for an asset. If No appears in the Enabled column, the rule is disabled.
To Disable and Enable Monitoring Rules
-
Click Assets in the Navigation pane.
-
Select the All Assets view, then select an asset.
-
Click the Monitoring tab.
-
Click the monitoring rule, then click the Disable Alert Monitoring Rule(s) or Enable Alert Monitoring Rule(s) icon in the center pane.
-
To select more than one rule, use Ctrl-click.
-
To select all rules, click the Select All Rules icon.
-
Monitoring Profiles
A monitoring profile defines alert configurations to be performed on one or more managed resources. A profile is for a specific type of resource, such as operating systems. A more specific profile might apply to all Oracle Solaris operating systems. Each monitoring profile contains a number of alert monitors for a specific type of resource. Alert monitors watch the state of managed resources and their attributes and raise an alert when the state is outside the pre-defined thresholds.
Displaying a List of Monitoring Profiles
A monitoring profile is a collection of rules that are associated with each type of monitored asset. The profile defines the resources monitored and the rules for that asset type. An Ops Center administrator can add and edit profiles and determine which profile is the default profile for a specific asset type. Each profile contains a version history.
The Monitoring Profiles page displays a list of all profiles, the default status of the profile, and the intended asset or target type. The following types of monitoring profiles are available:
-
User-Defined Profiles – Typically use generic rules and contain monitoring thresholds. A Operating System profile is an example of a user-defined profile that monitors the following generic OS parameters: CPU usage, disk IO queue length and utilization percentage, file system usage, memory usage, network bandwidth utilization, and swap usage, and system load.
-
System Defined Profiles – Typically use asset specific rules. The monitored details depend on what is implemented on the asset and the ability to configure these rules is limited to turning the rule on or off. An example of a system-defined profile is the MSeriesChassis profile that monitors the Xsb Mode of a SPARC M-series chassis.
The naming convention for system-defined profiles is that the name always begins with "OC".
To Display a List of Monitoring Profiles
-
Click Plan Management in the Navigation pane.
-
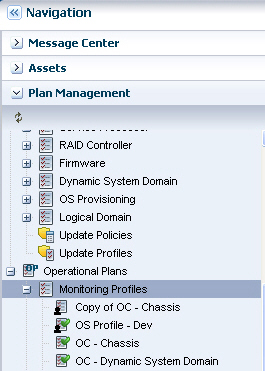
Expand Operational Plans, then click Monitoring Profiles in the Navigation pane. In the following graphic, the list of profiles appears in the left Navigation pane and in the center pane. The Navigation pane and center pane both display user-defined profiles followed by system-defined profiles. The icons and naming convention help to identify the type of profile in the Navigation pane. The profiles appear in different sections in the center pane.
Displaying Monitoring Profile Details
Monitoring profile details vary, depending on the asset and associated resources being monitored. The details page contains information about the profile, including the name, description, and if the profile is system defined or user defined. The summary information also describes the applicable types of assets or targets, if the profile is a sub-type of another profile, when the profile was last modified, and if the profile is the default profile for the target types.
The following profile details:
-
Monitoring rule
-
Alert condition (Critical, Warning, or Informational)
-
URL
-
Enabled status
The following system-defined and generic monitoring profiles are available:
-
Chassis – Monitors the chassis fan and power supply
-
GlobalZone – Monitors the DHCP status, appliance health, CPU usage, disk IO, file system usage, memory usage, network bandwidth, Swap usage, and system load of a global zone.
-
LDomGuest – Monitors Oracle VM Server for SPARC guest status, including the migration status, if the guest is running, and if the guest is powered on.
-
LDomHost – Monitors Oracle VM Server for SPARC status, including the DHCP client, appliance health, and free virtual CPU (VCPU) usage.
-
MSeriesChassis – Monitors the Xsb Mode of a SPARC M-series chassis
-
NonGlobalZone – Monitors CPU usage, disk IO queue length and utilization percentage, memory usage, network bandwidth utilization, and swap usage for non-global zones.
-
OperatingSystem – Monitors the following generic OS parameters: CPU usage, disk IO queue length and utilization percentage, file system usage, memory usage, network bandwidth utilization, and swap usage, and system load.
-
Server – Monitors the following parameters on a generic server: Power status, server port status, CPU, NIC, fan, fan tray, memory, and power supply.
-
Storage – Monitors the following parameters for a generic storage device: OS status, power status, server port status, and storage alert.
-
Switch – Monitors an ethernet switch's power status, switch port status, and switch status.
To Display Monitoring Profile Details
-
Click Plan Management in the Navigation pane.
-
Expand Profiles, then expand Monitoring Profiles in the Navigation pane.
-
Click the profile that you want to display. The profile type, name, description, target type, and whether or not the profile is the default for the target type are displayed in the center pane. The page also displays the last edit date.
Creating a Monitoring Profile
Each Monitoring profile contains a default set of rules. The ruleset and default parameters depend on the managed asset subtype.
The following methods are available for creating a new profile:
-
Create a new profile, then edit the profile to add rules.
-
Copy an existing profile and then modify the rules
-
Extract an existing profile from an asset and modify it.
To Create a Monitoring Profile
-
Expand Plan Management in the Navigation pane.
-
Click Monitoring Profiles.
-
Click Create Profile in the Action pane.
-
Provide a name and description for the monitoring profile, then select the resource type for the profile from the Subtype list.
-
Click Finish to save the profile. The new profile will appear in the center content pane.
-
(Optional) To add or remove rules or change monitoring parameters, double-click the profile in the center content pane.
-
(Optional) To make this profile the default monitoring profile, click the Set as Default Profile icon.
Extracting a Monitoring Profile
Extracting a Monitoring Profile is similar to copying a profile. Copying a profile is performed from the profile view, while extracting a profile is performed from the asset view. By extracting a profile from the asset view, you filter the possible subtypes to only those that are valid. You can change the target subtype to a more specific or a more generic eligible target type. To be eligible, the profile must be a member of a more general profile for the specified target. If a list of valid target types does not display, then the target type cannot be changed.
Each Monitoring profile contains a default set of rules. The default ruleset and parameters depend on the managed asset subtype that you select. For example, you can highlight a Solaris OS and extract a monitoring profile for an operating system. You can specify one of the following as the OS subtype for the new profile:
-
Solaris 10 – Any Solaris 10 OS that is supported by Ops Center
-
Solaris 10 Operating System – Any Solaris 10 8/07 (update 4) or higher OS that is supported by Ops Center. You might use this subtype if you was to use the profile for Solaris Zones.
-
Solaris – Any Solaris OS release that is supported by Ops Center
-
Operating System – Any Solaris, Linux, or Windows OS that is supported by Ops Center
To Extract a Monitoring Profile
-
Expand Assets in the Navigation pane.
-
Click an asset type, such as operating system, in the Navigation pane.
-
Click Extract Monitoring Profile in the Action pane.
-
Provide a name and description for the monitoring profile.
-
Select the resource type, such as Solaris 10 Operating System or Operating Systems, for the profile from the Subtype list.
-
Click Finish to save the profile. The new profile will appear in the center content pane.
-
(Optional) To add or remove rules or change monitoring parameters, double-click the profile in the center content pane.
-
(Optional) To make this profile the default monitoring profile, click the Set as Default Profile icon.