5 Using the Exachk Output
This chapter describes the output of Exachk and how you can read, interpret, and use the output.
This chapter contains the following sections:
5.1 Output of Exachk
After Exachk completes running, it generates the following output in the directory in which you installed Exachk:
-
A subdirectory named according to the following convention:
exachk_compute-node_date_timeExample:
exachk_en01cn02_051412_140521This subdirectory uses approximately 5 MB of space. Oracle recommends that you clean it regularly.
The following table summarizes the contents of this directory.
Subdirectory Content logExachk log files. outfilesA set of .outfiles, containing the environmental and configuration data that Exachk collected from the components on the Exalogic machine during the health check.reportsAn HTML report summarizing the findings that require attention and the checks that passed. For more information, see Section 5.2. This directory also contains a set of
.repfiles, summarizing the health-check result for various components on the Exalogic machine.uploadRaw data that Exachk collects for each node. -
A zip file containing the entire subdirectory, with the same name as that of the subdirectory (example:
exachk_en01cn02_051412_140521.zip).You can use this zip file while creating service requests with My Oracle Support for issues in the Exachk report that require assistance.
Note:
Do not rename any of the Exachk output files and directories.5.2 Reading and Interpreting the Exachk HTML Report
You can view the Exachk HTML report in a browser, by using an HTTP URL, as shown in the following example:
http://el01sn01/export/common/general/exachk/exachk_el01cn01_053112_101705/exachk_el01cn01_053112_101705.html
In this example, el01sn01 is the name of the storage node, el01cn01 is the name of the compute node on which the share is mounted, and 053112_101705 is the date-and-time stamp for the report.
For information about enabling access to a share through the HTTP/WebDAV protocol, see "Enable Access to the /export/common/general Share Through the HTTP/WebDAV Protocol".
The HTML report lists the most important exceptions, by component, first. The report contains the following sections.
Note:
The sections in the HTML report may vary, depending on the options selected while running Exachk. The appearance of the HTML report may vary depending upon the environment settings and browser preferences.5.2.1 Exalogic Rack Summary
This section of the report summarizes the key environmental data that Exachk collected from the Exalogic machine, as shown in the following example:
Figure 5-1 Sample of Exalogic Rack Summary
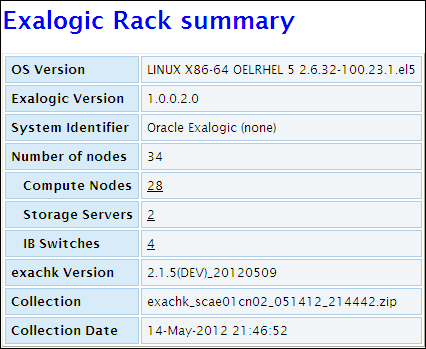
Description of "Figure 5-1 Sample of Exalogic Rack Summary"
To view details of the compute nodes, storage nodes, and InfiniBand switches, click on the numbers adjacent to the components listed.
5.2.2 Findings Needing Attention
This section lists the health checks that failed, resulted in an error, or resulted in a WARNING or INFO status.
For more information about each check, see My Oracle Support document 1463157.1.
Table 5-1 describes status messages and the action that needs to be taken for each status message:
Table 5-1 Health-Check Status Message: Description and Action
| Message Status | Description or Possible Impact | Action to be Taken |
|---|---|---|
|
FAIL |
Shows checks that did not pass due to issues. |
Address the issue immediately. |
|
WARNING |
Shows checks that might cause performance or stability issues if not addressed. |
Investigate the issue further. |
|
ERROR |
Shows errors in system components. |
Take corrective measures, and restart Exachk. |
|
INFO |
Indicates information about the system. |
Read the information displayed in these checks, and follow the instructions provided, if any. |
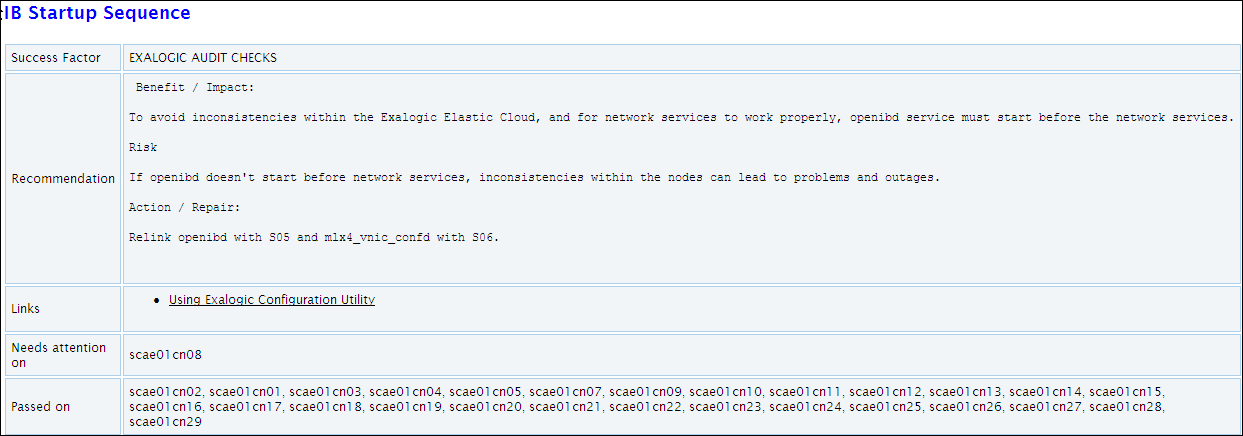
For samples of the content in the Findings Needing Attention section, see Figure 5-2, Figure 5-3, and Figure 5-4.
Figure 5-2 Sample of Findings Needing Attention
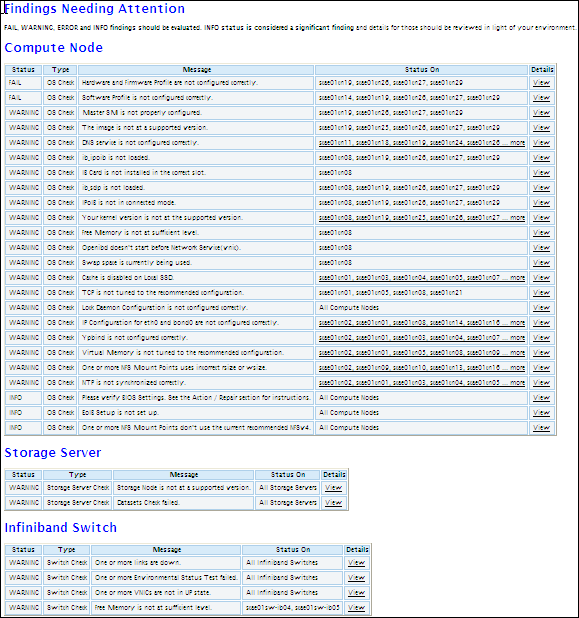
Description of "Figure 5-2 Sample of Findings Needing Attention"
Figure 5-3 Part I - Sample of Detailed Report for Findings Needing Attention
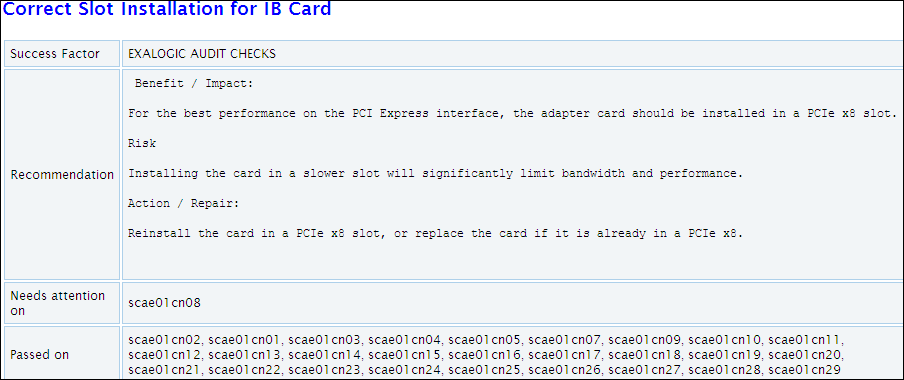
Description of "Figure 5-3 Part I - Sample of Detailed Report for Findings Needing Attention"
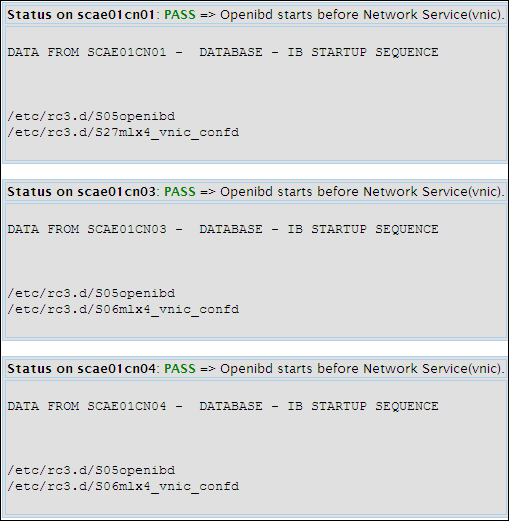
Figure 5-4 Part II - Sample of Detailed Report of Findings Needing Attention
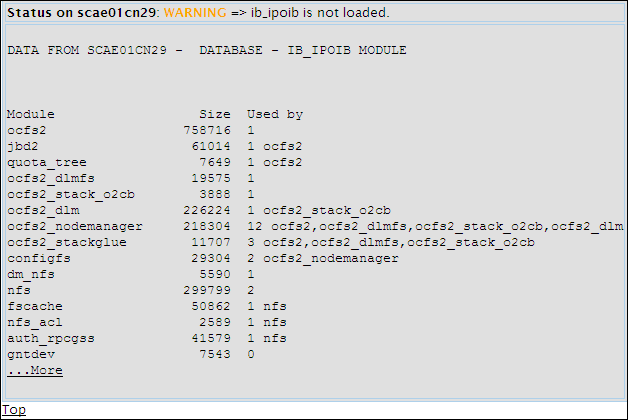
Description of "Figure 5-4 Part II - Sample of Detailed Report of Findings Needing Attention"
The findings needing attention, are listed in separate subsections for compute nodes, storage nodes, and InfiniBand switches. Table 5-2 describes the elements displayed in Findings Needing Attention of the Exachk output.
Table 5-2 Elements Displayed in Findings Needing Attention of the Exachk Output
| Element | Description |
|---|---|
|
Status |
Displays the status of the health check on a specific component. See Table 5-1 for information about the health-check status message. |
|
Type |
Displays the type of health check that has been run on a specific component. |
|
Message |
Displays a brief description of the issue that has led to a specific status message. |
|
Status On |
Displays the nodes that need to be examined for specific issues. |
|
Details |
Exachk assesses all of the items in the system, and calls attention to findings. These findings are displayed in details in the "Best Practices and Recommendations" section of the Exachk report. Click View to explore detailed information about each component. The detailed information is available in two parts. The first part provides an explanation of the following sections:
The second part contains the raw data about each component. Click More to view all of the data provided in this section. See Figure 5-4. Click Top to go back to the main section of the Exachk output. |
5.2.3 Findings Passed
This section lists the health checks that passed, as shown in Figure 5-5, Figure 5-6, and Figure 5-7.
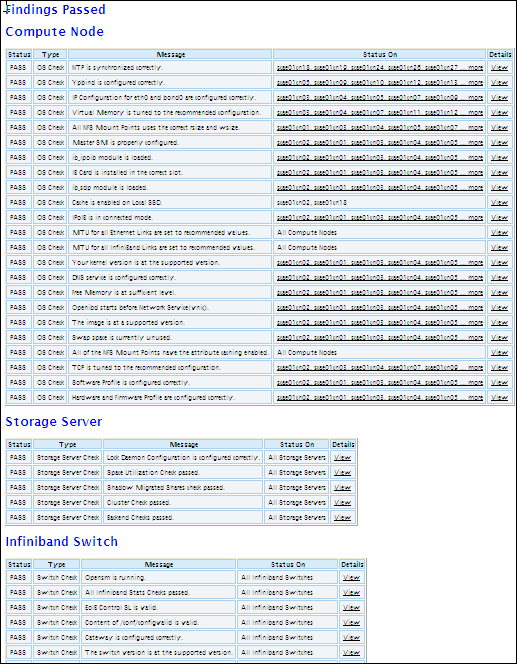
Figure 5-6 Part I - Sample of Detailed Report of Findings Passed
Description of "Figure 5-6 Part I - Sample of Detailed Report of Findings Passed"
Figure 5-7 Part II - Sample of Detailed Report of Findings Passed
Description of "Figure 5-7 Part II - Sample of Detailed Report of Findings Passed"
The structure of this section of the report is the same as that of the Findings Needing Attention section, as described in Table 5-2.
5.2.4 System-Wide Firmware and Software Versions
This section lists the firmware and software versions of all the components for which the health check was performed.
5.2.5 Skipped Nodes
This section lists components for which Exachk did not perform any health check. Skipped components are those that, typically, Exachk cannot access.
The following table lists the typical situations when Exachk skips a component and the solution for each situation:
| Situation | Solution |
|---|---|
| The IP address of the component is incorrect or the host name cannot be resolved. | Update exachk_exalogic.conf or the o*.out files, as appropriate, with the correct IP addresses, and run Exachk again.
For more information, see Section 4.4. |
| The component is not running. | Ping (or SSH to) the component. If the ping or SSH command fails, ensure that the component is started. Then, run Exachk again. |
| The network is congested and very slow, causing an SSH time-out. | Try increasing the value of the environment variable, RAT_TIMEOUT, and run Exachk again.
For more information, see Section 4.1.1. |
| The component is overloaded and low on memory, causing a password time-out. | Try increasing the value of the environment variable, RAT_PASSWORDCHECK_TIMEOUT, and run Exachk again.
For more information, see Section 4.1.1. |
5.3 Comparing Health-Check Results in Two Exachk HTML Reports
You can use the -diff option of Exachk to compare two Exachk HTML reports. When you use this option, Exachk generates a comparison report in HTML format, highlighting the changes in the health of the Exalogic rack between Exachk runs. You can also use this feature to identify checks that have been introduced in a new version of Exachk.
To compare two Exachk reports, run the following command:
# ./exachk -diff report1 report2 [-outfile name_of_compared_report.html]
-
report1andreport2are the names of the reports being compared. -
-outfileis the full path and name of the file in which the comparison report must be saved.By default, the comparison report is stored in a file named
exachk_report1_report2_diff.html.
Example:
# ./exachk -diff exachk_ec1-vm_021213_040840 exachk_ec1-vm_021213_040912 -outfile compared_report.html
The comparison report provides the following information:
-
A summary of the comparison
-
Differences between the health-check results in the two HTML reports
-
Checks that exist in only one of the two HTML reports
-
Checks that are common to both HTML reports
For information about the columns in the tables of the comparison report, see Table 5-2.
5.4 Removing Checks from the Exachk HTML Report
To remove checks from an HTML report, click Remove finding from report in the Table of Contents of the HTML report as shown in Figure 5-8.
Figure 5-8 Table of Contents of the HTML Report
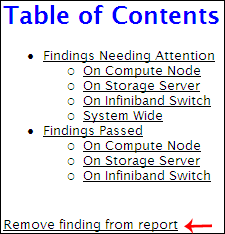
Description of "Figure 5-8 Table of Contents of the HTML Report"
The layout of the report changes as follows:
-
The Remove finding from report option changes to Hide Remove Buttons.
-
For each row in the Findings Needing Attention and Findings Passed tables, a button labeled X is displayed in the Status column.
To customize your report, you can complete the following steps:
-
To revert to the original layout—that is, without the X buttons, click the Hide Remove Buttons link in the Table of Contents.
-
To remove an item from the report, click X.
-
To save the changes that you made in the report, save the HTML file using a new name.
-
To clear any changes that you have made in the Exachk report, close the browser session.
Note:
Removing findings from the HTML report does not change the original HTML file, unless you save the modified HTML file using the same name as that of the original.5.5 Comparing Component Versions in Two Exachk Collections
You can use the -exadiff option of Exachk to compare two Exachk collections. When you use this option, Exachk generates a comparison report in HTML format, highlighting the differences in the versions of the infrastructure components (hardware, firmware, and software) between the two reports. The two Exachk reports can be for different Exalogic racks or at different points in time for the same rack, such as before and after upgrading the rack.
To compare two Exachk collections, complete the following steps:
-
Identify the two Exachk collections (zip files) that you want to compare.
-
If the collections do not already exist on the host (compute node or vServer) on which you are running Exachk, copy the collections to the host.
-
Run the following command:
./exachk -exadiff collection_1 collection_2
In this command,
collection_1andcollection_2are the full paths and names of the two collections that you want to compare. You can specify either the collection zip file or the directory in which the zip file has been extracted. -
Wait for the command to finish executing.
After comparing the two collections, Exachk saves the results of the comparison in an HTML file named rack_comparison_date_time.html (example: rack_comparison_131219_213435.html).
You can view the HTML report in a browser, by using an HTTP URL, as shown in the following example:
Example:
http://el01sn01/export/common/general/exachk/rack_comparison_131219_213435.html
In this example, el01sn01 is the name of the active storage node, /common/general is the share in which the Exachk reports are stored, and 131219_213435 is the date-and-time stamp for the report.
Note:
For information about enabling access to the/common/general share through the HTTP protocol, see "Enable Access to the /export/common/general Share Through the HTTP/WebDAV Protocol".