| Skip Navigation Links | |
| Exit Print View | |

|
Oracle Solaris Studio 12.2: Simple Performance Optimization Tool (SPOT) User's Guide |
| Skip Navigation Links | |
| Exit Print View | |

|
Oracle Solaris Studio 12.2: Simple Performance Optimization Tool (SPOT) User's Guide |
1. The Simple Performance Optimization Tool (SPOT)
2. Running SPOT on Your Application
Runtime System and Build Information
Analysis of Application Stall Behavior Section
Maximum Resources Used By The Process Section
Pairs of Top Four Stall Counters Section
SPOT automatically runs the spot_diff script after each data collection run. This tool compares the new run with the preceding ones. The output from the spot_diff script is the spot_diff.html file, which contains several tables that compare SPOT experiment data.. Large differences are highlighted to alert you to possible performance problems.
You can call the spot_diff script from the command line for situations where you need greater control over particular experiments. For example, to generate a spot_diff report called exp_1-exp_2-diff.html comparing experiment_1 and experiment_2, you would type:
spot_diff -e experiment_1 -e experiment_2 -o exp1-exp2-diff
For more information, see the spot_diff(1) man page.
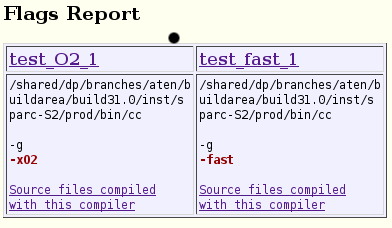
The spot_diff report examined in this section was automatically generated by SPOT after running SPOT twice on the test example application. For the first run, test was compiled with the -xO2 option. For the second run, the application was compiled with the -fast option. The output from the first run was recorded in the test_xO2_1 directory. The output from the second run was recorded in the test_fast_1 directory.
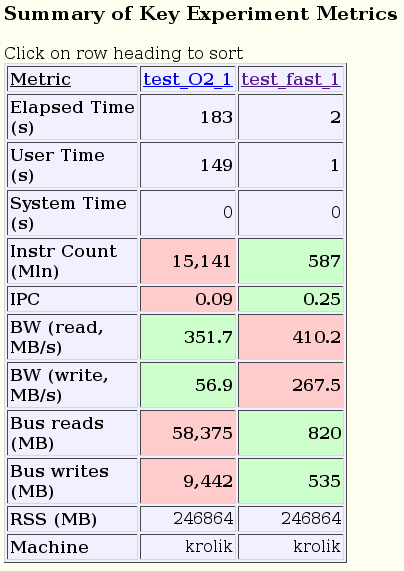
The Summary of Key Metrics section of the report compares several top-level metrics for the two experiments. You can see that compiling with higher optimization causes both the runtime and the number of executed instructions to decrease. It is also apparent that the total number of bytes read and written to the bus is similar, but because the second experiment ran faster, its bus bandwidth is correspondingly higher.
The top causes for stalls are displayed in two tables, one by percent execution time and the other in absolute seconds. Depending on your preference or the application you are observing, one of the tables might be more useful than the other in identifying a performance problem.
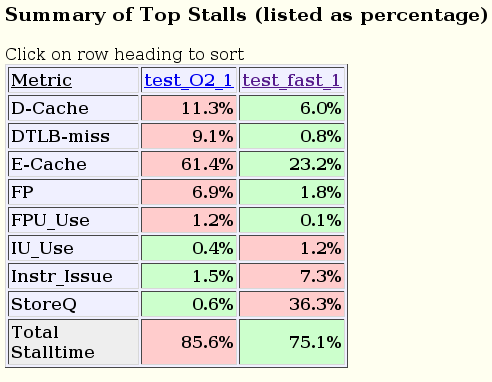
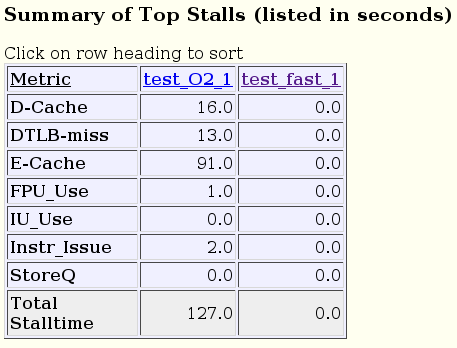
For the example used here, it might be more useful to look at the top stalls listed in seconds because the two runs are doing the same work. The table shows that the optimizations enabled by the -fast option significantly reduce the stalls. By clicking the column head hyperlinks in the table to go to the SPOT experiment profiles for the two runs, you can learn that:
Prefetch instructions are responsible for reducing the cache stalls.
Better code scheduling eliminated back-to-back floating point operations, which reduced the Floating Point Use stalls.
In both cases, the binary was compiled with an optimization level higher than -xO1, so SPOT was able to collected instruction count data. This data is displayed in the Bit Instruction Counts Report.
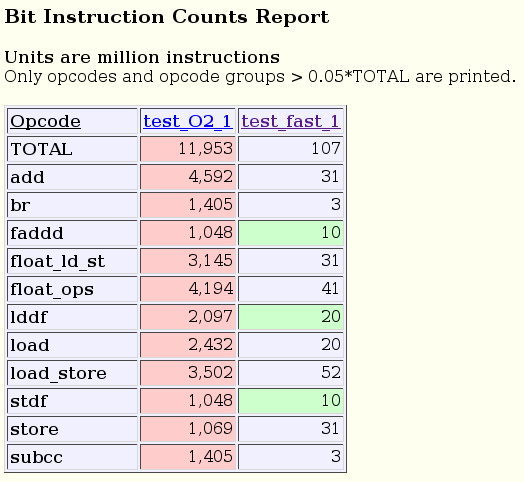
The difference in instruction counts between the two runs is primarily due to unrolling (and to a lesser extent, inlining) done when compiling with the -fast option, which greatly reduces the number of branches and loop-related calculations.
Only instructions that show both high variance between experiments and a high total count are displayed in this table.
You can see more detailed bit data by clicking the column head hyperlinks and looking at the instruction frequency statistics in the two experiment profiles.
In the Flags report, you can see that the only difference between the two experiments is the optimization option.
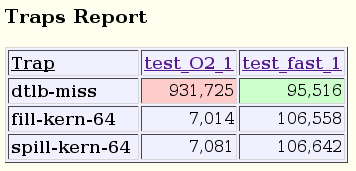
While the total number of Data TLB traps in the two experiments is roughly the same, the trap rate, as shown in the Traps report, is higher in fast experiment because that binary runs in less time. All other trap rates, which you can see in the hyperlinked experiment reports, are too low to report.
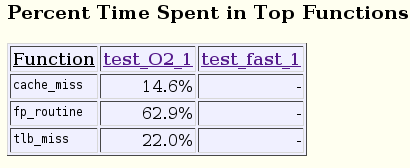
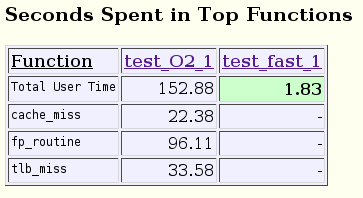
The time spent in top functions is displayed in two tables, one in percentage of time and one in seconds of execution time. In both tables, it is apparent that the cache_miss(), fp_routine(), and tlb_miss() functions are inlined when the application is compiled with the -fast option, but not when it is compiled with the -xO2 option.
