| Skip Navigation Links | |
| Exit Print View | |

|
Oracle Solaris Studio 12.2: Simple Performance Optimization Tool (SPOT) User's Guide |
| Skip Navigation Links | |
| Exit Print View | |

|
Oracle Solaris Studio 12.2: Simple Performance Optimization Tool (SPOT) User's Guide |
1. The Simple Performance Optimization Tool (SPOT)
2. Running SPOT on Your Application
Runtime System and Build Information
Analysis of Application Stall Behavior Section
Maximum Resources Used By The Process Section
Pairs of Top Four Stall Counters Section
Summary of Key Experiment Metrics Table
The SPOT report for each run of your application with SPOT includes a section for each of the files that SPOT writes to the subdirectory for that run. To display the report, point your web browser to the index.html file in the subdirectory.
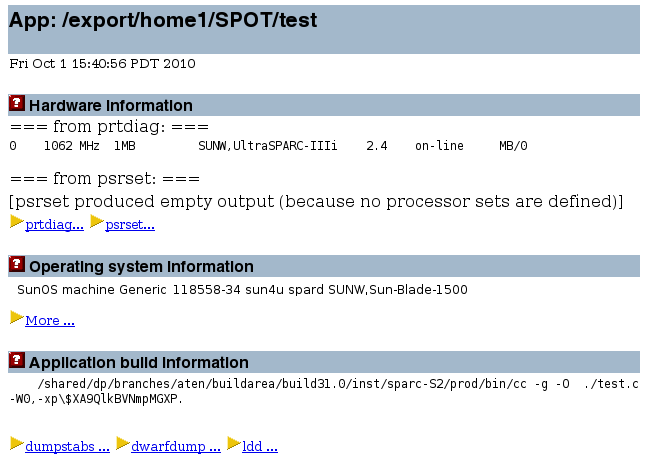
The Hardware information, Operating system information, and Application build information sections of the SPOT report list details on the system on which SPOT was run on the application and on how the application was compiled. This information can help you to reproduce the same results at another time.
The Application stall information section displays information collected by the ripc tool about what processor events were encountered during the run of the application. The processor has event counters that are incremented either each time an event occurs or each cycle during the duration of an event. Using these counters, SPOT can determine values for the cache miss rate, or the number of cycles lost due to cache misses. The information is displayed in several text subsections.
Note - You can run ripc as a stand-alone tool. Type ripc -h for a list of the command line options, and consult the ripc(1) man page for more information.
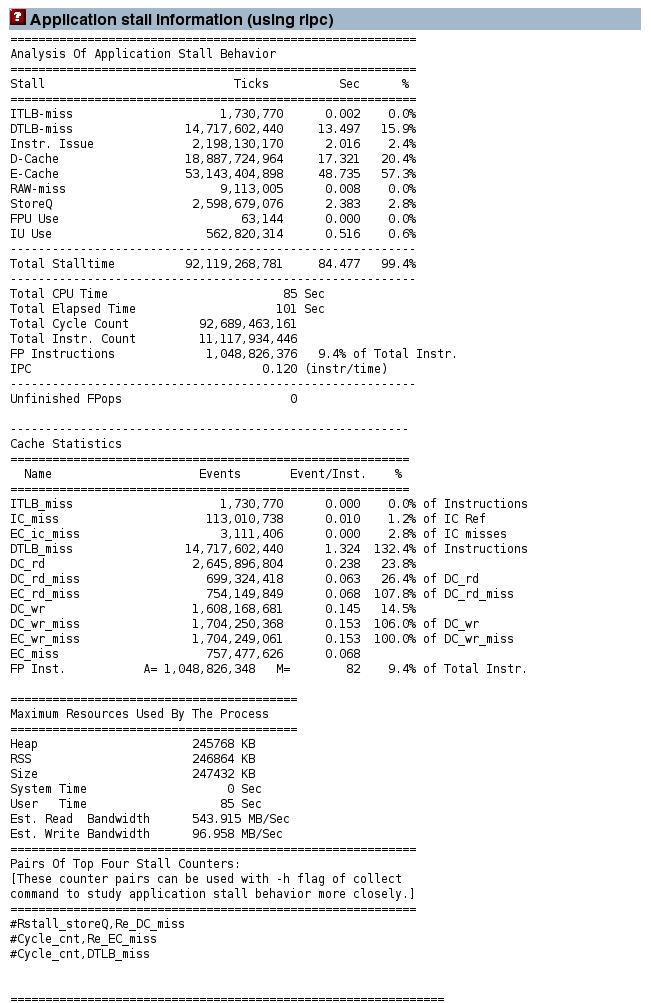
The Analysis of Application Stall Behavior section shows the percentage of the total number of cycles lost to each type of processor event. The events are different on different processors. For example, an UltraSPARC IV+ has a third level of cache that is not present on previous generations of processors.
In this report for a run of the example code, the time is lost due to Data Cache misses, External Cache misses, and Data TLB misses. Together these three types of events account for more than 93% of the execution count of the benchmark:
The Data Cache miss time represents time spent by load instructions that found their data in the External Cache.
The External Cache miss time is accumulated by load instructions where the data was not resident in either the Data Cache or the External Cache, and had to be fetched from memory.
The Data TLB miss time is caused by memory accesses where the TLB mapping is not resident in the on-chip TLB, and has to be fetched using a trap to the operating system.
The section also shows data that summarizes the efficiency of the entire run. The IPC is the number of instructions executed per cycle. The Grouping IPC is an estimate of what the IPC would be if the processor did not encounter any stall events.
A single line at the bottom of the section reports the number of unfinished floating point traps. These traps can occur in some exceptional circumstances on most UltraSPARC processors. They can take a significant time to complete, and are also hard to observe in the profiles. Most of the time this count should be zero, but if there are a large number of such events, it is definitely worth investigating what is causing them.
The Cache Statistics section reports the number of events that occurred as a proportion of the total number of opportunities for the events to occur, in other words, how much useful work the processor is achieving each cycle. An example is the number of cache misses as a proportion of cache references.
The Maximum Resources Used By The Process section shows data on the memory utilization for the application, and the user and system time.
The Pairs of Top Four Stall Counters section lists the performance counters that should be profiled if more detail is required.
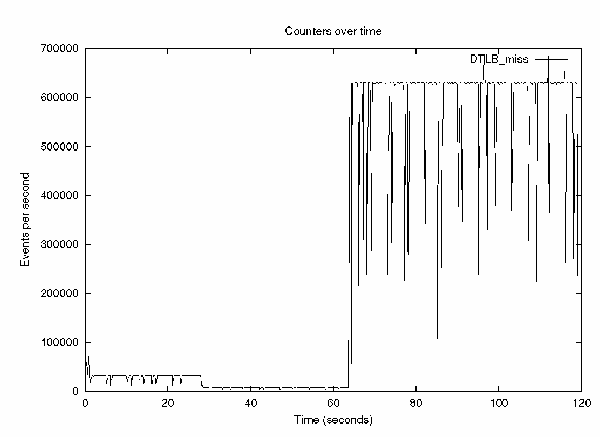
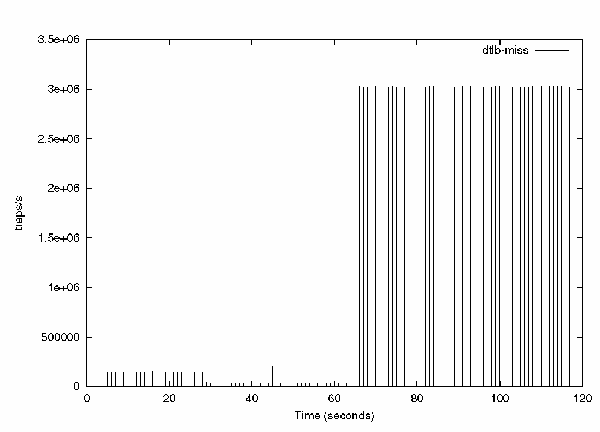
If rpic locates the gnuplot software in the system's path, it also generates a graph of how the events occurred over the entire run time. For example, the following graph clearly shows three phases of the test application. The first two phases contain only a few TLB misses, but the graph shows large numbers of misses during the execution of the final tlb_misses routine.
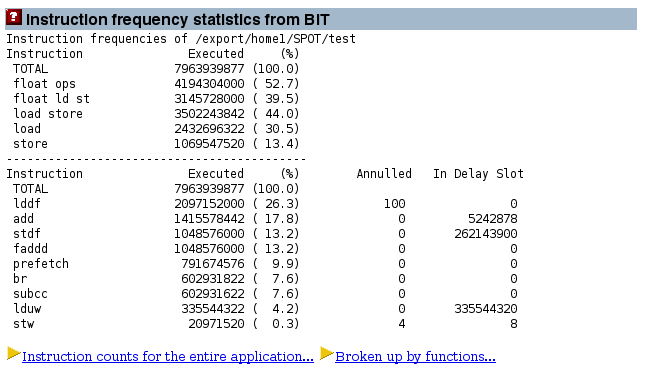
The Instruction frequency statistics from BIT section of the report shows information generated by the BIT tool on the frequency with which different assembly language instructions are used during the run of the application, providing a more detailed kind of instruction count.
BIT does not generate information about the performance of the application, but it does provide information about what the application is doing.
The section lists the number of instructions executed, and for these instructions, how many were located in the delay slot and how many were annulled (not executed).
The Annulled and In Delay Slot columns require some explanation. Every branch instruction has a delay slot, which is the instruction immediately following the branch. This instruction is executed together with the branch. The branch can annul the instruction in the delay slot so that the instruction is performed only if the branch is taken.
Note - BIT works by running a modified version of the application, application_name.instr, which contains instrumentation code that collects count data over the course of the run. For this instrumentation to work, you must have compiled the application with an optimization level of -xO1 or higher.
Note - You can run BIT as a stand-alone tool. Type bit -hfor a list of command line options, and consult the bit(1) man page for more information.
It is not possible to measure the bandwidth consumption of a single process, since one process can read memory that is attached to processors running other processes. Hence the bandwidth reported here is system-wide. A consequence is that it is not possible to attribute the memory activity to a single process if there are multiple processes running on the system.
SPOT collects bandwidth data if you run it with the -X option and root privileges. The average bandwidth consumption over the entire run of the test program is reported.

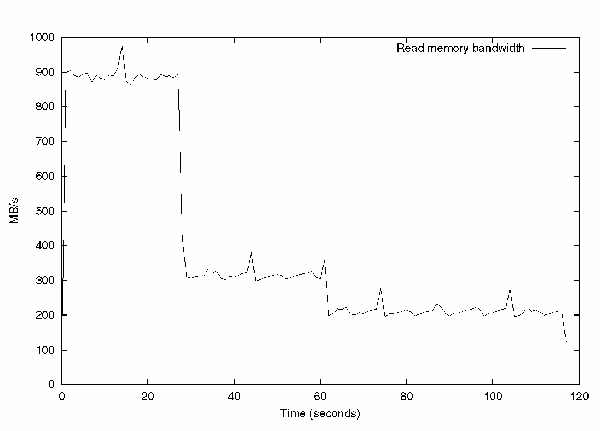
If bw locates the gnuplot software in the system's path, it generates a graph of the bandwidth data. For example, the following graph shows the read memory bandwidth consumed over the entire run of the application. The fp_routine routine consumes the most bandwidth because it is three streams of data being used by the processor. The other two routines use less bandwidth because they are pointer chasing, and therefore testing memory latency.
Note - You can run bw as a stand-alone tool, outside of SPOT. Type bw -hfor a list of the command line options, and consult the bw(1) man page for more information.
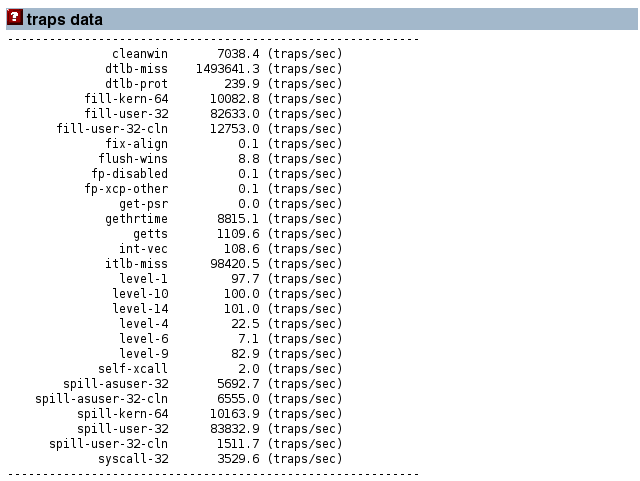
The traps data section displays data that SPOT collects by running the trapstat software for the duration of the run of the application. SPOT collects this data when you run it with the -X option and with root privileges.
trapstat counts system-wide traps, not just the traps that are due to this process, so it is not possible to distinguish between traps generated by the application and those generated by other processes running on the system.
The table reports the average number of traps encountered per second.
If trapstat locates the gnuplot software in the system's path, it also generates a graph of traps over time. The following graph shows number of TLB traps reported over the entire run of the test application. As expected, the traps reported by trapstat correspond to the traps reported by the performance counter on the processor.
If you request extended information by running SPOT with the -X option, then SPOT profiles the application using the performance counters that contribute the most stall time to the run of the application. It generates several profiles of the application that indicate exactly where in the code the events are occurring.
For this run of the test application, it is apparent that the External Cache (EC) misses are mainly attributable to the cache_miss and tlb_miss routines.
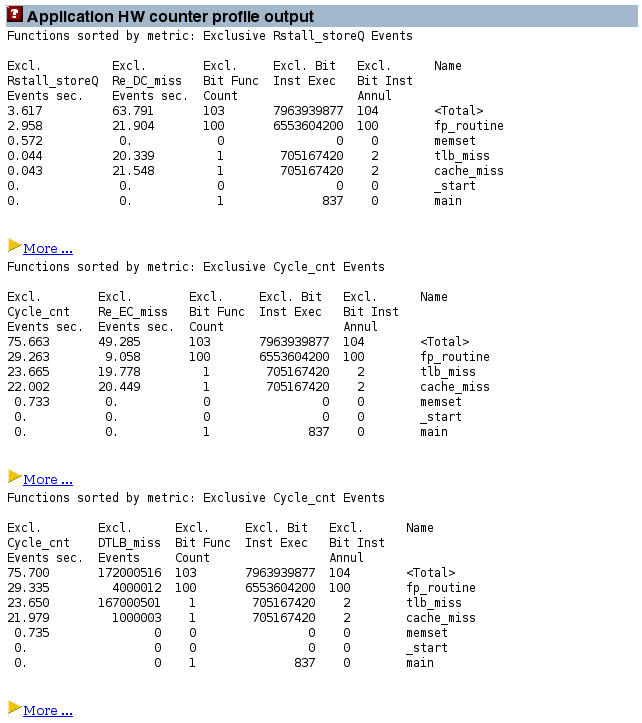
Clicking the More hyperlinks opens more detailed displays of source code (if you compiled the application with the -g option and the source code is accessible) and the disassembly code.
The Application Profile Output section shows a summary of which routines consumed the most run time.
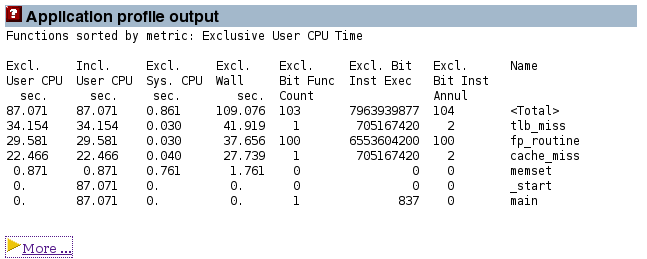
Clicking the More hyperlink displays a page that allows exploration of the application in more depth.

The hyperlink at the top of each column lets you make that column the sort key for the data on the page.
The columns list the following data:
The Excl User CPU column displays the amount of time spent in the source code corresponding to the routine shown on the right.
The Incl User CPU column displays the amount of time spent in a given routine, plus the routines that routine calls, which is apparent when looking at the row for the main routine. No exclusive time attributed to that routine, but it has 120 seconds of inclusive time, which is all due to the routines that the main routine calls.
The Excl Sys CPU column displays the system time attributed to the various routines.
The Excl Wall column displays the number of seconds spent in a given routine. For a single threaded application, this time is the sum of the user time, system time, and various other wait and sleep times. For a multithreaded application, it is the time spent by the master thread, which in many cases might not be actively doing work.
The Excl Bit Func column reports the number of times that each function is called. This count does not extend to library functions, so the routine _memset, which is in a library, is attributed with a count of zero even through it is called multiple times.
The Excl Bit Instr Exec column counts the dynamic number of instructions executed during the run of the application for each routine.
The Excl Bit Instr Annul column shows a count of the instructions that were annulled (not executed) during the run.
On the right side of the page, the Name column contains links to the routines:
The trimmed link goes to a trimmed-down version of the disassembly of the routine. The trimming is done to remove parts of the code that have no time or events attributed to them.
The routine name link goes to the complete disassembly for the routine. This file can be very large since often many routines share the same source file. So the trimmed link is frequently the more appropriate one to use.
The src link goes to the source code for the routine. This link is available only if the program was compiled with the -g or -g0 option.
The Caller-callee link goes to the caller-callee page, which indicates which routines call which other routines, and how the time is attributed between them.
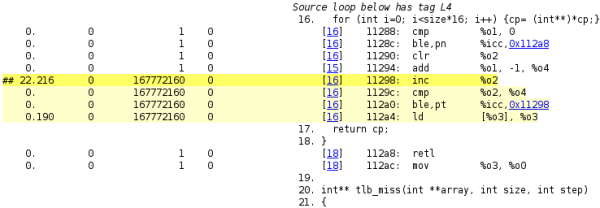
The source code report for a routine shoes how time is attributed at the source code level. For example, the source code report for the tlb_misses routine, the line starting with ## and highlighted has a high count for user time and dynamic instruction count for one of the processor events. The source code report also includes compiler commentary about the two loops in the code that are shown.

The disassembly page holds more specific information. A hot line of disassembly is highlighted. The execution counts for the individual assembly language instructions are shown, so you can see that the loop is entered once and iterated nearly 170 million times. The hyperlinks let you rapidly navigate to either line of source code that generated the disassembly instruction of the target of a branch instruction.
The caller-callee page shows information for the functions that call the routine (callers) and the functions that the routing calls (callees).
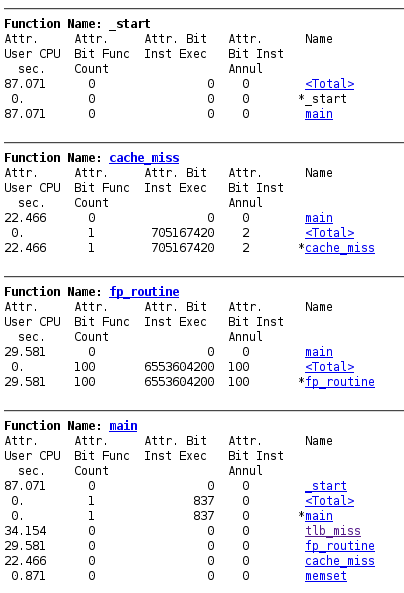
The caller-callee information is complex to read. In each section, the routine of focus is indicated by an asterisk.
For example, in the section for the main routine, that routine has an asterisk to the left of its name. The _start routine and the <Total> routine (a synthetic metric representing the run time of the entire application) are listed above the main routine. This information indicates that the main routine is called by the _start routine. The four routines listed after the main routine are routines that are called by the main routine.
The first column lists the attributed user CPU time. About 88 seconds are attributed to the _start routine. These seconds are the time that _start spends calling the main routine. The attributed time for the main routine is 0, indicating that no time is spent in that routine. The attributed time for the four routines called by main adds up to the 88 seconds.
The section of the page for the fp_routine routine shows that almost 30 seconds are spent by the main routine calling the fp_routine routine. However, in this case, all of that time is spent directly in the fp_routine routine.
Note - The profile data is collected with the collect tool, so it is stored as a Performance Analyzer experiment and you can also examine it with the Performance Analyzer or the er_print tool. For more information, see the analyzer(1) and er_print(2) man pages.
You can also convert experiment data collected by the collect tool to HTML format by using the er_html tool as a stand-alone tool. Type er_html -hfor a list of the command line options, and consult the er_html(1) man page for more information.