Release 7.3
Part Number E10533-06
Contents
Previous
Next
| Oracle Demantra Sales and Operations Planning User Guide Release 7.3 Part Number E10533-06 | Contents | Previous | Next |
To manage or view forecasts and demand, you start in the Collaborator Workbench and launch any of the relevant Sales and Operations Planning worksheets: Worksheets with the necessary series for analysis and modification of the forecast are available for the analyst at the beginning of each cycle.
The sales and operations planning process is typically done at an aggregate fiscal period level. By default, Sales and Operations Planning uses a weekly base time unit and displays worksheets with a 4-4-5 weekly calendar. Some worksheets that use inventory-type series (Inventory Plan, Projected Backlog, Consolidated Plan, and KPI Dashboard) are configured with weekly time buckets.
Worksheet time display is fully configurable and may be changed. It is recommended that you do not overwrite seeded worksheets. Use Save As and rename the modified worksheets to preserve the original worksheet definition.
The demand review process produces a consensus demand forecast. This forecast feeds supply planning to create a supply plan that includes rough-cut capacity, production and inventory plans.
The hand-off from Demand Management to Sales & Operations Planning is in the collaborative demand review process. In this process, multiple stakeholder forecasts (series) are combined to produce a one-number, consensus forecast to drive the business.
The following worksheets are used during the demand review process:
| Worksheet | Description |
| Consensus Waterfall Analysis Product Category | Comparison between actual vs. forecast demand, aggregated by product category and organization, to determine prior periods forecast accuracy. |
| Marketing Forecast | Displays historical demand and individual marketing stakeholder forecast trends, aggregated in quarterly buckets. |
| Sales Forecast | Displays sales and forecast values for individual products, broken down by 4-4-5 time buckets. |
| Consensus Forecast Product Category | Displays the consensus forecast and budget (or financial plan) by category or product family (in currency). |
| Exception Real Time Sales Tracking | Compares bookings for future dates with the consensus forecast at the Item level. |
The supply review determines the firm’s ability to meet the consensus-based demand, measures past performance and projects future performance.
The following worksheets are used during the supply review process:
| Worksheet | Description |
| Constrained Forecast Product Category | Compares the unconstrained consensus forecast derived from the Demand Review Consensus Forecast worksheet with the contrained forecast coming from supply planning. |
| Resource Rough Cut Capacity Plan | Machine and crew capacity-planning worksheet by scenario. |
| Supplier Rough Cut Capacity Plan | Plans future supply capacity by item and supplier. |
| Production Plan Product Category | Displays planned production by product category including actual production performance to plan. |
| Inventory Plan Product Category | Displays overall planned level of inventory by product category, including actual inventory performance to plan. |
| Projected Backlog Product Category | Displays historical backlog and future backlog trend. |
| Consolidated Plan Product Category | Displays demand, supply and the projected on-hand inventory. |
The financial review reconciles the consensus demand and operational plans with financial performance metrics.
The following worksheets are used during the financial review process:
| Worksheet | Description |
| Financial Forecast | Compares consensus plan with the financial forecast and budget. |
| Financial Summary Product Category | Compares operational plan with budget. |
The executive review finalizes the demand plan and the supply plan, determines the financial implications, and integrates top-level business plans with tactical plans.
The following worksheets are used during the executive review process:
| Worksheet | Description |
| Cumulative Plan Product Category | Compares cumulative planning data with the budget. |
| KPI Dashboard Product Category | Displays S&OP Key Performance Indicators by scenario and category. |
| KPI Scenario Comparison Product Category | Compare S&OP scenarios by key performance indicators. |
The first step in the demand review process is to look at your previous cycle and determine how accurate your forecasts were. Using the Waterfall Analysis worksheets you can compare actual versus forecast demand for individual product categories, organizations, and regions (zones). By comparing actuals to forecast, demand planners can identify problem areas, and deduce why forecast demand did better (or worse) than planned.
Note: This worksheet is essentially the same as the Demand Management Consensus Waterfall Analysis Product Category worksheet, except that the Consensus Forecast series is used for archiving, instead of Final Forecast.
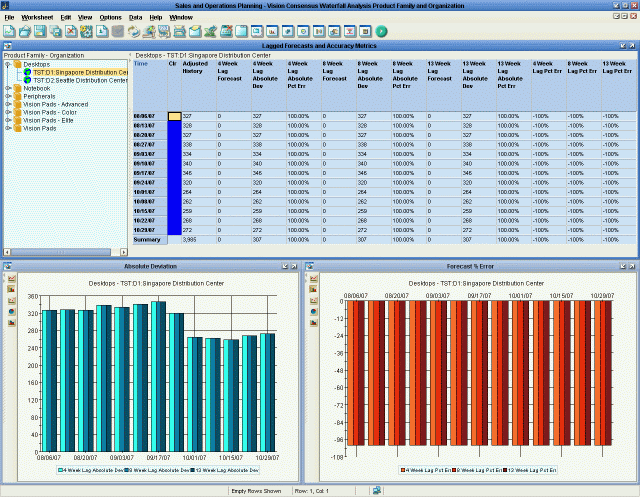
The Waterfall Analysis worksheet is aggregated at the Product Category and Organization level. The following archived forecasts are used in these worksheets:
4 Week Lag Forecast: The forecast series for the current week minus four.
8 Week Lag Forecast: The forecast series for the current week minus eight.
13 Week Lag Forecast: The forecast series for the current week minus 13.
4, 8, and 13-Week Lag Absolute Percentage Error: A measure of forecast accuracy, which is calculated as actual demand minus forecast demand, and displayed as a percentage.
4, 8, and 13-Week Lag Absolute Deviation: A measure of forecast accuracy, and represents the average amount that the actual demand varies from forecast demand.
| Accessing this Worksheet | In My Worksheets (in Collaborator Workbench), click Consensus Waterfall Analysis Product Category. |
| Levels you can select | Product Category and Organization |
| Time Aggregation | Weekly |
The following series are available in this worksheet:
| Series | Description |
| Color | Legend indicating Color indicator for rolling horizon. Values are:
|
| Adjusted History | Unconstrained historical sales. |
| 4 Week Lag Forecast | Forecast archived four weeks prior to the current time bucket. |
| 4 Week Lag Absolute Deviation | Absolute Deviation for the forecast archived four weeks prior to the current time bucket. |
| 4 Week Lag Absolute % Error | Absolute percentage error for the forecast archived four weeks prior to the current time bucket. |
| 4 Week Lag % Error | Percentage error for the forecast archived four weeks prior to the current time bucket. |
| 8 Week Lag Forecast | Forecast archived eight weeks prior to the current time bucket. |
| 8 Week Lag Absolute % Error | Absolute percentage error for the forecast archived eight weeks prior to the current time bucket. |
| 8 Week Lag Absolute Deviation | Absolute Deviation for the forecast archived eight weeks prior to the current time bucket. |
| 8 Week Lag % Error | Percentage error for the forecast archived eight weeks prior to the current time bucket. |
| 13 Week Lag Forecast | Forecast archived 13 weeks prior to the current time bucket. |
| 13 Week Lag Absolute % Error | Absolute percentage error for the forecast archived 13 weeks prior to the current time bucket. |
| 13 Week Lag Absolute Deviation | Absolute Deviation for the forecast archived 13 weeks prior to the current time bucket. |
| 13 Week Lag % Error | Percentage error for the forecast archived 13 weeks prior to the current time bucket. |
Use the Marketing Forecast worksheet to examine historical demand trends, forecast accuracy and trends for marketing stakeholder forecasts, where data is aggregated in quarterly buckets. It also provides the means to observe the difference between the Marketing Forecast and Consensus Forecast by category.
The Marketing Forecast worksheet displays a table and graph showing demand and forecast values. You can override the baseline forecast by entering either a baseline quantity or percentage.
Note: The Marketing Baseline series is not populated automatically during data collections. The administrator must specify a source for this data.
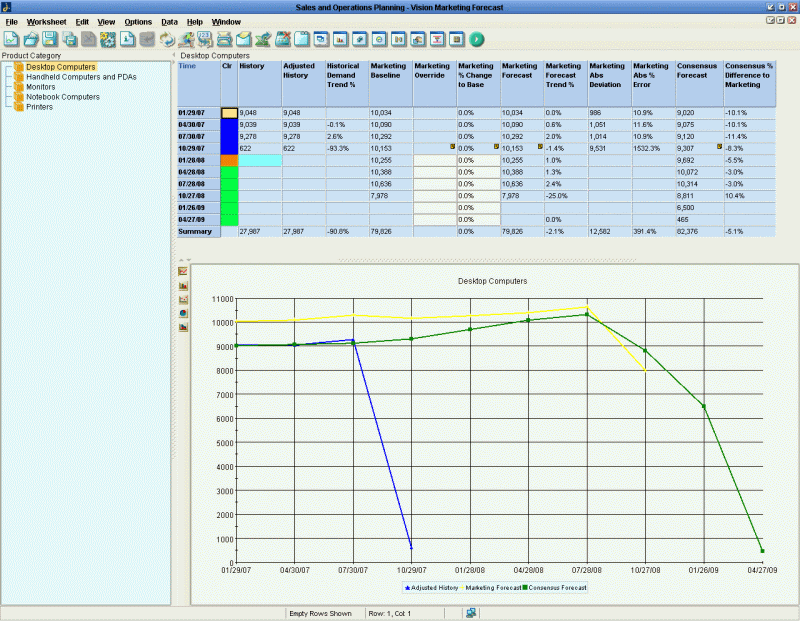
| Accessing this Worksheet | In My Worksheets (in Collaborator Workbench), click Marketing Forecast. |
| Levels you can select | Product Category. |
| Time Aggregation | Quarterly |
The following series are available in this worksheet:
| Series | Description |
| Color | Legend indicating Color indicator for rolling horizon. Values are:
|
| History | Actual historical sales (adjusted). |
| Adjusted History | Unconstrained historical sales. |
| Historical Demand Trend % | A read-only, calculated series (history only) that defines the period-over-period change in actual demand. |
| Marketing Baseline | Baseline forecast for the Marketing stakeholder. This field is read-only. |
| Marketing Override | The quantity override to Marketing Baseline forecast. This field is only editable for the forecast range. |
| Marketing % Change | User-input field representing the percentage change to the baseline marketing forecast. |
| Marketing Forecast | Marketing stakeholder forecast. |
| Marketing Forecast Trend % | A read-only, calculated series (history only) that defines period-over-period change in the Marketing Forecast. |
| Marketing Abs Deviation | Historical absolute difference between the Marketing Forecast and Adjusted History series. |
| Marketing Abs % Error | Historical absolute forecast error between the Marketing Forecast and Adjusted History series. |
| Consensus Forecast | One-number forecast derived during Demand Review (history and forecast) through weighting and/or override. |
| Consensus % Difference to Marketing | The percentage difference between the Consensus Forecast and the Marketing Forecast. |
Use the Sales Forecast worksheet to analyze and update the current sales stakeholder forecast before the demand review meeting. The Sales Forecast worksheet displays a table and graph showing actual sales, forecast accuracy, and forecast values. You can override the baseline forecast by entering either a baseline quantity or percentage.
Note: The Sales Baseline series is not populated automatically during data collections. The administrator must specify a source for this data.
Sales managers can enter forecasts and observe the difference between the Sales Forecast and Consensus Forecast.
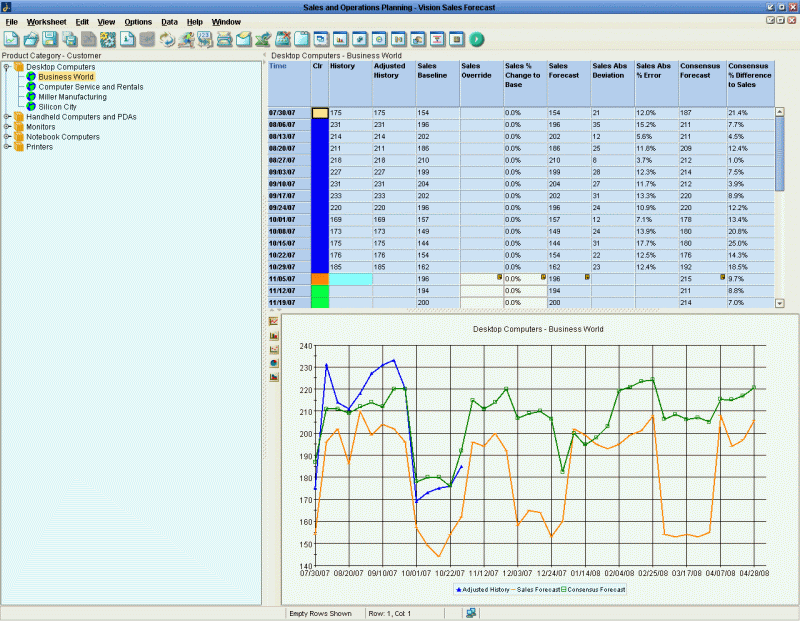
| Accessing this Worksheet | In My Worksheets (in Collaborator Workbench), click Sales Forecast. |
| Levels you can select | Product Category and Customer. |
| Time Aggregation | Weekly. |
The following series are available in this worksheet:
| Series | Description |
| Color | Legend indicating Color indicator for rolling horizon. Values are:
|
| History | Actual historical sales (adjusted). |
| Adjusted History | Unconstrained historical sales. |
| Sales Baseline | Baseline forecast for the sales stakeholder. This field is read-only. |
| Sales Override | The quantity override to the baseline sales forecast. This field is only editable for the forecast range. |
| Sales % Change | User-input field representing the percentage change to the baseline sales forecast. |
| Sales Forecast | Sales stakeholder forecast. |
| Sales Abs Deviation | Historical absolute difference between the Sales Forecast and Adjusted History series. |
| Sales Abs % Error | Historical absolute forecast error between the Sales Forecast and Adjusted History series. |
| Consensus Forecast | One-number forecast derived during Demand Review (history and forecast) through weighting and/or override. |
| Consensus % Difference to Sales | The percentage difference between the Consensus and Sales forecasts. |
Use the Consensus Forecast Product Category worksheet as part of the demand review to assign stakeholder weighting to derive the consensus forecast. Examine gaps between the consensus forecast and budget (or financial plan) by category or product family, shown in currency. By analyzing the forecast error by each stakeholder in the weighting table, you can provide justification as to why one stakeholder forecast might get more weight than another.
Use the Open With right-click menu option to drill-down to the Category and Zone worksheet.
| Accessing this Worksheet | In My Worksheets (in Collaborator Workbench), click Consensus Forecast Product Category. |
| Levels you can select | Product Category |
| Time Aggregation | Weekly |
The following series are available in this worksheet:
| Series | Description |
| Color | Legend indicating Color indicator for rolling horizon. Values are:
|
| History | Actual historical sales (adjusted). |
| Adjusted History | Unconstrained historical sales. |
| Final Forecast | Planner augmented statistical from the demand Analysis worksheets in Demand Management. This series is read-only. |
| Sales Forecast | Sales stakeholder forecast (history and forecast). This series is read-only. |
| Marketing Forecast | Marketing stakeholder forecast (history and forecast). This series is read-only. |
| Consensus Forecast | One-number forecast derived during the Demand Review. This series is read-only. |
| Consensus Forecast Value | One-number forecast derived from the Demand Review. This series is the aggregate of items multiplied by unit prices. Provides ability to compare demand plan with budget in the same unit. This series is read-only. |
| Budget Value | Annual or updated budget (or finance plan), against which a company wants to track its performance. A value for this series is typically imported by a custom (user-defined) import Integration Profile. |
Use the Exception Real Time Sales Tracking worksheet to compare Bookings History (for future dates) with the Consensus forecast. By comparing Bookings with the Consensus Forecast at the Item level early in an S&OP cycle, you can determine if orders are outstripping the forecast.
| Accessing this Worksheet | In My Worksheets (in Collaborator Workbench), click Exception Real Time Sales Tracking. |
| Levels you can select | Item |
| Time Aggregation | Weekly |
The following series are available in this worksheet:
| Series | Description |
| Color | Legend indicating Color indicator for rolling horizon. Values are:
|
| Booking - Book Qty - Book Date | This series includes data for future dates to support forecast tracking. This series color is amber when Booking History is greater than > Consensus Forecast for future dates (not history). |
| Consensus Forecast | One-number forecast derived from the Demand Review. |
| Difference | Difference between Booking History and Consensus Forecast (for future dates only – not history). |
Use the Constrained Forecast Product Category worksheet as part of the supply review to determine how much of the consensus demand can be filled given supply chain constraints. The Supply Review stage of the S&OP process compares the consensus forecast with the constrained forecast.
| Accessing this Worksheet | In My Worksheets (in Collaborator Workbench), click Constrained Forecast Product Category. |
| Levels you can select | Product Category and Organization |
| Time Aggregation | Weekly |
The following series are available in this worksheet:
| Series | Description |
| Color | Legend indicating Color indicator for rolling horizon. Values are:
|
| Consensus Forecast | One-number forecast, derived from the Demand Review’s Consensus Forecasting worksheet. This is a read-only series. |
| Constrained Forecast | Forecast returned from a constrained supply plan. This worksheet provides the ability to compare unconstrained demand with constrained supply. This series is read-only. |
| Unmet Demand | Difference between Consensus forecast and Constrained Forecast. This is a calculated, read-only series. |
| Demand Fill % | Percentage of met demand. This series is calculated as (Constrained Forecast / Consensus Forecast). This series color indicates:
|
| Unmet Revenue | Loss of revenue due to unmet demand. Calculated as (Unmet Demand * Unit Price) for forecast and history. This series is read-only. |
Use the Resource Rough Cut Capacity Plan worksheet to plan future machine and crew capacity by plant and resource.
You can filter the worksheet to only display critical resources. If resource groups are available, then the worksheet displays resource capacity load by plant, resource group, and resource.
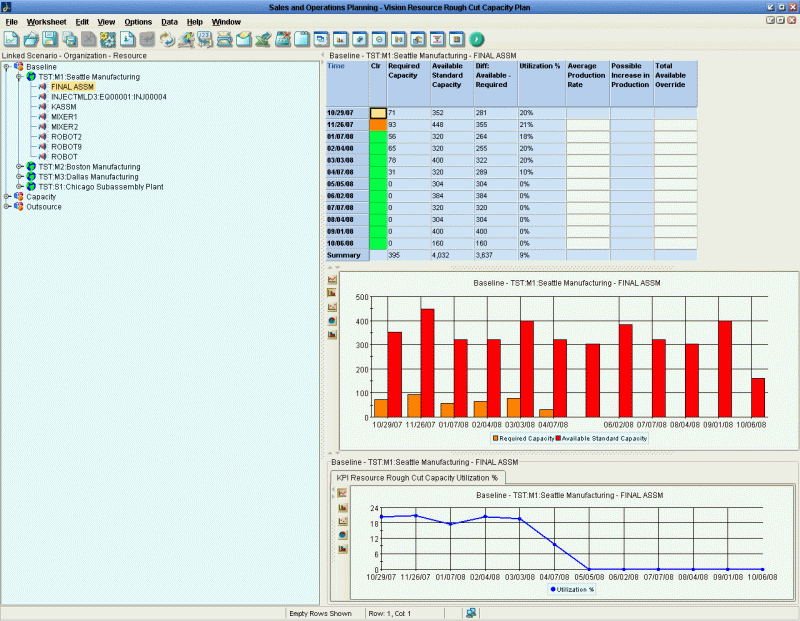
| Accessing this Worksheet | In My Worksheets (in Collaborator Workbench), click Resource Rough Cut Capacity Plan. |
| Levels you can select | Organization and Resource |
| Time Aggregation | Weekly |
The following series are available in this worksheet:
| Series | Description |
| Color | Legend indicating Color indicator for rolling horizon. Values are:
|
| Required Capacity | Amount of resource capacity required to meet demand. This series is read-only. |
| Available Standard Capacity | Regular, planned resource capacity. |
| Available Premium Capacity | Planned overtime for resource capacity. This series is read-only and not shown by default. |
| Total Available Capacity | Total planned resource capacity. This series is calculated as: (Available Standard Capacity + Available Premium Capacity). This series is read-only and not shown by default. |
| Difference: Available and Required | Difference between Total Available Capacity and Required Capacity. This series is read-only. |
| Utilization % | The percentage capacity load on a resource. The series color indicates:
This series is read-only. |
| Average Production Rate | Average rate of production on this resource. This series is used to calculate the Possible Increase in Production (PIP). This is a user-defined series that can be manually maintained in S&OP. |
| Possible Increase in Production | Potential available production increase. This series is calculated as Average Production Rate * (Diff: Available - Required). |
| Total Available Override | User-input override of a resource. Upon review of the capacity load, the S&OP Manager can request a revision to Total Available Capacity. For example, if Utilization % is heavily loaded (e.g. > 90%), then a request to increase Total Available Capacity is appropriate. |
Use the Production Plan Product Category worksheet during the Supply Review process to determine how a business plans to meet demand. This worksheet displays the overall level of planned production and performance to plan by product category, broken down by planning period.
| Accessing this Worksheet | In My Worksheets (in Collaborator Workbench), click Production Plan Product Category. |
| Levels you can select | Product Category |
| Time Aggregation | Weekly |
The following series are available in this worksheet:
| Series | Description |
| Color | Legend indicating Color indicator for rolling horizon. Values are:
|
| Constrained Forecast | Capacitated forecast from a constrained supply plan. This series appears red if the Constrained Forecast is less than the Consensus Forecast. |
| Actual Production | Actual reported production (history only). This series is read-only. |
| Production Plan | Historical and future planned production. |
| Consensus Forecast | One-number forecast derived from Demand Review. This series is read-only. |
| Diff: Prod Plan - Actual | Difference between the Production Plan and Actual Production series. |
| Production Plan Accuracy | Percentage of the Production Plan that has been met. This series is calculated as Actual Production/Historical Production Plan. The series color indicates:
|
| Production Plan Value | Priced production plan. This series is calculated as (Actual Production * Unit Cost) for history and (Production Plan * Unit Cost) for forecast. This series is read-only. |
Use the Inventory Plan Product Category worksheet during the supply review process to determine how a business plans to meet demand based on its planned inventory levels. This worksheet displays overall planned level of inventory and performance to plan by product category, broken down by planning period.
Enter positive or negative quantities in the Projected On-Hand Adjustment series to modify the Projected On-Hand calculation. For example, a business’s on-hand inventory is less than safety stock, because a significant amount of stock was placed on-hold. With some rework (not reflected in production plan), most of this inventory will be saleable in the next planning period. In this case, an S&OP Planner adds inventory to Projected On-Hand Adjustment in next planning period and the Projected On-Hand increases by that amount.
| Accessing this Worksheet | In My Worksheets (in Collaborator Workbench), click Inventory Plan Product Category. |
| Levels you can select | Product Category |
| Time Aggregation | Weekly |
The following series are available in this worksheet:
| Series | Description |
| Color | Legend indicating Color indicator for rolling horizon. Values are:
|
| Actual On-Hand | Actual (for history only) period-ending inventory levels. This series is read-only. |
| Beginning On-Hand Inventory | Beginning inventory level from a supply plan. |
| Projected On-Hand Adjustment | Adjustment field used to modify the Projected On-Hand series. |
| Projected On-Hand | Historical and future planned inventory levels. |
| Safety Stock | Safety stock level (history and forecast). This series is read-only. |
| Periods On-Hand | Projected number of periods’ inventory that are currently on-hand. |
| Safety Periods On-Hand | Projected number of periods’ safety stock that are currently on-hand. |
| Difference: Projected On-Hand and Actual On-Hand | Difference between historical Projected On-Hand and Actual On-Hand for history only. This series is read-only. |
| Inventory Adherence % | Inventory plan attainment percentage. This series is calculated as (Actual On-Hand / (historical) Projected On-Hand). The series color indicates:
This series is read-only. |
| Projected On-Hand Value | Value of the projected on-hand in currency. This series is calculated as (Actual On-Hand * Unit Cost) for history and (Projected On-Hand * Unit Cost) for forecast. |
| Consensus Forecast | One-number consensus forecast derived from Demand Review (history and forecast). This series is read-only. |
| Constrained Forecast | Capacitated forecast from a constrained supply plan. This series appears red if the Constrained Forecast is less than the Consensus Forecast. |
Use the Projected Backlog Product Category worksheet during the Supply Review to work with and calculate the projected backlog. That is, the quantity of booked sales orders that have not yet shipped.
| Accessing this Worksheet | In My Worksheets (in Collaborator Workbench), click Projected Backlog Product Category. |
| Levels you can select | Product Category |
| Time Aggregation | Weekly |
The following series are available in this worksheet:
| Series | Description |
| Color | Legend indicating Color indicator for rolling horizon. Values are:
|
| History | Shipment history by planning period. |
| Shipment Forecast | Statistical forecast based on the shipped date of the requested item. |
| Booking History | Booking History (requested item and booked date). This series color is amber when Booking History > Consensus Forecast for future dates (not history). |
| Booking Forecast | Statistical forecast generated by the Analytical Engine using Booking History series. This series is read-only. |
| Total Backlog | Actual backlog (in history only). |
| Past Due Backlog | Actual past due backlog (in history only). |
| Consensus Forecast | One-number consensus forecast derived from Demand Review (history and forecast). This series is read-only. |
| Difference: Booking Forecast and Shipment Forecast | Difference between Booking Forecast and Shipment Forecast (for future dates only). |
| Projected Backlog | Calculated estimate of sales backlog (history and forecast). This series is calculated as: (Total Backlog (prior period) + Booking Forecast - Shipment Forecast). |
| Projected Backlog Value | Value of projected backlog in currency. |
| Projected Backlog Trend % | Period-over-period percentage change in the Projected Backlog series. This series is read-only. |
Use the Consolidated Plan Product Category worksheet during the supply review to view demand, supply, and inventory levels.
You can enter positive or negative quantities in the Projected On-Hand Adjustment series to modify the Projected On-Hand calculation. It is also possible to use this series for production scenarios. For example, a business’s production adherence has been below expected performance and there is some concern that the production plan is overstated. Entering negative quantities to reduce the inventory for each period based upon the production adherence trend (e.g. 90%) and the Projected On-Hand may more accurately represent the situation.
The Consolidated Plan is also referred to as the S&OP report, since it is typically reviewed during Supply Review and pre-S&OP meetings at the category, segment or product family level.
| Accessing this Worksheet | In My Worksheets (in Collaborator Workbench), click Consolidated Plan Product Category. |
| Levels you can select | Product Category |
| Time Aggregation | Weekly |
The following series are available in this worksheet:
| Series | Description |
| Color | Legend indicating Color indicator for rolling horizon. Values are:
|
| Consensus Forecast | One-number consensus forecast derived from Demand Review (history and forecast). This series is read-only. |
| Constrained Forecast | Capacitated forecast from a constrained supply plan. This series appears red if the Constrained Forecast is less than the Consensus Forecast. |
| Beginning On-Hand Inventory | Beginning inventory levels by planning period for a supply plan. |
| Production Plan | Planned production levels for both history and forecast, including purchase and in-transit orders. This series is read-only. |
| Dependent Demand | Internal demand for items that are both saleable and consumed in other production (for example, service parts). |
| Planned Shipments | Planned shipments out of a location. |
| Inventory Plan | Planned inventory levels imported from Strategic Network Optimization (if used). |
| Projected On-Hand | Projected forecast and history inventory levels. This series appears amber if its value drops below the Safety Stock series. |
| Safety Stock | Safety stock level (history and forecast). |
| Periods On-Hand | Projected number of periods’ inventory that are currently on-hand. |
| Inv Periods On-Hand | Projected number of periods' inventory for planned levels imported from Strategic Network Optimization (if used). |
| Safety Periods On-Hand | Projected number of periods’ safety stock that are currently on-hand. |
Use the Financial Forecast worksheet during the financial review to compare financial targets such as annual plan, budget and financial forecast with the consensus forecast, consensus forecast value and cost of sales. A chart displays the Consensus Forecast Value, Budget Value and Financial Forecast Value. When integrated with Hyperion Planning, this worksheet displays financial forecast and budget data imported from Hyperion.
Quickly identify below-budget plans where Difference: Consensus Forecast Value and Budget Value series < 0 and Difference: Consensus Forecast Value and Financial Forecast < 0.
| Accessing this Worksheet | In My Worksheets (in Collaborator Workbench), click Financial Forecast. |
| Levels you can select | Organization, Product Category |
| Time Aggregation | Quarterly |
The following series are available in this worksheet:
| Series | Description |
| Color | Legend indicating Color indicator for rolling horizon. Values are:
|
| History | Shipment history by planning period. |
| Consensus Forecast | One-number consensus forecast derived from Demand Review (history and forecast). This series is read-only. |
| Consensus Forecast Value | One-number forecast derived from Demand Review history and forecast, representing the aggregate value of items multiplied by unit prices. This series is read-only. |
| Cost of Sales | One-number forecast derived from the demand review and multiplied by unit costs |
| Financial Forecast Value LY | Lagged financial revenue forecast showing prior year's actual revenues. |
| Financial Forecast Value | Financial revenue forecast including actuals to date against which a company wants to track its performance. |
| Diff: Consensus Fcst Value - Financial Fcst Value | Difference between the Consensus Forecast Value and Financial Forecast Value series (for both history and forecast). If this series is less than zero then the consensus plan is below the updated financial forecast. This series is read-only. |
| Budget Value | Top-down Budget revenue forecast against which a company wants to track its performance. This series is amber if > 10% of the Consensus Forecast Value and red if < 75% of the Consensus Forecast Value. |
| Diff: Consensus Fcst Value - Budget Value | Difference between the Consensus Forecast Value and Budget Value series (for both history and forecast). If this series is less than zero then the consensus plan is below budget. This series is read-only. |
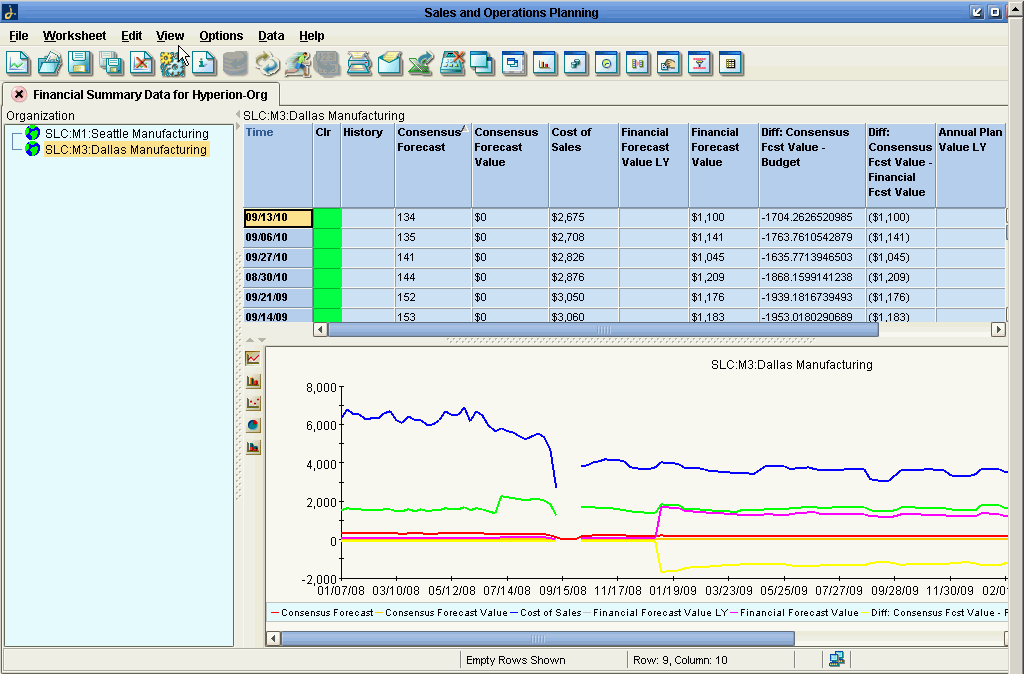
Use the Financial Summary Product Category worksheet during the financial review to compare your operational plan with the budget. This worksheet displays the consensus, constrained forecast, and financial forecast (in currency) by product category and planning period. Review the quarterly financial breakdown using an embedded worksheet. When integrated with Hyperion Planning, this worksheet displays financial forecast and budget amounts imported from Hyperion.
Quickly identify below-budget plans where Difference: Constrained Forecast Value and Budget Value series < 0 and Difference: Consensus Forecast Value and Financial Forecast Value < 0.
| Accessing this Worksheet | In My Worksheets (in Collaborator Workbench), click Financial Summary Product Category. |
| Levels you can select | Product Category |
| Time Aggregation | Weekly |
The following series are available in this worksheet:
| Series | Description |
| Color | Legend indicating Color indicator for rolling horizon. Values are:
|
| Consensus Forecast Value | One-number forecast derived from Demand Review history and forecast, representing the aggregate value of items multiplied by unit prices. This series is read-only. |
| Constrained Forecast Value | Demand amount, in currency, that can be achieved given the plan’s current constraints. This series appears red if Constrained Forecast Value is less then the Consensus Forecast Value series. This series is read-only. |
| Financial Forecast Value | Financial revenue forecast including actuals to date. When integrated with Hyperion, this series contains the Financial Forecast scenario. |
| Diff: Consensus Fcst Value - Financial Forecast Value | The difference between the consensus forecast value and the budget. This series is read-only. |
| Budget Value | The budget forecast, in currency, by which a company wants to track against financially. The series color indicates:
|
| Difference: Constrained Fcst Value - Budget Value | Difference between the Constrained Forecast Value and Budget Value series (for both history and forecast). If this series is less than zero then the plan is below budget. This series is read-only. |
| Absolute Difference: Constrained Fcst Value and Budget Value | Percent difference between the Constrained Forecast Value and Budget Value series (for both history and forecast). |
| Total Revenue | Total plan revenue in currency. This series is calculated as ((History or Constrained Plan) * Unit Price). |
| Total Cost | Cost, in currency, of producing goods sold. This series is calculated as ((History or Constrained Plan) * Unit Cost). |
| Total Profit | Total Revenue – Total Cost. |
| Margin % | Percentage gross profit. This series is calculated as Total Profit / Total Revenue. |
Use the Cumulative Plan Product Category worksheet during the executive review to compare cumulative forecast with the budget.
| Accessing this Worksheet | In My Worksheets (in Collaborator Workbench), click Cumulative Plan Product Category. |
| Levels you can select | Product Category |
| Time Aggregation | Weekly |
The following series are available in this worksheet:
| Series | Description |
| Color | Legend indicating Color indicator for rolling horizon. Values are:
|
| Consensus Forecast | One-number consensus forecast derived from Demand Review history and forecast, representing the aggregate of items multiplied by unit prices. This series is read-only. |
| Constrained Forecast | Forecast returned from a supply plan. This worksheet provides the ability to compare constrained demand with constrained supply. This series is read-only. |
| Consensus Forecast Value | One-number forecast derived from Demand Review history and forecast, representing the aggregate value of items multiplied by unit prices. This series is read-only. |
| Constrained Forecast Value | Demand amount, in currency, that can be achieved given the plan’s current constraints. This series appears red if Constrained Forecast Value is less then the Consensus Forecast Value series. This series is read-only. |
| Budget Value | The budget forecast, in currency, by which a company wants to track against financially. The series color indicates:
|
| Difference: Constrained Fcst Value and Budget Value | Difference between Constrained Forecast Value and Budget Value for both history and forecast. This series is calculated as Difference between Constrained Forecast Value and Budget Value. This series is read-only. |
| Cumulative Constrained Forecast Value | Year-to-date cumulative forecast (in currency) based upon Actuals and Constrained Forecast Value. |
| Cumulative Budget Value | Year-to-date cumulative calculation (in currency) based upon Budget Value series. The series color indicates:
|
| Cumulative Difference: Constrained Fcst Value and Budget Value | Difference between the Constrained Forecast Value and Budget Value series for both history and forecast. This series is read-only. |
| Cumulative Constrained Fcst Value | Total Year Constrained Forecast Value. |
| Cumulative Budget Value | Entire year (52 week) cumulative total for the Budget Value series. The series color indicates:
|
The KPI Dashboards are worksheets that display all S&OP Key Performance Indicators by scenario and category (excluding resources). At the category level, you can drill-down to other worksheets using the Open With menu.
| Accessing this Worksheet | In My Worksheets (in Collaborator Workbench), click KPI Dashboard Product Category. |
| Levels you can select | Product Category |
| Time Aggregation | Weekly |
The following series are available in this worksheet:
| Series | Description |
| Color | Legend indicating Color indicator for rolling horizon. Values are:
|
| Demand Fill % | Percentage of met demand. This series is calculated as (Constrained Forecast / Consensus Forecast). This series color indicates:
|
| Margin % | Percentage gross profit. This series is calculated as Total Profit / Total Revenue. |
| Total Revenue | Total plan revenue in currency. |
| Total Cost | Cost, in currency, of producing goods sold. |
| Total Profit | Total Revenue – Total Cost. |
| Production Plan | Planned production levels for both history and forecast. |
| Projected On-Hand | Historical and projected forecast inventory levels. |
| Safety Stock | Safety stock level (history and forecast). |
| Periods On-Hand | Projected number of periods’ inventory that are currently on-hand. |
| Safety Periods On-Hand | Projected number of periods’ safety stock that are currently on-hand. |
| Projected Backlog | Calculated estimate of sales backlog (history and forecast). |
| Consensus Forecast Value | One-number forecast derived from Demand Review history and forecast, representing the aggregate value of items multiplied by unit prices. This series is read-only. |
| Constrained Forecast Value | Demand amount, in currency, that can be achieved given the plan’s current constraints. This series appears red if Constrained Forecast Value is less then the Consensus Forecast Value series. This series is read-only. |
| Budget Value | The budget forecast, in currency, by which a company wants to track against financially. The series color indicates:
|
| Projected On-Hand Accuracy | Performance to plan metric for inventory levels. |
| Production Plan Accuracy | Percentage of the Production Plan that has been met. This series is calculated as Actual Production/Production Plan. The series color indicates:
|
Use the KPI Scenario Comparison Product Category worksheet to compare S&OP scenarios by key performance indicators. By selecting in a column in the table, such as Demand Fill %, the graph updates to display that KPI.
To update the KPI graph for filtered scenarios, select the appropriate KPI column in the table.
| Accessing this Worksheet | In My Worksheets (in Collaborator Workbench), click KPI Scenario Comparison Product Category. |
| Levels you can select | Product Category |
| Time Aggregation | Weekly |
The following series are available in this worksheet:
| Series | Description |
| Total Revenue | Total plan revenue in currency. |
| Total Cost | Cost, in currency, of producing goods sold. |
| Total Profit | Total Revenue – Total Cost. |
| Demand Fill % | Percentage of met demand. This series is calculated as (Constrained Forecast / Consensus Forecast). This series color indicates:
|
| Production Plan | Planned production levels for both history and forecast. |
| Projected On-Hand | Projected forecast and history inventory levels. This series appears amber if its value drops below the Safety Stock series. |
| Inventory Plan | Historical and projected inventory levels from Strategic Network Optimization (if used). |
| Safety Stock | Safety stock level (history and forecast). |
| Periods On-Hand | Projected number of periods’ inventory that are currently on-hand. |
| Inventory Periods On-Hand | Projected number of periods' inventory for planned levels imported from Strategic Network Optimization (if used). |
| Safety Periods On-Hand | Projected number of periods’ safety stock that are currently on-hand. |
![]()
Copyright © 2010, Oracle and/or its affiliates. All rights reserved.