PMO: Reviewing Past Performance
This chapter covers the following topics:
- Overview
- Evaluating Performance from the Manufacturer's Point of View
- Evaluating Performance from a Retailer's Point of View
- Viewing Actual Averages
- Reference
Overview
This chapter describes how to review past performance of your promotions. It includes the following sections:
To review the performance of past promotions, you generally start in the Planning Environment worksheet. From there, you right-click a promotion and launch any of the relevant PMO worksheets to see data for that promotion.
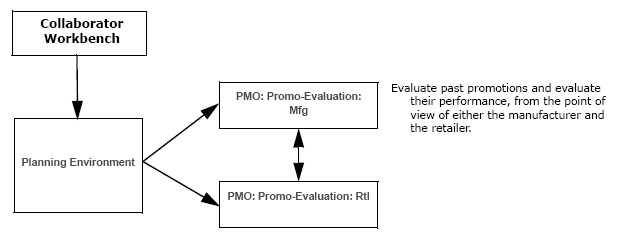
Once a promotion has been planned and executed, it is useful to evaluate its performance against your original plan. The PMO: Promo-Evaluation: Mfg and PMO: Promo-Evaluation: Rtl worksheets provide a detailed post-promotional analysis of each individual promotion (that is, compare forecast to actual performance).
You can view the breakdown of each event with respect to the sales dollars and profit generated for the manufacturer. Depending on the detail of the historical data, a lift decomposition can be provided showing promotional effects such as the following:
-
Cannibalization
-
Pre and post effects, such as pantry loading
This will enable you to see your true "net lift" and revised financial figures in order to properly evaluate the event's performance and uncover its true profitability.
Evaluating Performance from the Manufacturer's Point of View
To evaluate a past promotion from the manufacturer's point of view
-
You typically start in the Planning Environment; see Introduction to the Planning Environment.
-
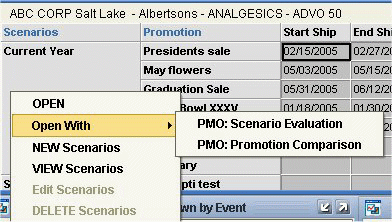
In the Event Planner window, right-click a promotion and click Open With > PMO: Promo-Evaluation: Mfg.
-
If the worksheet does not show data immediately, click Data > Rerun. Or click the Run button.
The system displays the PMO: Promo-Evaluation: Mfg worksheet, filtered to display just the promotion that you right-clicked.
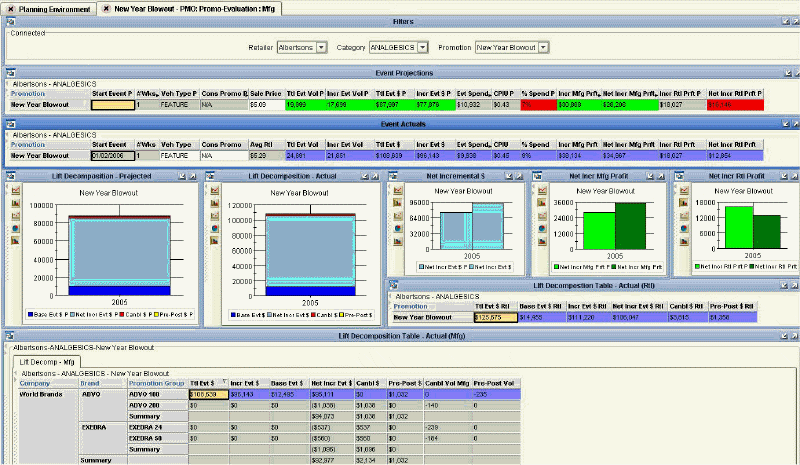
The PMO: Promo-Evaluation: Mfg worksheet includes the following windows.
Event Projections and Event Actuals
These windows compare the projections and the actuals, one directly above the other. Notice that the actuals are displayed mostly in blue.

The Event Projections window displays planned event details, including event start, vehicle type, total planned volume, anticipated manufacturer profit and anticipated spend. For the series in this window, PTP uses colors to indicate deviations between the projections and the actuals:
-
If the actual value is more than 20% different from the projection in the undesirable sense, the projection is shown in red.
-
If the actual value is more than 20% different from the projection in the desirable sense, the projection is shown in green. For example, if the actual profit was 130% of the projected profit, the projection is shown in green.
The Event Actuals window shows the corresponding actuals.
Lift Decomposition Graphs
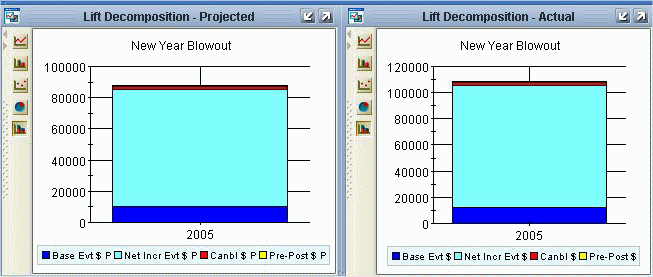
This worksheet also displays lift decomposition graphs showing the projected breakdown and the actual breakdown.
Net Incremental Graphs
The worksheet includes the following graphs to show the net incremental dollars earned for this promotion; each graph compares the projection to the actual. The first graph shows the net incremental dollars. The second and third graphs show the net incremental profit to the manufacturer and retailer, respectively. The net incremental profit is the net additional profit that is earned because of the promotion, in addition to the baseline profit.

Lift Decomposition Table Actual (Manufacturer)
The lift decomposition table shows the specific breakdown into base, incremental, cannibalization, and pre- and post-effect dollars. This table also shows the net incremental volume for the event. This table applies to the manufacturer's point of view.

Possible Actions
In this worksheet, depending on your authorization, you can do the following:
Right-click a promotion and open another worksheet filtered to that promotion. For example, you can open the PMO: Promo-Evaluation: Rtl worksheet to see past performance from the retailer's perspective. See Evaluating Performance from a Retailer's Point of View.
Evaluating Performance from a Retailer's Point of View
To evaluate a past promotion from a retailer's point of view
-
You typically start in the Planning Environment; see Introduction to the Planning Environment.
-
In the Event Planner window, right-click a promotion and click Open With > PMO: Promo-Evaluation: Rtl
-
If the worksheet does not show data immediately, click Data > Rerun. Or click the Run button.
The system displays the PMO: Promo-Evaluation: Rtl worksheet, filtered to display just the promotion that you right-clicked.
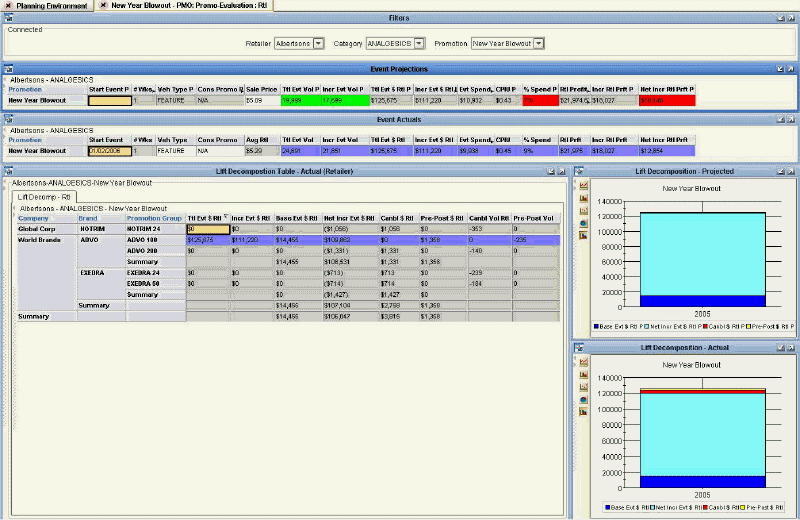
This worksheet contains some of the same areas as the PMO: Promo-Evaluation: Mfg worksheet, but from the retailer's point of view rather than the manufacturer's.
Event Projections and Event Actuals
These windows compare the projections and the actuals, one directly above the other. Notice that the actuals are displayed mostly in blue.

The Event Projections window displays planned event details, including event start, vehicle type, total planned volume, anticipated retailer profit and anticipated spend. For the series in this window, PTP uses colors to indicate deviations between the projections and the actuals:
-
If the actual value is more than 20% different from the projection in the undesirable sense, the projection is shown in red.
-
If the actual value is more than 20% different from the projection in the desirable sense, the projection is shown in green. For example, if the actual profit was 130% of the projected profit, the projection is shown in green.
The Event Actuals window shows the corresponding actuals.
Lift Decomposition Table - Actual (Retailer)
The lift decomposition table shows the specific breakdown into base, incremental, cannibalization, and pre- and post-effect dollars. This table also shows the net incremental volume for the event. This table applies to the retailer's point of view.

Here you can see these useful summaries:
-
Total for promotion group where the promotion was run.
-
Total effect on the brand.
-
Total effect on each manufacturer.
Also notice that this table displays cannibalized and pre- and post-event volume, as well.
Lift Decomposition Graphs
The worksheet includes two graphs to show the projected lift decomposition and the actual lift decomposition. These are displayed vertically in the worksheet for space reasons. For convenience here, the documentation displays them side by side.

Possible Actions
In this worksheet, depending on your authorization, you can do the following:
Right-click a promotion and open another worksheet filtered to that promotion. For example, you can open the PMO: Promo-Evaluation: Mfg worksheet to see past performance from the manufacturer's perspective. See Evaluating Performance from the Manufacturer's Point of View.
Viewing Actual Averages
It is often useful to review actuals and see average information for different kinds of promotions.
Note: Some of this data is highly aggregated, so some tabs may come up slowly.
To view average history
In My Worksheets (in Collaborator Workbench), click PMO: Promotion History.
The worksheet is displayed as follows:

Unlike other worksheets, this worksheet is designed as a series of tabs, each of which displays the same averages, for different contexts. For example, on this tab, you select a retailer and category. The table shows averages for that retailer and category. Each row in the table corresponds to a type of promotion, so you see these averages broken out by promotion type.
Each average is computed on a weekly basis. For example, Avg Ttl Evt Vol is the average total event volume for a single week.
Reference
PMO: Promo-Evaluation: Mfg
This worksheet compares projections to actuals for a past promotion, from the point of view of the manufacturer:
Basics
| Accessing this worksheet | Right-click a promotion and click Open With > PMO: Promo-Evaluation: Mfg. |
| Levels you can select | Retailer, Category, Promotion |
| Levels used in cross tabulation | Promotion |
| Time aggregation | Yearly |
Business Data
| View | Series | Description |
|---|---|---|
| Event Projections | Start Event P | Projected date when promotion starts in stores |
| # Wks P | Projected event length in whole weeks, assuming that each week starts on Monday. | |
| Veh Type P | Projected vehicle type or event type of the promotion | |
| Cons Promo P | Projected consumer overlay. | |
| Sale Price | Sale price per unit at shelf | |
| Ttl Evt Vol P | Projected total volume for the promotion | |
| Incr Evt Vol P | Projected incremental volume due to the promotion | |
| Ttl Evt $ P | Projected total sales during the promotion, for the manufacturer | |
| Incr Evt $ P | Projected incremental sales to the manufacturer due to the event | |
| Evt Spend exS P | Projected total planned buydown and vehicle costs for promotion | |
| CPIU P | Projected event cost per incremental unit sold as a result of the promotion. | |
| % Spend P | Projected event spending, as a percentage of event sales | |
| Incr Mfg Prft P | Projected incremental profit to the manufacturer due to the promotion | |
| Net Incr Mfg Prft P | Projected net incremental profit for the manufacturer | |
| Incr Rtl Prft P | Projected incremental profit to the retailer due to the promotion | |
| Event Projections | Net Incr Rtl Prft P | Projected net incremental profit for the retailer |
| Event Actuals | Start Event | Date when promotion starts in stores |
| # Wks | Event length in whole weeks, assuming that each week starts on Monday. | |
| Veh Type | Vehicle type or event type of the promotion | |
| Cons Promo | Consumer overlay, the deal type as seen by the consumer. | |
| Avg Rtl | Average unit retail price at shelf | |
| Ttl Evt Vol | Total volume for the promotion | |
| Incr Evt Vol | Incremental volume due to the promotion | |
| Ttl Evt $ | Total sales during the promotion, for the manufacturer | |
| Incr Evt $ | Incremental sales to the manufacturer due to the event | |
| Evt Spend exS | Total planned buydown and vehicle costs for promotion | |
| CPIU | Event cost per incremental unit sold as a result of the promotion. | |
| % Spend | Event spending, as a percentage of event sales | |
| Incr Mfg Prft | Incremental profit to the manufacturer due to the promotion | |
| Net Incr Mfg Prft | Net incremental profit for the manufacturer, after considering cannibalization and pre- and post-effects | |
| Incr Rtl Prft | Incremental profit to the retailer due to the promotion | |
| Net Incr Rtl Prft | Net incremental profit for the retailer, after considering cannibalization and pre- and post-effects | |
| Lift Decomposition - Projected | Base Evt $ P | Projected base sales for the manufacturer, during the promotion |
| Net Incr Evt $ P | Projected net revenue to the manufacturer | |
| Canbl $ P | Projected cannibalization dollars for the manufacturer | |
| Pre Post Sales Value P | Projected total sales made before and after the promotion, as a result of the promotion (manufacturer's perspective) | |
| Lift Decomposition - Actual | Base Evt $ | Base sales for the manufacturer, during the promotion |
| Net Incr Evt $ | Net revenue to the manufacturer, after considering cannibalization and pre- and post-effects | |
| Canbl $ | Cannibalization dollars for the manufacturer | |
| Pre Post $ | Total sales made before and after the promotion, as a result of the promotion (manufacturer's perspective) | |
| Net Incremental $ | Net Incr Evt $ P | Projected net revenue to the manufacturer |
| Net Incr Evt $ | Net revenue to the manufacturer, after considering cannibalization and pre- and post-effects | |
| Net Incr Mfg Profit | Net Incr Mfg Prft P | Projected net incremental profit for the manufacturer |
| Net Incr Mfg Prft | Net incremental profit for the manufacturer, after considering cannibalization and pre- and post-effects | |
| Net Incr Rtl Profit | Net Incr Rtl Prft P | Projected net incremental profit for the retailer |
| Net Incr Rtl Prft | Net incremental profit for the retailer, after considering cannibalization and pre- and post-effects | |
| LIft Decompostion Table - Actual (Retailer) | Ttl Evt $ Rtl | Total sales during the promotion, for the retailer |
| Base Evt $ Rtl | Base sales for the retailer, during the promotion | |
| Incr Evt $ Rtl | Incremental sales to the retailer due to the event | |
| Net Incr Evt $ Rtl | Net revenue to the retailer, after considering cannibalization and pre- and post-effects | |
| Canbl $ Rtl | Cannibalization dollars for the retailer | |
| Pre-Post $ Rtl | Total sales made before and after the promotion, as a result of the promotion (retailer's perspective) | |
| Lift Decomposition Table - Actual (Mfg) | Ttl Evt $ | Total sales during the promotion, for the manufacturer |
| Incr Evt $ | Incremental sales to the manufacturer due to the event | |
| Base Evt $ | Base sales for the manufacturer, during the promotion | |
| Net Incr Evt $ | Net revenue to the manufacturer, after considering cannibalization and pre- and post-effects | |
| Canbl $ | Cannibalization dollars for the manufacturer | |
| Pre Post $ | Total sales made before and after the promotion, as a result of the promotion (manufacturer's perspective) | |
| Canbl Vol Mfg | ||
| Pre Post Vol | Total volume before and after the promotion, as a result of the promotion |
PMO: Promo-Evaluation: Rtl
This worksheet compares projections to actuals for a past promotion, from the point of view of the retailer:
Basics
| Accessing this worksheet | Right-click a promotion and click Open With > PMO: Promo-Evaluation: Rtl. |
| Levels you can select | Retailer, Category, Promotion |
| Levels used in cross tabulation | Promotion |
| Time aggregation | Yearly |
Business Data
| View | Series | Description |
|---|---|---|
| Event Projections | Start Event P | Projected date when promotion starts in stores |
| # Wks P | Projected event length in whole weeks, assuming that each week starts on Monday. | |
| Veh Type P | Projected vehicle type or event type of the promotion | |
| Cons Promo P | Projected consumer overlay. | |
| Sale Price | Sale price per unit at shelf | |
| Ttl Evt Vol P | Projected total volume for the promotion | |
| Incr Evt Vol P | Projected incremental volume due to the promotion | |
| Ttl Evt $ Rtl P | Projected total sales during the promotion, for the retailer | |
| Incr Evt $ Rtl P | Projected incremental sales to the retailer due to the event | |
| Evt Spend exS P | Projected total planned buydown and vehicle costs for promotion | |
| CPIU P | Projected event cost per incremental unit sold as a result of the promotion. | |
| % Spend P | Projected event spending, as a percentage of event sales | |
| Rtl Profit P | Projected retailer's profit from the event | |
| Incr Rtl Prft P | Projected incremental profit to the retailer due to the promotion | |
| Net Incr Rtl Prft P | Projected net incremental profit for the retailer | |
| Event Actuals | Start Event | Date when promotion starts in stores |
| # Wks | Event length in whole weeks, assuming that each week starts on Monday. | |
| Veh Type | Vehicle type or event type of the promotion | |
| Cons Promo | Consumer overlay, the deal type as seen by the consumer. | |
| Avg Rtl | Average unit retail price at shelf | |
| Ttl Evt Vol | Total volume for the promotion | |
| Incr Evt Vol | Incremental volume due to the promotion | |
| Ttl Evt $ Rtl | Total sales during the promotion, for the retailer | |
| Incr Evt $ Rtl | Incremental sales to the retailer due to the event | |
| Evt Spend exS | Total planned buydown and vehicle costs for promotion | |
| CPIU | Event cost per incremental unit sold as a result of the promotion. | |
| % Spend | Event spending, as a percentage of event sales | |
| Rtl Prft | Retailer's profit from the event | |
| Incr Rtl Prft | Incremental profit to the retailer due to the promotion | |
| Net Incr Rtl Prft | Net incremental profit for the retailer, after considering cannibalization and pre- and post-effects | |
| Lift Decomposition Table - Actual (Retailer) | Ttl Evt $ Rtl | Total sales during the promotion, for the retailer |
| Incr Evt $ Rtl | Incremental sales to the retailer due to the event | |
| Base Evt $ Rtl | Base sales for the retailer, during the promotion | |
| Net Incr Evt $ Rtl | Net revenue to the retailer, after considering cannibalization and pre- and post-effects | |
| Net Incr Rtl Prft | Net incremental profit for the retailer, after considering cannibalization and pre- and post-effects | |
| Canbl $ Rtl | Cannibalization dollars for the retailer | |
| Pre Post Value Rtl | Total sales made before and after the promotion, as a result of the promotion (retailer's perspective) | |
| Canbl Vol Rtl | ||
| Pre Post Vol | Total volume before and after the promotion, as a result of the promotion | |
| Lift Decomposition - Projected | Base Evt $ Rtl P | Projected base sales for the retailer, during the promotion |
| Net Incr Evt $ Rtl P | Projected net revenue to the retailer | |
| Canbl $ Rtl P | Projected cannibalization dollars for the retailer | |
| Pre Post Value Rtl P | Projected total sales made before and after the promotion, as a result of the promotion (retailer's perspective) | |
| Lift Decomposition - Actual | Base Evt $ Rtl | Base sales for the retailer, during the promotion |
| Net Incr Evt $ Rtl | Net revenue to the retailer, after considering cannibalization and pre- and post-effects | |
| Canbl $ Rtl | Cannibalization dollars for the retailer | |
| Pre Post Value Rtl | Total sales made before and after the promotion, as a result of the promotion (retailer's perspective) |
PMO: Promotion History
This worksheet displays the past averages for each promotion type, in a number of different contexts.
Basics
| Accessing this worksheet | In My Worksheets (in Collaborator Workbench), click PMO: Promotion History. If a worksheet is currently open, click File > Open. Click PMO: Promotion History and then click Open. |
| Levels you can select | Different for each tab of this worksheet. |
| Levels used in cross tabulation | Promotion Type |
| Time aggregation | Yearly |
Business Data
Each view in this worksheet contains the same set of series:
| Series | Description |
|---|---|
| Avg Rtl | Average unit retail price at shelf |
| Avg % Disc | Average percent discount |
| Avg B Dwn | Average buydown for the event |
| Avg Ttl Evt Vol | Average weekly total event volume |
| Avg Incr Evt Vol | Average weekly incremental event volume |
| Avg Lift | Average lift factor for promotion |
| Avg Ttl Evt $ | Average weekly total event dollars for manufacturer |
| Avg Incr Evt $ | Average weekly incremental event dollars for manufacturer |
| Avg Mfg Prft | Average weekly manufacturer profit |
| Avg Incr Mfg Prft | Average weekly incremental manufacturer profit |
| Avg Rtl Prft | Average weekly retailer profit |
| Avg Inc Rtl Prft | Average weekly incremental retailer profit |
| Avg Rtl Margin | Average retailer event margin |
| Avg Evt Spend | Average weekly event spend |
| Avg CPIU | Average cost per incremental unit |
| Avg % Spend | Average percent spend |