PTP Reference

This chapter provides reference information for PTP series, levels, methods, and so on.

This chapter covers the following topics:

Series

This chapter provides reference information for PTP series, levels, methods, and so on.

PTP provides the following series:

Series Table Purpose
# Wks promotion Event length in weeks, assuming that each week starts on Monday. Always rounded up to a whole number of weeks.
# Wks O promotion level Event length in weeks, for optimized promotion.
# Wks P promotion level Projected event length in weeks, as predicted when the promotion was committed.
This series is configured (via a client expression) to have three branches, as follows:
  • If the value of this series is not null, that means Demantra has captured projections for this promotion. So use that value.

  • If the value is null and if the promotion is Committed, use the value # Wks.

  • If the value is null and if the promotion is not Committed, use null.

$ Sales sales_data Annual dollar sales.
$ Sales Proj sales_data Planned sales dollars: actuals (for past dates) plus forecast (for future dates)
% ACV Promoted Promotion Indicates the expected level of promotion participation based on each stores All Commodity Volume
% ACV ANY PROMO sales_data Measures the number of stores that ran any promotion, weighted by store size. Loaded from syndicated data.
% ACV DISP sales_data Measures the number of stores that ran displays, weighted by store size. Loaded from syndicated data.
% ACV FEAT sales_data Measures the number of stores that ran features, weighted by store size. Loaded from syndicated data.
% ACV FEAT&DISPLAY sales_data Measures the number of stores that ran combined features and displays, weighted by store size. Loaded from syndicated data.
% ACV FREQSHOPPER sales_data Measures the number of stores that ran frequent shopper specials, weighted by store size. Loaded from syndicated data.
% ACV TPR sales_data Measures the number of stores that ran temporary price reductions, weighted by store size. Loaded from syndicated data.
% Attained sales_data Percentage of sales quota attained.
% Spend promotion Event spending (vehicle and buydown), as a percentage of event sales. This is a useful metric of the effectiveness of a promotion; the lower this number, the better.
% Spend O promotion Event spending (vehicle and buydown), as a percentage of event sales, for the optimized promotion..
% Spend P promotion Projected event spending (vehicle and buy down), as a percentage of event sales, as predicted when the promotion was committed.
PTP uses colors to indicate deviations between the projections and the actuals:
  • If the actual value is more than 20% different from the projection in the undesirable sense, the projection is shown in red.

  • If the actual value is more than 20% different from the projection in the desirable sense, the projection is shown in green. For example, if the actual profit was 130% of the projected profit, the projection is shown in green.


This series is configured (via a client expression) to have three branches, in the same way as # Wks P.
ActualLY sales_data Actual demand one year ago.
Actuals Base sales_data Base number of units sold in the past, if there had been no promotions. Loaded from syndicated data.
Actuals Incr sales_data Incremental number of units sold in the past, due to promotions. Loaded from syndicated data.
Actuals LY sales_data Actual demand one year ago.
Actuals Ttl sales_data Total number of units sold in the past. This includes both base and incremental volume. Loaded from syndicated data.
Avg % Disc promotion Average percent discount
Avg % Spend promotion Average percent spend
Avg B Dwn promotion Average buy down for the event
Avg CPIU promotion Average cost per incremental unit
Avg Evt Spend promotion Average weekly event spend
Avg Inc Rtl Prft promotion Average weekly incremental retailer profit
Avg Incr Evt $ promotion Average weekly incremental event dollars for manufacturer
Avg Incr Evt Vol promotion Average weekly incremental event volume
Avg Incr Mfg Prft promotion Average weekly incremental manufacturer profit
Avg Lift promotion Average lift factor for promotion
Avg Mfg Prft promotion Average weekly manufacturer profit
Avg Rtl promotion Average unit retail price at shelf. Loaded from syndicated data.
Avg Rtl Margin promotion Average retailer event margin
Avg Rtl Prft promotion Average weekly retailer profit
Avg Rtl sd sales_data Average unit retail price at shelf. Loaded from syndicated data.
Avg Ttl Evt Vol sales_data Average weekly total event volume
Base Evt $ promotion Base sales for the manufacturer, during the promotion.
Base Evt $ O promotion Base sales for the manufacturer, during the optimized promotion.
Base Evt $ P   Projected base sales for the manufacturer, during the promotion.
Base Evt $ Rtl promotion Base sales for the retailer, during the promotion.
Base Evt $ Rtl Act promotion Base event dollars from a retailer's perspective, as determined by syndicated data.
Base Evt $ Rtl P promotion Projected base sales for the retailer, during the promotion.
Base Evt $ Rtl sd sales_data Base event dollars earned by the retailer, as loaded from external systems. By default, this series displays loaded syndicated data.
Base Evt Vol promotion Baseline volume during the promotion.
Base Evt Vol O promotion Baseline volume during the optimized promotion.
BB /UOM Promotion The Bill-Back Accrual Rate for the promotion in the standard Unit of Measure
Base Fcst sales_data Base volume: actuals (for past dates) plus forecast (for future dates).
BDF Auth sales_data Authorized brand development funds, calculated as follows: (base rate + dev rate) * volume + fixed BDF funds
BDF Alloc promotion Allocated brand development funds, based on the percentage set by the planner
BDF Alloc % promotion Read-only series that indicates how much of event spending (apart from slotting costs) is to be allocated to BDF.
Note that BDF Alloc % + MDF Alloc % = 100%
BDF Auth sales_data Authorized brand development fund, calculated as follows:
(base rate + dev rate) * volume + fixed funds
BDF Bal sales_data Remaining (unspent) BDF funds, computed as follows:
BDF Auth - BDF Alloc
BDF Base Rate sales_data Brand Development Fund Base rate -- displayed to the user in the field.
BDF Dev Rate sales_data Brand Development Fund Development rate, entered by corporate HQ.
BDF Fixed Funds sales_data BDF fixed funds
Buydown promotion The sum of the OI/UOM, BB/UOM, and SD/UOM series. Represents the total variable cost per standard Unit of Measure for the promotion.
Buydown $ promotion Buy down spend for the promotion, computed as the buy down allowance multiplied by the volume.
Buydown O promotion Buy down spend for the optimized promotion.
Can Vol Dir    
Canbl $ promotion Cannibalization dollars for the manufacturer. This considers volume that has been cannibalized from other products.
Canbl $ P promotion Projected cannibalization dollars for the manufacturer.
Canbl $ Rtl promotion Cannibalization dollars for the retailer. This considers volume that has been cannibalized from other products and from other stores of this retailer.
Canbl $ Rtl P promotion Projected cannibalization dollars for the retailer.
Canbl Vol Mfg promotion Cannibalization volume for the manufacturer,
Canbl Vol Other promotion Cannibalization of sales at other stores, as a result of the promotion. This is a negative number that indicates how many fewer units were sold. To the retailer, this is an undesirable effect. To the manufacturer, this effect is neutral, because the manufacturer cares only about net volume.
(In Promotion Effectiveness terminology, this is the so-called “store switching” effect.)
Canbl Vol Own promotion Cannibalization of sales of other products by the same manufacturer, as a result of the promotion. This is a negative number that indicates how many fewer units were sold.
(In Promotion Effectiveness terminology, this is the so-called “product switching” effect.)
Canbl Vol Rtl promotion Cannibalization volume for the retailer.
This is the sum of Canbl Vol Other and Canbl Vol Own, both of which are undesirable to the retailer.
COGS promotion Cost of goods, as paid by the manufacturer.
COGS sd sales_data Cost of goods, as paid by the manufacturer.
Cons Promo promotion level Consumer overlay, the deal type as seen by the consumer. For example, buy-1-get-1-free. Controls the number of units in the deal and affects the volume.
Uses the Cons_type lookup table; see “Lookup Tables”.
Cons Promo P promotion level Projected consumer overlay, the deal type as seen by the consumer, as predicted when the promotion was committed.
This is shown in red if the actual deal type was different.
This series is configured (via a client expression) to have three branches, in the same way as # Wks P.
Uses the Cons_type lookup table; see “Lookup Tables”.
CPIU promotion Cost per incremental unit sold as a result of the promotion.
CPIU O promotion Cost per incremental unit sold as a result of the optimized promotion.
CPIU P promotion Projected cost per incremental unit sold as a result of the promotion, as predicted when the promotion was committed.
PTP uses colors to indicate deviations between the projections and the actuals; see “% Spend P”.
This series is configured (via a client expression) to have three branches, in the same way as # Wks P.
Cumulative % vs Plan sales_data Total cumulative actuals, as a fraction of the plan.
Cumulative Actuals sales_data The total actuals (base plus incremental) cumulative to date.
Cumulative Plan sales_data Cumulative frozen planned volume.
End Ship promotion level Date when shipments will end for the event
Evt Spend promotion Total plan spend (by the manufacturer) for the promotion, sum of buy down, vehicle costs, and slotting.
Evt Spend exS promotion Total planned buy down and vehicle costs for promotion.
This spend is split between MDF and BDF funds. To control the split, you set the MDF Alloc % series, which controls how much of the spending is funded by MDF.
Evt Spend exS O promotion Total planned buy down and vehicle costs for optimized promotion.
Evt Spend exS P promotion Projected total planned buy down and vehicle costs for promotion, as predicted when the promotion was committed.
PTP uses colors to indicate deviations between the projections and the actuals; see “% Spend P”.
This series is configured (via a client expression) to have three branches, in the same way as # Wks P.
Evt Status promotion level Status of the promotion as shown to users. For allowed values, see “Promotion Status”.
Also, the color of this series indicates the optimization status of this promotion:
  • Yellow means that the promotion has been optimized.

  • Green means that the promotion has been optimized and accepted, so that the promotion is using the optimization results.

  • White means that the promotion has not been optimized.

Incr Evt $ promotion Incremental sales to the manufacturer due to the promotion.
Incr Evt $ Net promotion Net incremental sales due to the event.
Incr Evt $ O promotion Incremental sales to the manufacturer due to the optimized promotion.
Incr Evt $ P promotion Projected incremental sales to the manufacturer, due to the event, as predicted when the promotion was committed.
PTP uses colors to indicate deviations between the projections and the actuals; see “% Spend P”.
This series is configured (via a client expression) to have three branches, in the same way as # Wks P.
Incr Evt $ Rtl promotion Incremental sales to the retailer due to the promotion.
Incr Evt $ Rtl Act promotion Incremental sales to the retailer due to the promotion, as determined by syndicated data.
Incr Evt $ Rtl sd sales_data Incremental event dollars earned by the retailer, as loaded from external systems. By default, this series displays loaded syndicated data.
Incr Evt Vol promotion Incremental volume due to the promotion.
Incr Evt Vol Act promotion Incremental volume due to the promotion, as determined by syndicated data.
Incr Evt Vol Fut promotion Incremental volume due to the promotion. This series has values for all dates (not just future dates).
Incr Evt Vol O promotion Incremental volume due to the optimized promotion.
Incr Evt Vol P promotion Projected incremental volume due to the promotion, as predicted when the promotion was committed.
PTP uses colors to indicate deviations between the projections and the actuals; see “% Spend P”.
This series is configured (via a client expression) to have three branches, in the same way as # Wks P.
Incr Evt Vol sd sales_data Incremental event volume, as loaded from syndicated data.
Incr Fcst sales_data Incremental volume: actuals and forecast due only to planned promotions.
Incr Mfg Prft promotion Incremental profit to the manufacturer due to the promotion. Event spending and slotting have been deducted.
This profit is in addition to the manufacturer's usual profit and is thus a measure of the value of the promotion.
This series is displayed in red if the value is negative.
Incr Mfg Prft O promotion Incremental profit to the manufacturer due to the optimized promotion.
This series is displayed in red if the value is negative.
Incr Mfg Prft P promotion Projected incremental profit to the manufacturer due to the promotion, as predicted when the promotion was committed.
PTP uses colors to indicate deviations between the projections and the actuals; see “% Spend P”.
This series is configured (via a client expression) to have three branches, in the same way as # Wks P.
Incr Rtl Prft promotion Incremental retailer profit due to the promotion, calculated as the incremental volume multiplied by the retailer's margin.
This profit is in addition to the retailer's usual profit and is thus a measure of the value of the promotion to the retailer.
This series is displayed in red if the value is negative.
Incr Rtl Prft O promotion Incremental retailer profit due to the optimized promotion.
This series is displayed in red if the value is negative.
Incr Rtl Prft P promotion Projected incremental retailer profit due to the promotion, as predicted when the promotion was committed.
PTP uses colors to indicate deviations between the projections and the actuals; see “% Spend P”.
This series is configured (via a client expression) to have three branches, in the same way as # Wks P.
incr_vol_no_unplan promotion Incremental volume caused only by the planned promotions.
Is_self promotion For internal use only. This series indicates whether the promotion and the item-location combination are related:
  • 1 means that the promotion applies to the item-location combination.

  • 0 means that the promotion applies to some other item-location combination.

Lift promotion Lift factor for the promotion. This is the event volume divided by the base volume.
Lift O promotion Lift factor for the optimized promotion.
List Price promotion List price, the price charged by the manufacturer to the retailer.
List Price sd sales_data List price, the price charged by the manufacturer to the retailer.
MDF Auth sales_data Authorized market development fund, computed as follows:
(base rate + dev rate)*volume + fixed funds
MDF Alloc promotion MDF spending that is allocated to fund this event. This is computed as follows:
MDF Alloc % * Evt Spend exS
MDF Alloc % promotion Editable series that controls how much of event spending (apart from slotting costs) is to be allocated to MDF.
Note that BDF Alloc % + MDF Alloc % = 100%
Enter 50 for 50%, for example.
MDF Auth sales_data Authorized market development fund, computed as follows:
(base rate + dev rate) * volume + fixed funds
MDF Bal sales_data Remaining (unspent) MDF funds, computed as follows:
MDF Auth - MDF Alloc
MDF Base Rate sales_data Market development fund base rate.
MDF Dev Rate sales_data Market development fund development rate.
MDF Fixed Funds sales_data MDF fixed funds.
Mfg Prft O promotion Manufacturer's profit from the optimized event.
This series is displayed in red if the value is negative.
Mfg Profit promotion Manufacturer's profit from the event, considering both cost of goods and event spending.
This series is displayed in red if the value is negative.
Mfg Profit Var promotion  
Net Incr Evt $ promotion Net revenue from the manufacturer's perspective. This considers the total manufacturer's lift dollars and subtracts costs due to cannibalization and pre- and post-effects.
Net Incr Evt $ Rtl promotion Net revenue from a retailer's perspective. This considers the total retailer's lift dollars and subtracts costs due to cannibalization (as seen by the retailer) and pre- and post-effects.
Net Incr Rtl Prft promotion Net incremental profit for the retailer, after considering cannibalization and pre- and post-effects.
Optimization Status promotion level Indicates the status of any optimization that was run on this promotion. Used in the color expression of the Evt Status series. Not meant for direct use.
Optimized promotion For internal use only. Indicates if optimization was run on this promotion.
OI UOM Promotion The Off-Invoice Allowance Rate for the promotion in the standard Unit of Measure
Past End Date promotion level Not displayed. This internal series is used to check whether a promotion has already occurred. For any promotion, this series equals one of the following values:
  • 1 means that the promotion is past; specifically, the max_sales_date is equal to or after the end date of the promotion.

  • 0 means that the promotion is in the future.


Other series use this series within client expressions that have the following general logic:
if past end date = 1, use actuals data; otherwise, use forecast data.
Pay Type promotion Type of settlement arranged with the retailer for this promotion. Indicates the payment terms between the manufacturer and the retailer for this promotion.
Plan Vol sales_data Manufacturer's planned revenue.
Pre Post $ promotion Total sales made by the manufacturer before and after the promotion, as a result of the promotion. This is shown as a positive number for graphing purposes. These sales, however, are subtracted from the total sales.
Pre Post $ Rtl promotion Total sales made by the retailer before and after the promotion, as a result of the promotion. This is shown as a positive number for graphing purposes. These sales, however, are subtracted from the total sales.
Pre Post Vol promotion Total volume before and after the promotion, as a result of the promotion. This is generally a negative number.
Promotion Tactic Promotion The Promotional Tactic or Vehicle.
The Promotional Tactic or Vehicle. Promotion Level Indicates the state of promotion integration between Demantra PTP and Siebel TPM. Used to determine whether or not the promotion is editable.
Rtl Prft promotion Retailer's profit from the event.
This series is displayed in red if the value is negative.
Rtl Prft O promotion Retailer's profit from the optimized event.
This series is displayed in red if the value is negative.
Sale Price promotion Sale price per unit at shelf.
Sale Price O promotion level Sale price per unit at shelf, for the optimized promotion.
Sales Quota sales_data Sales quota (revenue).
Sales Var promotion  
SD UOM Promotion The Scan-Down Allowance Rate for the promotion in the standard Unit of Measure
Shelf Price promotion Everyday price to the consumer.
In contrast to the Shelf Price sd series, this series is stored in promotion_data for better performance.
Shelf Price sd sales_data The everyday price to the consumer, as loaded from external systems. This series is stored in sales_data and is mainly for internal use; see Shelf Price.
Shipments sales_data Number of units shipped from the manufacturer to the ship-to destination of the retailer.
Slot Auth sales_data Authorized slotting funds.
Slot Bal sales_data Remaining slotting budget.
Start Event promotion Date when promotion starts in stores.
Start Event O promotion level Date when optimized promotion starts in stores.
Start Event P promotion level Projected date when promotion starts in stores, as predicted when the promotion was committed.
This series is configured (via a client expression) to have three branches, in the same way as # Wks P.
Start Ship promotion level Date when the product will start to be shipped
Status promotion level For internal use only.
Ttl Evt $ promotion Total revenue during the event, for the manufacturer.
Ttl Evt $ O promotion Total revenue during the optimized event, for the manufacturer.
Ttl Evt $ P promotion Projected total revenue during the event, for the manufacturer, as predicted when the promotion was committed.
PTP uses colors to indicate deviations between the projections and the actuals; see “% Spend P”.
This series is configured (via a client expression) to have three branches, in the same way as # Wks P.
Ttl Evt $ Rtl promotion Total revenue during the event, for the retailer.
Ttl Evt Vol promotion Total volume for the promotion.
Ttl Evt Vol O promotion Total volume for the optimized promotion.
Ttl Evt Vol P promotion Projected total event volume, as predicted when the promotion was committed.
PTP uses colors to indicate deviations between the projections and the actuals; see “% Spend P”.
This series is configured (via a client expression) to have three branches, in the same way as # Wks P.
Ttl Fcst sales_data Total volume: base forecast plus incremental forecast.
Ttl Fund Auth promotion Total authorized spending, including MDF, BDF, and slotting.
Ttl Fund Bal promotion Remainder of total authorized spending, after accounting for spending.
Units promotion level Number of units associated with the consumer deal (Cons Promo). Usually this is 1. This is 2 in the case of 2-for-1 deals.
Unmatched $ sales_data Trade spend not yet matched to an event.
Uplift promotion_data  
Veh Cost promotion Vehicle cost for the promotion.
Veh Cost O promotion Vehicle cost for the optimized promotion.
Veh Type O promotion level The vehicle type or event type of the optimized promotion.
Veh Type P promotion level Projected vehicle type of the promotion, as predicted when the promotion was committed.
This series is configured (via a client expression) to have three branches, in the same way as # Wks P.
Vehicle Cost DISPLAY promotion Vehicle cost for event of type DISPLAY.
Vehicle Cost F&D promotion Vehicle cost for event of type F&D.
Vehicle Cost F. SHOPPER promotion Vehicle cost for event of type F. SHOPPER.
Vehicle Cost FEATURE promotion Vehicle cost for event of type FEATURE.
Vehicle Cost NATIONAL TV promotion Vehicle cost for event of type NATIONAL TV.
Vehicle Cost TPR promotion Vehicle cost for event of type TPR.
Volume Base sales_data Base volume aggregated over sales data.
Volume Base Ttl sales_data Base volume series used by many other series. This series gives the base volume, if no promotions were run or are run. It checks the value of Past End Date and uses the following logic.
If past end date = 1, use actuals data; otherwise, use forecast data.
Volume Incr Ttl promotion_data Incremental volume series used by many other series. This series gives the incremental volume due to promotions. It checks the value of Past End Date and uses the following logic.
If past end date = 1, use actuals data; otherwise, use forecast data.

Item Levels

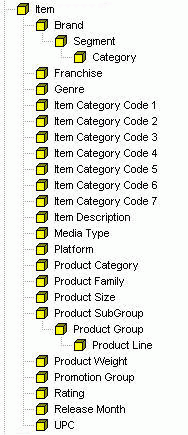
PTP uses the following item levels:
the picture is described in the document text

The most commonly used item level is Promotion Group. Some PTP worksheets use Brand or Segment. The other levels are provided for convenience, so that you can create worksheets aggregated at those levels.

The Manufacturer level is populated via the APPPROC_MAINTAIN_TERR_RETAILER procedure. The rest are created by ep_load_main.

Location Levels

PTP uses a variety of different location levels.

the picture is described in the document text

The most commonly used location levels is PTP are Territory and Retailer. The Retailer has a set of attributes, described in the following subsection. The other levels are provided for convenience, so that you can create worksheets aggregated at those levels.

The Territory-Retailer level is used by the Analytical Engine. This level is populated via the APPPROC_MAINTAIN_TERR_RETAILER procedure. The rest are created by ep_load_main.

Internally, the lowest location level is a combination of Ship To and Territory and is created automatically by Demantra.

Retailer

This level contains the retailers. It is expected that retailers will be loaded rather than created within PTP. However, users can and should modify attributes of these retailers:

Attribute Purpose
Account Classification Drop-down list with the following choices:
  • Growth

  • Holding

  • Declining

Avg Everyday Selling Margin Average selling margin, disregarding promotions.
Class_of_Trade Drop-down list with the following choices:
  • Food

  • Drug

  • Mass

  • C-Store

  • Military

Event Threshold: Display Only Minimum number of units that should be sold for an event of type Display.
Event Threshold: F Shopper Minimum number of units that should be sold for an event of type F. Shopper.
Event Threshold: Feat Display Minimum number of units that should be sold for an event of type F&D.
Event Threshold: Feature Only Minimum number of units that should be sold for an event of type Feature.
Event Threshold: Natl TV Minimum number of units that should be sold for an event of type National TV.
Event Threshold: TPR Only Minimum number of units that should be sold for an event of type TPR.
Key Competitors A text field where you can list the key competitors of this retailer.
Min Man Event Margin  
Min Rtl Event Margin Minimum margin that this retailer must make on an event. Promotion Optimization considers only events that provide at least this much margin.
Name Name of the retailer.
Number of Active Stores Number of active stores that this retailer operates.
Ship Timing: Display Stock #Wk Specifies how much earlier this retailer likes to receive any items to be placed in display stock. Specify as the number of weeks needed before the start of the promotion.
Ship Timing: Displays # Wks Specifies how much earlier this retailer likes to receive any displays to be placed in the stores. Specify as the number of weeks needed before the start of the promotion.
Ship Timing: Reg Open Stock Wks Specifies how much earlier this retailer likes to receive any items to be placed in open stock. Specify as the number of weeks needed before the start of the promotion.
Slotting Fees per item Amount that this retailer charges to place the items on the shelf, per item.
Use Default Profile Controls whether to update this profile by getting the default values for all these attributes.
Veh Costs: Display Only Default cost for an event of type Display for this retailer.
Veh Costs: F Shopper Default cost for an event of type F. Shopper for this retailer.
Veh Costs: Feature & Display Default cost for an event of type F&D for this retailer.
Veh Costs: Feature Only Default cost for an event of type Feature for this retailer.
Veh Costs: Natl TV Default cost for an event of type National TV for this retailer.
Veh Costs: TPR Only Default cost for an event of type TPR for this retailer.

Corporate

This level allows retailers to be defined at both the corporate name level and the regional level.

Promotion Levels

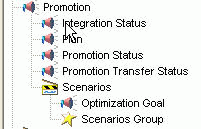
PTP uses a variety of different promotion levels.
the picture is described in the document text

The following sections provide details on these levels:

Plan

This level stores a set of promotions for a particular account over a given time period.

Attribute When Displayed Purpose
Account - The account on which these promotions will be run.

Promotion Transfer Status

This level facilitates the transferring of promotions to Siebel. It stores the lock status, which ensures that data doesn't become out of sync during the transfer.

Promotion

This level contains the promotions. Users can add, modify, or remove promotions as needed. The following table lists all the attributes of promotions and indicates when these attributes are displayed:

Attribute When Displayed Purpose
Approval - -
Buydown - Buy down allowance for this promotion. May be used for Off Invoice or Bill back purposes.
Cons Promo When creating or editing Consumer overlay. Indirectly specifies the number of units included in the deal to the customer.
Uses the Cons_type lookup table; see “Lookup Tables”.
End Ship When creating or editing -
Event Status Not used. Ignore this attribute. It is not used.
Fixed Buydown When optimizing Specifies whether Promotion Optimization should use the buydown that you have already entered or calculate an optimal buydown for this promotion.
Uses a lookup table that should not be edited.
Max Budget When optimizing Maximum allowed budget for this promotion.
Max Buydown When optimizing Maximum allowed buydown for this promotion. If Promotion Optimization calculates an optimal buydown, the buydown will not exceed this value.
method_status - Uses a lookup table that should not be edited.
Min Rtl Margin Override When optimizing Minimum margin that the retailer must make on this promotion. By default, Promotion Optimization considers the retailer's default required minimum margin. Use this parameter to override that value, if needed.
Use a value greater than 0 and less than or equal to 1.
Name When creating or editing Name of the promotion. Does not have to be unique.
Optimal Budget - -
Optimal Lift - -
Optimal Price Decrease - -
Optimal Profit - -
Optimal Revenue - -
Optimal Type - Indicates the optimal vehicle type for this promotion. This attribute is a lookup attribute that uses the Promotion Type level.
Optimization Goal When optimizing Select one of the following goals for this promotion:
  • Maximize Revenue

  • Maximize Profit

  • Maximize Units


This attribute is a lookup attribute that uses the Optimization Goal level.
Optimization Range End When optimizing By default, Promotion Optimization assumes that you want the optimized promotion to fall within the span of time of the original promotion. If you want Promotion Optimization to search for a better time for this promotion, use these attributes to specify the range of time for optimization to consider.
Optimization Range Start When optimizing
Optimization Status Never displayed Status of the optimization process on this promotion. Uses a lookup table that should not be edited.
Population When creating or editing Combinations where this promotion will run and dates of the promotion.
Promotion Status Not used. Ignore this attribute. It is not used.
Promotion Type1 Never displayed Current vehicle type for this promotion. This attribute is a lookup attribute that uses the Promotion Type level.
Return on Investment (ROI) - -
Scenarios When creating or editing Scenario to which this promotion belongs. This attribute is a lookup attribute that uses the Scenarios level.
Start Ship When creating or editing -
Status Never displayed; not used directly -
Vehicle Type When creating or editing Type of the promotion. This attribute is a lookup attribute that uses the Promotion Type level.

Promotion Status

This level contains the PTP promotion statuses.

Promotion Type

This level contains the promotion types, by default, the following set:

Type Details
Display Display Only
F. Shopper F Shopper
F&D Feature and Display
Feature Feature Only
National TV National TV advertising. If this does not apply, you can use this type as a placeholder for another type, as needed.
TPR Temporary price reduction only.

Consultants can add other types, but changes are needed in multiple places if this is done. The documentation for this is currently out of scope.

Scenarios

This level contains the scenarios, which have the following purposes:

Optimization Goal

This level contains the predefined optimization goals. Do not make changes to this level.

Plans

This level is not used in PTP worksheets.

Lookup Tables

This section lists the configurable lookup tables used by promotion levels and series.

Note: You can change the contents of these table, but you should not change their structure.

Cons_type

This table lists types of consumer overlays and for each type, indicates the number of units included in the deal to the consumer. This lookup table is used by the Cons Promo attribute, the Cons Promo series, and the Cons Promo P series. This table has the following structure:

Field Required? Data type Purpose
CONS_TYPE_ID required NUMBER(10) Unique ID for Oracle internal use.
CONS_TYPE_CODE   VARCHAR2(50) Code for the consumer overlay.
CONS_TYPE_DESC   VARCHAR2(50) Name of the consumer overlay.
IS_FICTIVE   NUMBER(1) Leave these null.
SELF_SHAPE_INDICATOR   NUMBER(5)
IG_SHAPE_INDICATOR   NUMBER(5)
OMIT_SEASONAL   NUMBER(5)
FICTIVE_CHILD   NUMBER(10)
LAST_UPDATE_DATE   DATE

Pay_Type_lookup

This table controls the drop-down choices in the Pay Type series. This table has the following structure:

Field Required? Data type Purpose
PAY_TYPE_ID required NUMBER(10) Unique ID for Oracle internal use.
PAY_TYPE_CODE   VARCHAR2(50) Code for the consumer overlay.
PAY_TYPE_DESC   VARCHAR2(50) Name of the consumer overlay.
IS_FICTIVE   NUMBER(1) Leave these null.
SELF_SHAPE_INDICATOR   NUMBER(5)
IG_SHAPE_INDICATOR   NUMBER(5)
OMIT_SEASONAL   NUMBER(5)
FICTIVE_CHILD   NUMBER(10)
LAST_UPDATE_DATE   DATE

Methods

PTP uses the following custom methods.

Optimize Promotion

This method uses the Call Promotion Optimizer predefined workflow. The Call Promotion Optimizer workflow consists of three steps in addition to the edit member step:

  1. The first step initializes the necessary fields in the database. This step collects arguments, passes them to the APPPROC_PRE_OPTIMIZATION stored procedure, and then runs that stored procedure.

    Caution: You should not change this step.

  2. The second step calls the optimizer. This is a custom step that collects arguments and calls the OPL class file, which runs the optimization.

    Note: You must configure this for your specific installation, as described in Configuring the Optimization Step in the Demantra Implementation guide.

  3. The final step cleans up the necessary fields in the database, collects arguments, passes them to the APPPROC_POST_OPTIMIZATION stored procedure, and then runs that stored procedure.

    Caution: You should not change this step.

If the user uses this method, Demantra creates a virtual promotion that the user can display along with the current promotion (in the PMO: Optimization Comparison worksheet).

Accept Optimization

This method saves the optimized promotion, overwriting the previous details. Specifically, it copies data from the optimized series to the corresponding standard series, for the selected promotion. For example, it copies data from # Wks O to # Wks.

This method uses the AcceptOptimization predefined workflow. This workflow consists of one step (which calls the APPPROC_ACCEPT_OPTIMIZATION procedure).

Procedures

PTP uses the following custom procedures.

Procedure Purpose
APPPROC_ACCEPT_OPTIMIZATION Used by Promotion Optimization.
APPPROC_BLE_ACTUALS_LY Updates the Actuals_LY series.
APPPROC_BLE_VOLUME_BASE_FUTURE Updates sales_data. vol_base_ttl, for all dates.
For dates in the future, this procedure sets the field equal to the latest base forecast from the engine.
For dates in the past, this procedure sets the field equal to the value of sales_data. sdata5, the syndicated base volume.
APPPROC_BLE_VOLUME_BASE_HIST Updates sales_data .vol_base_ttl, for dates in the past. This procedure sets the field equal to the value of sales_data. sdata5, the syndicated base volume.
APPPROC_CLEAR_DATA Clears the sales_data, mdp_matrix, promotion, and promotion_data tables.
APPPROC_COPY_DEF_RETAILER Iterates through all retailers, finds any that have been marked as using the default profile, and copies the default attribute values to each of those retailers.
APPPROC_DROP_TEMPS Drops the temporary tables.
APPPROC_MAINTAIN_TERR_RETAILER Populates the Manufacturer level and the Territory-Retailer level.
APPPROC_POST_DATA_LOAD This procedure completes the last steps needed during data loading:
  • Updates the LAST_DATE_BACKUP parameter in the INIT_PARAMS_0 table to equal the last sales date in the system.

  • Runs the APPPROC_COPY_DEF_RETAILER procedure.

  • Runs the APPPROC_MAINTAIN_TERR_RETAILER procedure.

  • Updates the promotion_data table with values loaded into sales_data.

  • Updates sales_data .vol_base_ttl according to the sdata5 column that was loaded. This initiates the APPTRIG_VOLUME_BASE_UPDATE_SD trigger; see Triggers.

APPPROC_POST_OPTIMIZATION Used by Promotion Optimization.
APPPROC_PRE_OPTIMIZATION Used by Promotion Optimization.

Instead of running procedures directly, use the workflows provided by PTP.

See Workflows.

Triggers

PTP uses the following custom triggers.

Trigger When activated Action
APPTRIG_INSERT_PROMOTION When inserting promotion Gets list price, shelf price, and COGs from sales_data and copies them to promotion_data.
APPTRIG_INSERT_PROMOTION_PAST When inserting promotion in the past Updates the following series for this promotion:
  • Avg Rtl sd

  • Incr Evt Vol Act

  • Base Evt $ Rtl Act

  • Incr Evt $ Rtl Act

APPTRIG_SHELF_PRICE_UDPATE_SD When updating shelf price on sales_data. Copies that data into promotion_data.
APPTRIG_VOLUME_BASE_UPDATE_PD When inserting a promotion Gets sales_data.volume_base_ttl and updates the field by the same name in promotion_data.
APPTRIG_VOLUME_BASE_UPDATE_SD When updating volume_base_ttl in sales_data. Copies that data into promotion_data

Workflows

PTP uses the following workflows:

Workflow When to run Description
AcceptOptimization Do not run directly. Used by the Accept Optimization method.
Call Promotion Optimizer Do not run directly. Used by the Optimize Promotion method.
Note: Includes installation-dependent details and must be configured for each installation.
CopyRetailerDefaults Run this each time you edit a retailer to use the default profile and each time you edit the retailer defaults in the Business Modeler. Executes the APPPROC_COPY_DEF_RETAILER procedure.
Create Member Do not run directly. Used internally when a user creates a member of a level.
Delete Member Do not run directly. Used internally when a user deletes a member of a level.
DoNothing Do not use. Do not use.
Edit Member Do not run directly. Used internally when a user edits a member of a level.
Import Promo Data Not required. Provided for you to use if you want to load data manually.
ImportPromotionLevels Not required. Provided for you to use if you want to load data manually.
Paste Member Do not run directly. Used internally when a user pastes a member of a level.
Run App Proc After Batch Engine Run this after you run the Analytical Engine. Runs the following required procedures:
  • APPPROC_BLE_ACTUALS_LY

  • APPPROC_BLE_VOLUME_BASE_FUTURE

Run Drop Temps Run this daily. Executes the APPPROC_DROP_TEMPS procedure.
Run Engine and BLE   Do not use.
runprocsteps Do not run directly. Used by the Optimize Promotion method.

Engine Configuration

This section describes the basic engine configuration in PTP.

Forecast Tree

The PTP forecast tree is as follows:

Forecast level number Levels used in this forecast level Notes
Item level Location level
1 Lowest level Lowest level  
2 Item Site This is also the lowest promotional level (LPL).
3 Item Retailer This is also the influence group level (IGL).
4 Promotion Group Retailer This is also the influence range level (IRL).
5 Promotion Group Corporate  
6 Highest Highest  

Parameter Settings

In PTP, the following parameter values are set for the Analytical Engine:

Setting Value Notes Needed for
COMPETITION_ITEM 352 This is the manufacturer level. Analytical Engine
COMPETITION_LOCATION 237 This setting refers to the Competition_Location group table, which has only one row. This has the same effect as setting COMPETITION_LOCATION equal to the Retailer level.  
CalcOptimizationInput yes   Promotion Optimization
StartAverage 0    
AverageHorizon 52 Specify the length of time, in base time units, to use in calculating the average baseline forecast. Typically one year or half a year is suitable.  
BottomCoefficientLevel 2    
TopCoefficientLevel 3    

Engine Models

Only the linear models work with Promotion Optimization. Therefore, in the model table in the database, the following models are marked as IS_OPTIMIZATION=1: R-REGR, M-MRIDGE, and C-CMREG.

Additional Checklist Before Running Optimization

  1. The application server currently must be a WINDOWS machine in order to run optimization.

  2. The application server must have Oracle or SQL Server clients installed.

  3. TNS entry in TNSNames.ora where name matches the DBNAME entry in the APPSERVER.PROPERTIES file which can be reached in <ROOT> Collaborator\demantra
    the picture is described in the document text

  4. From Business Modeler, navigate to system parameters.

    Parameters > System Parameters

    In the system tab, check that the parameter AppServerLocation contains the correct path where the application is installed. If there is a mismatch, enter the correct path into the parameter application_root

    Example setting: F:\Program Files\Integration 7.1.1 \Collaborator\demantra

  5. Navigate on the desktop to My Computer. Right click, and then choose Properties from the right-click menu.

  6. Choose the Advanced tab, and then click Environmental Variables.

    Verify that the path variable contains path to <ROOT>\Collaborator\demantra\optimization\dll.