Demand Management Overview
This chapter covers the following topics:
- Oracle Demantra Demand Management Overview
- Product Family Forecasting Overview
- Configure to Order Overview
- Service Parts Planning and Service Parts Forecasting Overview
Oracle Demantra Demand Management Overview
Oracle Demand Management is a configurable web-based product to help your organization perform demand planning and forecasting. Demand Management is built around collaboration, and takes advantage of work flows to automate the Demand Management process.
The process of demand planning generally consists of studying historical sales data and trying to predict future demand as closely as possible. The goal is to achieve an appropriate balance between meeting customer demands as quickly as possible and making or buying only as much of each product as required.
A demand plan is based on a forecast, which in turn is a prediction of tendencies in the supply chain over a period of time, influenced by seasonal and other predictable factors. The result of a forecast is a projected curve that has been smoothed to show tendencies and deemphasize the exceptional variations.
In general, the demand plan and forecast are used in downstream operations such as production planning. Depending on how your system has been configured, it either exports such data automatically or contains reports that you use for that purpose.
The Demand Management Process
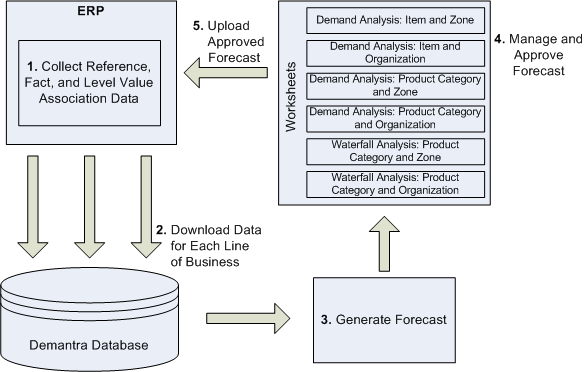
Demand Management is an iterative process, that typically takes place in the weekly, biweekly or monthly cycles. This process includes:
-
Collecting the appropriate data from an ERP or other system of record.
-
Downloading the appropriate data to the Demantra database.
-
Generating a forecast and then sending a notification to demand analysts.
-
Demand analysts work with the forecast and making any corrections or adjustments.
-
Demand manager or designated forecast owner approves the forecast.
-
The approved forecast is uploaded to your ERP system.
Collect and Download Data
Most businesses have a regularly scheduled Demand Management process that can be monthly, weekly or, in a few cases, daily. During this period, data from various sources are loaded into the Demand Management system for use in forecasting future demand. The source systems can be an ERP system, legacy system or another Oracle APS (Advanced Planning Suite) module such as Advanced Supply Chain Planning, Inventory Optimization, Global Order Promising or Collaborative Planning.
Once loaded, the administrator ensures that planners have access to the data they require. For example, each planner may be responsible for planning the demand for a particular region or product line. Although planners can view data for all lines of business they are given access to, they are only able to modify data for which they have permissions.
Generate the Forecast and Send Notifications
After the download is complete, the administrator (or an automated process) runs the forecast and resets the approval series. After successful calculation of the forecast, the appropriate users are automatically notified that their forecast is available for review. The forecast, forecast accuracy measures and Demand Priority information are available in predefined worksheets for analysis for all users.
Note: In the event of an unsuccessful download or forecast generation, the Administrator can check the batch log for information on problems that arose during processing and forecast generation.
Manage and Approve the Forecast
The approval process is built around two user-types: the Demand Administrator and Demand Analyst. During implementation, Demand Administrators configure the approval process by specifying a reviewer who has final approval of the forecast. Each group of Demand Analysts should have one final approver.
At the start of the approval process, a notification appears in the My Tasks window informing Demand Analysts that a forecast is available for the current planning cycle. Analysts can review their planning data (including the forecast) using one of the pre-seeded worksheets:
-
Waterfall Analysis: Product Category and Zone
-
Waterfall Analysis: Product Category and Organization
-
Demand Analysis: Product Category and Organization
-
Demand Analysis: Product Category and Zone
-
Demand Analysis: Item and Organization
-
Demand Analysis: Item and Zone
Using the graphs and reports found in these worksheets, analysts view and adjust their forecast data. They analyze history to understand shipped, booked and customer orders, inventory levels and other factors. For example, an analyst may consider any upcoming events or promotions that may impact the demand as well as their customer and sales forecast.
Based on this information, analysts modify the forecast and can run a simulation that repopulates the worksheet with the changed data. Once their analysis and modifications are complete, the analyst saves the changes and selects Done for the relevant notification in the Collaborator Workbench’s My Tasks view, which notifies the demand plan manager or administrator.
These changes to the forecast are available for review by an approver. One or more people can do the review. For example, if the analysts are responsible for demand by region, a regional manager may approve or change the analyst’s changes. Or, if an analyst’s responsibility is broken down into product lines, then the product line manager may have final approval. Demand Management’s pre-seeded approval process is setup for one level of review. Additional levels of review require changes to the pre-seeded Approval workflow.
The final approver can lock the forecast at any time by checking the Final Approval column. After review, the final approver accepts the forecast by selecting the Done button in My Tasks for the forecast notification.
Upload the Forecast
Once approved, the Demand Administrator uploads the consolidated forecast for use in other systems (for example, Oracle Advanced Supply Chain Planning) where the unconstrained demand is used to drive the constrained demand.
Demand Management for Multiple Lines of Business
An organization’s data is typically divided into several Lines of Business (LOB). For example, a printer manufacturer may have Printers and Copiers lines of business. Different lines of business generally have different demand management processes. The difference in the planning process may be due to the following reasons:
-
Each line of business may have different planning cycles (such as weekly or monthly) and may use different calendars (such as manufacturing or fiscal).
-
Each line of business may have different business requirements, such as model-options forecasting, product family level forecasting, service parts forecasting, and so on.
-
The lines of business may be in different geographical locations or may otherwise have varying business practices.
-
Each line of business may have its separate group of planners who need to look at the demand data pertaining to their respective line of business only.
-
A line of business demand plan refers to limiting the scope of a demand plan to include only those level values (such as items, organizations, customers’ ship to locations, sales representatives) that pertain to the line of business.
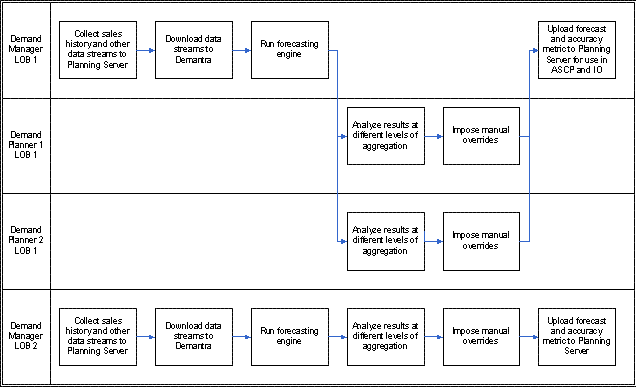
When an organization has multiple LOBs, the data is often assigned to specific users (for example based on product line or region), and the analyst is responsible for determining the demand for that slice of data. When each analyst has reviewed and approved his or her forecast, a master approver is notified and approves the forecast as a whole.
The following diagram illustrates the demand management process with multiple lines of business:
Product Family Forecasting Overview
A product family bill of material is typically made up of a product family item at the top level and items (children) one level down
This is a sample product family bill of material,
Automobiles
. Sedan
. Coupe
. Sports
For product family planning, all the family members of a product family must:
-
Be either planned individually or as product family.
-
Have the same value for item attribute Forecast Control: Either None or Consume & Derive
-
Be standard items
If the item level does not have enough data to produce an accurate forecast, Oracle Demantra Demand Management forecasts at the Product Family level and allocates the product family forecast down to the children.
Configure to Order Overview
Configure to order products are configurations of components depending on the customer's preference. In most cases, this includes a selected base product (the model) and multiple optional (the options) and mandatory components.
Configure to order works on the principle of dependent demand forecasting. Dependent Demand Forecasting is the capability to forecast demand for partially or fully dependent products whose demand depends wholly or partially on the demand for another product. Some of the typical questions that are addressed by dependent demand forecasting are:
-
To an automobile manufacturer: How many alloy wheels or V6 engines would be sold?
-
To the personal computer manufacturer: How many total hard disks would need to be manufactured? Of those, how many would sell as part of a new personal computer and how many would sell individually?
Configure to order products are also known as models. They are products, for example personal computers, whose:
-
Optional items are assembled to customer requirements: For example, personal computer options may include monitors and keyboards
-
Options’ demand is dependent on the model’s demand: For example, desktop personal computers may require monitors
The probability of an option is the likelihood that an item will be purchased when another item is purchased. For:
-
Mandatory items, the probability is 100%
-
Options, the probability comes from the sales history.
These inter-item probabilities can also vary across regions and across sales channels as customer preferences vary.
The probabilities become planning percentages on the mandatory components and options that help derive the forecasted demand for them.
The demand planning process for configure to order includes these processes:
-
Demand Planning and Management for Finished Goods: The process to agree to the future unconstrained demand plan for the models, based on inputs from management of new activities, Sales, Marketing, and historical data.
-
Demand Planning and Management for Components: The process that predicts the mix of the mandatory components and options. It multiplies the final consensus plan for the models by the planning percentages on the mandatory components and options. This process is not part of the supply planning process because these relationships are characteristic of the demand planning process, for example, the effects of promotions and other demand planning activities on the option mix and the effect of the option mix on revenue.
Generally, if you are operating with configurable models and options, you follow the typical Oracle Demantra Demand Management process with some changes for configure to order products. In general, the business flow is:
-
Derive a model forecast from the sales histories of models
-
Calculate item-level forecasts for options and mandatory items by applying planning percentages to the model forecast.
-
Analyze and update item-level forecasts as required in multiple dimensions to reach a consensus
-
Publish the final forecast for supply planning.
Configure to Order Structure
The configure to order structure is typically:
. Base Model
..Option Classes
… Options (Buildable items)
..Mandatory Components (Buildable items)
A base model bill of material is typically made up of
-
The base model
-
Options that are grouped into option classes: An option class is not a buildable or saleable item. For each option class, the customer may choose one or more of the options. An option can be another model.
-
Mandatory components/included items: These are included as part of all models
This is a sample base model bill of material.
Sedan
.. Tires
… Standard
… Long Life
.. Seats
… Cloth
… Leather
… Vinyl
.. Roof Rack
… Luggage Style
… Bicycle Style
.. Operating Manual
The base model is Sedan. In the Sedan bill of material, the:
-
Option classes are Tires, Seats, and Roof Rack
-
Options are Standard, Long Life, Cloth, Leather, Vinyl, Luggage Style, and Bicycle Style
-
Mandatory component is Operating Manual
Base models can be of these types:
-
Assemble to order: The manufacturer or distributor assembles the components and ships the configured item, for example, an automobile.
-
Pick to order: The components are shipped separately and assembled by the recipient, for example, a children’s outdoor play set.
Planning Percentages
The makeup of the modular products is represented both by model bills and the ratio of the sales of options to the sales of models.
Oracle Demantra generates the independent demand forecast for an item, typically the base model, on the basis of the independent history for the item.
Each component item in a model bill of material has a planning factor. The planning factors are the attach rates, or ratios of options to model demand, that is, the percentage of time that customers order that component item when they order the model.
These ratios, called planning percentages, express the relationship of options to the models. They need to be derived in the demand planning process where changes in product mix can affect the revenue related to a forecast. Also, promotions and other demand planning activities can change the options that are being sold.
Estimating model demand is not enough but predicting the mix of options or features based on their relative sales is necessary using historical percent--the average historical sales of options to models:
Note: Refer to system parameters "CTO_Enable_Worksheet_Calculations" and "CTO_PLANNING_PERCENTAGE_CHOICE" documented in the Oracle Demantra Implementation Guide.
Bill of Material Explosion
Oracle Demantra calculates the dependent demand forecast for a dependent item (option class, option, mandatory component) by exploding the forecast from its respective parents using the corresponding bills of material. Dependent demand for an item is calculated by multiplying its planning percentage by the demand at the next highest level in the bill of material. Dependent demand items can also have an independent demand forecast, for example, the service parts portion of their demand
The total demand for any item is the sum of the dependent and independent components of demand. For example, the demand for computer monitors is a composite of its direct (independent) demand and the demand deriving from the sale of personal computer systems (dependent demand).
This table shows a sample base model bill of material with the items, the planning percentages, and the results from the model bill of material explosion
| Bill of Material Item | Planning Percentage | Demand | Explosion Calculation |
|---|---|---|---|
| . Sedan | - | . 500 (forecast) | - |
| .. Tires | ..100% | .. 500 | ..500 * 1 |
| … Standard set | .. 75% | … 375 | … 500 * 0.75 |
| … Long Life set | .. 25% | … 125 | … 500 * 0.25 |
| .. Seats | ..100% | .. 500 | .. 500 * 1 |
| … Cloth | … 10% | 50 | … 500 * 0.1 |
| … Leather | … 45% | … 225 | … 500 * 0.45 |
| … Vinyl | … 45% | … 225 | … 500 * 0.45 |
| .. Roof Rack | .. 35% | .. 175 | .. 500* 0.35 |
| … Luggage Style | … 60% | … 105 | … 175 * 0.6 |
| … Bicycle Style | … 40% | … 70 | … 175 * 0.4 |
| .. Operating Manual | .. 100% | .. 500 | .. 500 * 1 |
Moving Configure to Order Data from Oracle e-Business Suite to Oracle Demantra
Data that moves from Oracle e-Business Suite to Oracle Demantra includes:
-
Item master information
-
Option attributes
To move configure to order data from Oracle e-Business Suite into Oracle Demantra, use a two-stage process:
-
Collections: Collect Shipment and Booking History process
-
Download: EBS Full Download and Import Integration Profiles process
Configure to Order Levels
Configure to order structures work with these levels:
-
Item: Item lowest level for non-configure to order
-
Demand Class: Item lowest level for classifying non-configure to order demand
-
Base Model: Configure to order item lowest level that allows demand for multiple (Item, Parent) combinations to be planned for multiple root models.
-
Parent Item: Configure to order item lowest level that allows demand for the same item to be planned in the context of multiple parents (Item, Parent). Oracle Demantra derives parent item, it is not part of the bill of material.
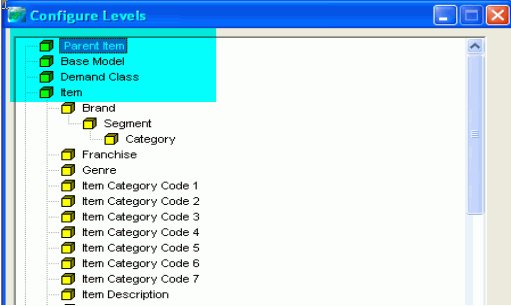
For example, there is a bill of material structure
Computer Package A
. Laptop A1
.. Option Class HardDisk
... Harddisk 120G
... Harddisk 150G
.. Option Class Processor
... Processor Pentium 2GHz
... Processor AMD 2 GHz
The level load contains these entries
| Level1: Parent Item | Level2: Item | Level3: Base Model |
|---|---|---|
| Computer Package A | 120G + Pentium 2 GHz | Computer Package A |
| Computer Package A | 120G + AMD 2 GHz | Computer Package A |
| Computer Package A | 150G + Pentium 2 GHz | Computer Package A |
| Computer Package A | 150G + Pentium 2 GHz | Computer Package A |
| Computer Package A | Computer Package A | Computer Package A |
Configure to Order Options
If a base model has history, all its options are loaded into Oracle Demantra.
Option information for Oracle e-Business Suite is dimensioned by the item and organization level. This information needs to be associated to the other dimensions, for example site and demand class, when stored and planned in Oracle Demantra.
Configure to Order Sales History
The Collect Shipment and Booking History process includes configure to order history.
It uses profile option MSD_DEM: Include Dependent Demand. Set it to Yes for the process to collect the bills of material for configure to order.
The process collects bills of material that are active within the Shipment History time span (or the time span of other selected series). The bill of material start date is required, but not the end date.
It calculates dependent demand through the bill of material effective end date, if there is a value on the bill of material.
It loads the History Dependent Demand series from the history of options. The series that is loaded into History Dependent Demand is determined by the independent demand history series in Oracle Demantra. The default is Shipment History - requested items - shipped date.
Note: Refer to system parameter "CTO_HISTORY_PERIODS" documented in the Oracle Demantra Implementation Guide.
The series available for configure to order collections are:
-
Dependent Booking - booked items – booked date
-
Dependent Booking – requested items – booked date
-
Dependent Booking – booked items – requested date e
-
Dependent Booking – requested items - requested date
-
Dependent Shipping - requested items – shipped date (default)
-
Dependent Shipping – shipped items – requested date
-
Dependent Shipping – requested items - requested date
For every series that you mark Yes on the Collections parameter window, it loads the shipment and booking history of the options as follows:
-
The name of the series is the same as the marked series with – Dependent Demand appended, for example, you select series Booking History, the dependent demand is in series Booking History – Dependent Demand
-
The exception is for the default series; its dependent demand is in series History – Dependent Demand
The process only includes configured items with these attributes:
-
Autocreated Configuration: No; this excludes configuration items
-
Assemble to Order: Yes
-
Pre-specified popular configurations
For example, there is a bill of material structure
Computer Package A
. Laptop A1
.. Option Class HardDisk
... Harddisk 120G
... Harddisk 150G
.. Option Class Processor
... Processor Pentium 2GHz
... Processor AMD 2 GHz
The sales history load contains these entries
| Item | Parent Item | Base Model | Date | Quantity |
|---|---|---|---|---|
| 120G | Harddisk | Computer Package A | 1/1/2008 | 1 |
| Pentium 2 GHz | Processor | Computer Package A | 1/1/2008 | 1 |
| Harddisk | Laptop A1 | Computer Package A | 1/1/2008 | 1 |
| Processor | Laptop A1 | Computer Package A | 1/1/2008 | 1 |
| Laptop A1 | Computer Package A | Computer Package A | 1/1/2008 | 1 |
| Computer Package A | Computer Package A | Computer Package A | 1/1/2008 | 1 |
Viewing Bill of Material Information in Worksheets
To include a bill of material tree in a worksheet, follow these steps:
-
In the Aggregation tab, select the Base Model and Item
-
In the Layout tab, right-click and select Show BOM Tree.
The system uses a parent level and a child level to display the bill of materials tree in the worksheet. You can see these levels in the Aggregation Tab:
-
CTO Parent
-
CTO Child
However, if you select these levels in the Worksheet Designer and then attempt to enable the Show BOM Tree option, the following error message displays:
Error: The Show BOM Tree option cannot be enabled when either of the following levels are selected: CTO Parent, CTO Child. To display the BOM Tree, remove these levels.
In any worksheet with the Show BOM Tree option enabled, you can create additional views. The bill of materials tree is then enabled in every additional view. Conversely, if you disable the Show BOM Tree option in any view, it is disabled in every view in the worksheet.
You can add notes to any item that is an option or option class displayed in the bill of materials tree. When you right-click and select Notes for an option or option class in the bill of materials tree, the note appears on that option or option class when the bill of materials tree is displayed.
If the item is not displayed in the bill of materials tree format (for example, item's dependant demand across all base models and independent demand), all notes assigned to that item in the bill of materials tree is visible.
In all display formats, the display:
-
Always includes independent demand
-
Includes dependent demand when it is a calculation that depends on the parent demand relationships in the bill of material
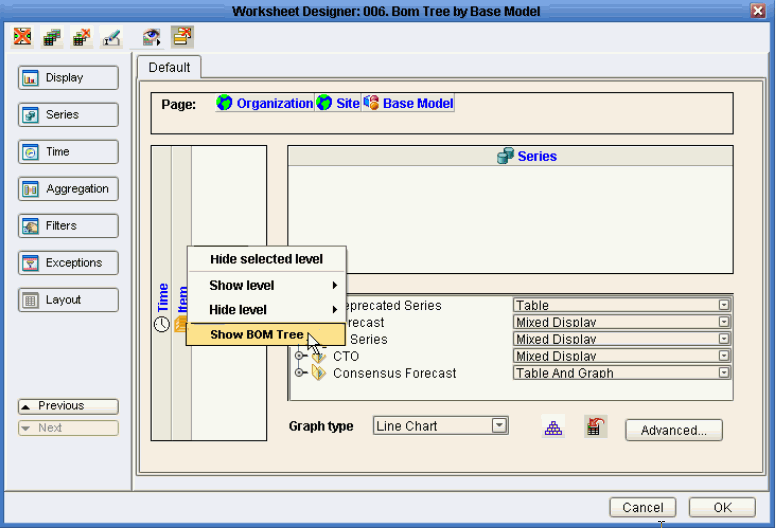
If you do select Show BOM Tree, you see the bill of material in indented fashion.
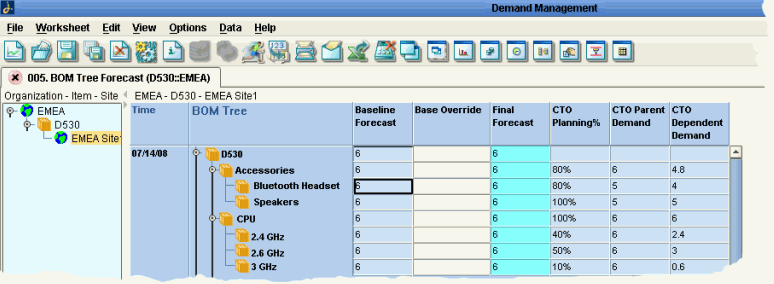
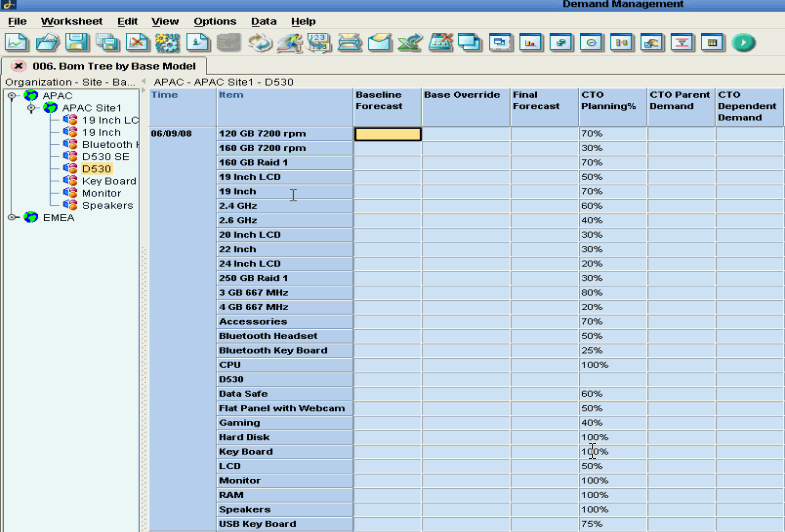
If you do not select Show BOM Tree and Item is on the crosstab, you see the bill of material as a flattened list of all levels.
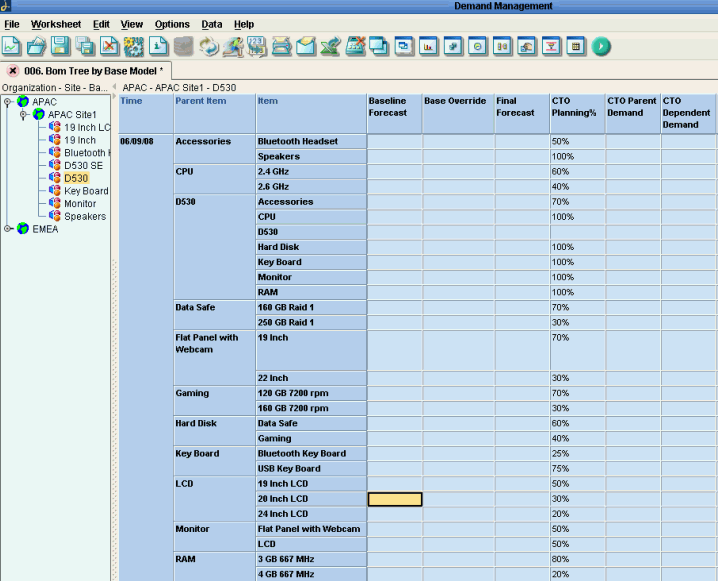
If you do not select Show BOM Tree and both Item and Parent Item are on the crosstab, you see a typical crosstab without multi-level recursion of the bill of material.
If you want to display information grouped by level, a new level can be added to the CTO levels. For example, you can add a new level if you want to view all the BOMs for base models in the Product Family server, a CTO level called BM Product Family can be created during implementation and placed to the right of the BOM tree (associating the base models to the Product Family server is also an implementation task).
To view level information in the BOM tree
A level is usually placed to the right of the BOM tree for information purposes, such as viewing associated level values. You can do this by creating a series on the level in the Business Modeler.
-
In the Business Modeler, click the Series icon.
-
Click the New icon.
-
In the General Properties tab, enter the following:
-
Enter the Series name
-
Editable = No
-
-
In the Display Properties tab, enter the following:
-
Table only
-
No summary
-
-
In the Data Properties tab, enter the following:
-
Data Table = Level. For example:
<Level> Product Family
-
Aggregation Function = MIN
-
-
In the Expression Properties tab, enter the following:
-
Server Expression = Select relevant table for MIN function. For example:
min (t_ep_ebs_prod_family.ebs_prod_fmly_desc)
-
-
Click Save.
Editing Planning Percentages in a Worksheet
An option-class item combination may be part of the configuration of more than one base model.
After the initial download of planning percentages, the planning percentage for an option class-item combination in multiple base models is the same.
If you use a worksheet to edit an option class-item combination that is in multiple base models, the planning percentages that result can be different depending on whether or not the base model in included in or excluded from the worksheet.
Note: Refer to system parameter "CTO_Enable_Worksheet_Calculations" documented in the Oracle Demantra Implementation Guide.
This example shows two central processing unit base models after the initial download of planning percentages.
| Bill of Material Item | Planning Percentage | Bill of Material Item | Planning Percentage |
|---|---|---|---|
| . CPU 1 (model) | - | . CPU 2 (model) | - |
| .. Drives (option class) | ..100% | .. Drives (option class) | 100% |
| … Hard drive 120g | .. 40% | … Hard drive 120g | … 40% |
| … Hard drive 220g | .. 60% | … Hard drive 220g | … 60% |
In this example:
-
The worksheet levels are Base Model, Option Class, and Item
-
You change the planning percentage for Model CPU 1 > Option class Drives > Hard Drive 220g from 60% to 80%
| Bill of Material Item | Planning Percentage |
|---|---|
| . CPU 1 (model) | - |
| .. Drives (option class) | ..120% |
| … Hard drive 120g | .. 40% |
| … Hard drive 220g | .. 80% |
Continuing with this example where base model is a worksheet level:
-
Since base model is an included level in the worksheet, the planning percent for Model CPU 2 > Option class Drives > Hard Drive 220g remains at 60%
-
For exporting the option class-item combination to Oracle Advanced Supply Chain Planning, Oracle Demantra averages the multiple planning percentages and exports the average. In this case, it exports 70% for Option class Drives > Hard Drive 220g [(80 + 60) / 2 = 140 / 2].
| Bill of Material Item | Planning Percentage | Bill of Material Item | Planning Percentage |
|---|---|---|---|
| . CPU 1 (model) | - | . CPU 2 (model) | - |
| .. Drives (option class) | ..120% | .. Drives (option class) | 100% |
| … Hard drive 120g | .. 40% | … Hard drive 120g | … 40% |
| … Hard drive 220g | .. 80% | … Hard drive 220g | … 60% |
In this example:
-
The worksheet levels are Option Class and Item
-
You change the planning percentage for Option class Drives > Hard Drive 220g from 60% to 80%
| Bill of Material Item | Planning Percentage |
|---|---|
| .. Drives (option class) | ..120% |
| … Hard drive 120g | .. 40% |
| … Hard drive 220g | .. 80% |
Continuing in this example where base model is not a worksheet level:
-
Since base model is not an included level in the worksheet, the planning percent for Model CPU 2 > Option class Drives > Hard Drive 220g also changes to 80%
-
For exporting the option class-item combination to Oracle Advanced Supply Chain Planning, Oracle Demantra exports the common planning percentage. In this case, it exports 80% for Option class Drives > Hard Drive 220g.
| Bill of Material Item | Planning Percentage | Bill of Material Item | Planning Percentage |
|---|---|---|---|
| . CPU 1 (model) | - | . CPU 1 (model) | - |
| .. Drives (option class) | ..120% | .. Drives (option class) | 100% |
| … Hard drive 120g | .. 40% | … Hard drive 120g | … 40% |
| … Hard drive 220g | .. 80% | … Hard drive 220g | … 80% |
Simulations
You can run simulations to get an approximate forecast based only on the current worksheet as opposed to all the data.
When you make a change to Dep Demand - History that affects the forecast, for example overriding the history of a model or an option and accept the simulation, the simulation process:
-
Generates a new forecast
-
Recalculates the planning percentage
-
Recalculates dependent demand for affected cells
When you make a change to Dep Demand - Existing that affects the forecast, for example overriding the history of a model or an option and accept the simulation, the simulation process:
-
Generates a new forecast
-
Keeps the planning percentage
-
Recalculates dependent demand for affected cells
Overrides
You can make changes to the planning percentages, dependent demand and, independent demand (forecast) by overriding any of these three series via the corresponding override series, for example, Planning Percentage Override.
You can make changes at any depth level of the bill structure. The changes propagate through the entire bill structure; you do not have to make any additional manual changes.
Configure to Order Worksheets
See Configure to Order Worksheets
Configure to Order Series
See Configure to Order Series
Settings for Planning Percentages and Dependent Demand
You must instruct e-Business Suite to collect configure to order structures, demand, and history.
-
You can specify source of the planning percentages
-
Oracle Demantra calculates them
You can specify the number of history periods to use when calculating planning percentages based on the history of the options.
You can specify upon what entities to calculate planning percentages:
You can specify where to calculate dependent demand and derive planning percentages:
-
Each organization
-
Globally
For more information, see Setting up Configure to Order in Oracle Demantra Implementation Guide.
Planning Percentage Calculation Based on Sales History Options
The historical planning percentages do not change with time and the same planning percentages are used for all the forecasting periods.
For example, if there is a forecast for January 2009 and February 2009 based on history, the calculation of the options’ dependent demand for both January 2009 and February 2009 use the same planning percentages.
Planning Percentage – History =
History of the item during the past CTO_HISTORY_PERIODS / History of its parent item during the past CTO_HISTORY_PERIODS.
The process does not calculate planning percentages prior to an item’s BOM Effective Start Date or after an item’s BOM Effective End Date.
It calculates planning percentage for all the active items to the lowest levels of the bill of material.
Dependent Demand Calculation Based on Planning Percentages
The dependent demand calculation for options and items is based on the base model’s information.
It occurs at the following stages:
-
After the forecast engine process generates the base models
-
Any time that you change base model information
The calculation propagates changes in the intermediate level data to all the children of that level.
Dep Demand – Existing =
Plng Pct- Existing * Immediate parent forecast
Dep Demand – History =
Plng Pct- History * Immediate parent forecast
Forecast Dependent Demand =
Final Plng Pct * Immediate parent forecast
Final Forecast Dependent Demand =
If there is a value in Forecast Dependent Demand Override, it is the Forecast Dependent Demand Override value. Otherwise, it is the value of Forecast Dependent Demand.
Forecast Calculations
For global forecasting:
-
Calculate planning percentages at the global level.
-
Aggregate the sales history of the parent item or base model across all the organizations
-
Calculate planning percentages at the All Organization level
-
Use the same planning percentages for all the organizations
-
If the dependent demand or the planning percentages are modified in a worksheet for an organization, the demand for all other organizations is affected.
For product family forecasting:
-
Generate a statistical product family forecast using product family demand
-
Allocate the product family forecast to the member item forecasts
Configure to Order MAPE Calculation
The series MAPE CTO holds the results of the MAPE CTO procedure that calculates the accuracy statistics for Consensus Total Demand. This provides the information Inventory Optimization requires to calculate Safety Stock. The calculation is:
sum(abs(Total History – Archived Consensus Total Demand))/sum(History)
where
- Total History = History + Final Forecast Dependent Demand for the 13 week period of the archived forecast
- Consensus Total Demand = Independent Demand + Dependent Demand
Moving Configure to Order Data from Oracle Demantra to Oracle e-Business Suite
Data that moves from Oracle Demantra to Oracle e-Business Suite includes:
-
Consensus Total Demand, Final Plng Pct, MAPE CTO, and Demand Priority for all models and options to Oracle Advanced Supply Chain Planning
-
Independent Demand for options with a forecast control of NONE to Oracle Advanced Supply Chain Planning; these options do not have dependent demand
-
Consensus Total Demand & MAPE CTO for base models to Oracle Inventory Optimization
To move configure to order data from Oracle Demantra into Oracle e-Business Suite, use upload workflows:
-
For uploading Consensus Forecast and Final Forecast Dependent Demand, MAPE CTO, and Demand Priority (information for models and their options), use the CTO Upload workflows
-
For uploading product family and item level Consensus Forecast and Product Family ratios, MAPE CTO, and Demand Priority (information for product families and their children), use the CTO Upload Product Family workflows
For more information on the CTO Upload and CTO Upload Product Family workflows, see Setting up Configure to Order in Oracle Demantra Implementation Guide.
Oracle Advanced Supply Chain Planning loads and processes the data for Consensus Total Demand and Planning Percentage information for models and their options as follows:
-
Model Forecast Control = Consume or Consume & Derive
-
Options Forecast Control = None
-
Oracle Advanced Supply Chain Planning explodes the forecast from model to option using the Oracle Demantra Demand Management planning percentages
Oracle Advanced Supply Chain Planning loads and processes the data for Consensus Total Demand and Planning Percentage information for product families and their children as follows:
-
Model Forecast Control = Consume or Consume & Derive
-
Options Forecast Control = Consume or Consume & Derive
-
Oracle Advanced Supply Chain Planning explodes the option’s Consensus Total Demand to find its independent and dependent demand.
Oracle Demantra calculates Plng Pct- History at the lowest level for all levels.
When you upload planning percentages to Oracle Advanced Supply Chain Planning, you do so at the level Item-Organization for items with item attribute Forecast Control set to None. Oracle Advanced Supply Chain Planning uses the Oracle Demantra planning percentages to explode demand from model to option class to model.
When you upload dependent demand to Oracle Advanced Supply Chain Planning, you do so at levels Item, Organization, Zone, and Demand Class for items with item attribute Forecast Control set to Consume or Consume & derive. Oracle Advanced Supply Chain Planning uses the Oracle Demantra dependent demand and does not use the Oracle Demantra planning percentages
Data in the seeded export workflows matches the worksheet data when you view it at the viewed at the lowest levels Item, Organization, Week, Demand Class, and Zone.
Service Parts Planning and Service Parts Forecasting Overview
Repair service operations need service parts planning systems to ensure that the right parts are at the right locations, at the right times, and in the right (usable) condition, while being consistent with inventory budgets and service level targets.
Service parts inventory management differs from product inventory management; hence the need for functionality designed to handle special service parts situations such as: supersession and intermittent demand.
The Oracle Service Parts Planning solution supports the following forecasting modes:
-
Traditional
A demand planning system generates a demand forecast that serves as a demand schedule input to the service parts plan, and where implemented, also to the inventory optimization plan. The demand planning system also generates a returns forecast that serves as a supply schedule input to the service parts plan.
-
Inline
Service Part Planning uses Oracle Demantra Demand Management functionality to generate the service parts demand.
In either mode, forecasts can be based on usage history or shipment history.
In the case of new product introductions or similar situations where there is insufficient history for a reliable basis, the inline mode provides the ability to base forecasts on the item's install base population and average failure rate.
This document describes the inline scenario, in which Demantra generates the service parts forecast and it is then exported for use in Oracle Service Parts Planning or other legacy application.
For more information about Oracle Service Parts Planning, Oracle Field Service Spares Management, or Oracle Depot Repair, refer to the appropriate Oracle product documentation.
Service Parts Forecasting
Demantra forecasts demand for service parts using two methods. One method uses analytical models, and the other method is calculated using install base data and failure rates. Demantra generates forecasts using both methods and then allows you to select the preferred forecast based on past experience, industry-specific knowledge, or other information.
By applying a service part specific failure rate to the projected install base at an organization, it is possible to project future demand for service parts.
Failure Rates
Failure rates are based on a comparison of the supported units for the finished good and a specific quantity of service parts that are used to service them. A seeded process calculates the ratio between the number of supported base models and usage. The result of the process is the failure rate.
The level at which these values are calculated can vary by business requirement and is configurable as part of an implementation. It is possible to calculate failure rates at very granular levels. This results in planning percentages that closely reflect part usage for a specific spare and location. However, this method is also susceptible to large variations in demand over time that are due to inherent intermittent part usage. It is also possible to calculate failure rates at more aggregate levels; here the rates generated are more generic but are less susceptible to variation.
When generated in aggregation all underlying combinations are assigned the same failure rate.
For more information about how to configure the failure rate calculation, refer to Oracle Demantra Implementation Guide.
Process Overview
The following example describes a typical Service Parts Forecasting cycle:
-
Data, such as service items, usage history, install base details, and details, are imported from a source system (for example, Oracle Service Parts Planning) into Demantra.
-
The Demantra analytical engine generates a forecast at the spare/org level and another forecast is calculated based on projected install base information and failure rates.
-
Demantra stores the new forecast values in the following series:
-
SPF Baseline Forecast
-
SPF Calculated Forecast
-
-
Using values stored in the series above, Demantra automatically calculates values for the following series:
-
SPF Forecast MAPE (In Sample)
-
SPF Forecast MAPE (Out of Sample)
-
SPF Forecast Volatility
-
SPF Average Demand
These series are described in Service Parts Forecasting Series in Appendix A.
Note: Forecast accuracy measures can be viewed at any aggregation level, but by default they are calculated at the Spare/Organization level. When viewed above this level in a worksheet the values will be aggregated to the selected level.
-
-
Using predefined or custom worksheets, demand analysts review the values these series, analyze the install base and failure rate values, optionally make adjustments, and run simulations to model different scenarios. When the desired scenario is achieved, the user saves changes to the worksheet and accepts the simulation results.
During this process, the following series can be overridden:
-
SPF Item Usage or SPF Item Shipments (historical demand)
-
SPF Failure Rate %
-
SPF Install Base
-
SPF Calculated Forecast
-
SPF Baseline Forecast
Changes to the failure rate or install base are immediately reflected in a revised SPF Calculated Forecast value.
-
-
An analyst optionally changes the default value of the “SPF Forecast Method” series. This setting controls which forecast populates the “SPF Final Forecast” series and will eventually be exported to downstream applications, such as Oracle Service Parts Planning (SPP).
-
An analyst may manually upload incremental changes made in a worksheet to the Demantra staging tables and from there to Service Part Planning; this is done by invoking a method from within a worksheet. For more information about this method, refer to the Oracle Demantra Implementation Guide.
-
The preferred (final) forecast and other metrics are exported to the Demantra staging tables using workflows.
-
An administrator from the external system executes the required process(es) to import the final forecast and metrics from the Demantra staging tables into the external system’s database tables.
-
The forecast and metrics are used by the external system, such as to trigger exceptions or as an input to other custom processes.
For more information about Service Parts Forecast worksheets, refer to Service Parts Forecasting (SPF) Worksheets.