Using the SPP Dashboard
This chapter covers the following topics:
- Overview
- Using the Plan Health Summary Page
- Using the Demand & Supply Page
- Using the Exceptions Page
- Using the Service Level Agreement Analysis Page
- Using the Historical Performance Page
Overview
The Service Supply Chain Analyst dashboard helps a Service Parts Planner review his service supply chain, monitor the plan performance, and identify potential issues, cutting across planning applications. Pre-seeded Service Parts Planning reports are available with the role of ‘Service Parts Analyst’. The reports enable tasks related to service parts plan analysis, and their layout and content may be changed by the user.
These reports, and glossary information, are available in the following tabs:
-
Plan Health Summary
-
Demand and Supply
-
Exceptions
-
SLA Analysis
-
Historical Performance
Using the Plan Health Summary Page
This page provides the Supply Chain Analyst an overal view of the plan’s health. Key metrics are displayed regarding demand and supply, resources, and exceptions. This page also provides the ability to compare an archived plan against actuals, and against a current plan.
Page level Filters
The following page level filters are provided:
| Baseline Plan | A drop down with a list of plans to be used as the baseline. Only one selection is allowed. |
| Comparison Plan | A drop down with a list of plans from which the archived plan may be selected. Multiple plans may be selected from this list |
| Category | A drop down with a list of Categories. Multiple categories may be selected from this list |
| Organization | A drop down with a list of Organizations. Multiple organizations may be selected from this list |
| Period Start | Ability to select the date range of choice over which the reports should be displayed. |
Demand and Supply Summary Report
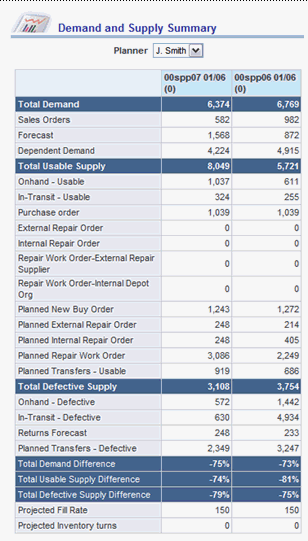
This report helps users to determine how demand and supply differ between baseline and comparison plans. One example would be to determine what has changed since the previous month. Both Usable and Defective supplies are shown.
The rows ‘Total Demand Difference’, ‘Total Usable Supply Difference’ and ‘Total Defective Supply Difference’ rows are computed as a percentage: (Baseline Plan Value minus Archived Plan Value) / (Archived Plan Value). The table allows drilling down to relevant reports from the Plan Value (described below).
Drill-downs
The report Demand and Supply Summary Report provides the following drilldowns.
Demand & Supply Totals by Category

This provides the following:
-
Ability to drill down from Totals field
-
Ability to select multiple categories using the dropdown containing the list of categories.
-
Transfers include In-transits and Planned Transfers
-
Repairs include existing repair orders and Planned Repair orders, both internal and external
-
New Buy includes existing Purchase Orders and Planned New Buy Orders
-
Category TOTAL is a computed field. It is okay to sum across multiple UOM’s within the Category.
-
In case of multiple Categories, pagination is applied, 25 lines per page. The Category TOTAL is displayed each page.
Demand & Supply Totals by Organization

This provides the following:
-
Ability to drill down from Totals field
-
Ability to select multiple organizations using the dropdown containing the list of categories.
-
Transfers include In-transits and Planned Transfers
-
Repairs include existing repair orders and Planned Repair orders, both internal and external
-
New Buy includes existing Purchase Orders and Planned New Buy Orders
-
Organization TOTAL is a computed field. It is okay to sum across multiple UOM’s within the Organization.
-
In case of multiple Categories, pagination is applied, 25 lines per page. The Category TOTAL is displayed each page.
This report provides the planner the ability to compare measures within a given plan. This can be useful in a number of ways, for example, to compare how demand compares with supply in each period, to see how the supply is composed (by comparing total supply against repairs, purchases etc). The planner is able to select multiple measures by means of a multi select, and the graph plots for the selected measures over time.
This is the same as the Demand & Supply Trend- Base Plan report in Demand & Supply page. While that report permits the user to select multiple measures, then drilling down from there, this report opens with all measures selected.
This report shows the user the top categories / zones / organizations / supersession with the highest demands.
This is similar to the ‘Top Demand’ report in the Demand & Supply Page but opens in the context of the filters applied on the parent report. It can be viewed along Category, Organization and Zone dimensions.
This report shows the top categories / zones / organizations / supersession with the highest supplies.
This is the similar to the ‘Top Supplies’ report in the Demand & Supply Page but opens in the context of the filters applied on the parent report. It can be viewed along Category and Organization dimensions..
This report shows the user the top categories / zones / organizations / supersession with the highest returns.
This is the similar to the ‘Top Returns’ report in the Demand & Supply Page but opens in the context of the filters applied on the parent report. It can be viewed along Category, Organization, and Zone Dimensions.
This shows the user the top categories / zones / organizations / supersession with highest repairs.
This is the similar to the ‘Top Repairs’ report in the Demand & Supply Page but opens in the context of the filters applied on the parent report. It can be viewed along Category and Organization dimensions.
Exceptions Summary
This is similar to the ‘Exceptions Summary' report in the ‘Exceptions’ page. The report opens in the context of the filters applied on the ‘Demand & Supply Summary’ parent report.
Safety stock versus PAB Trend
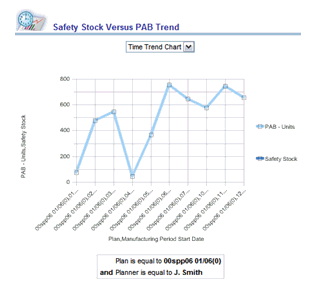
This compares safety stock against the Projected Available Balance over time.
Safety stock versus PAB by Category
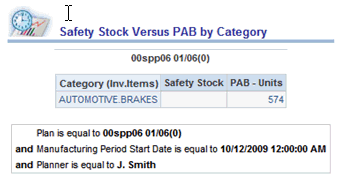
This compares safety stock and PAB, grouped by category.
Safety stock versus PAB by Organization
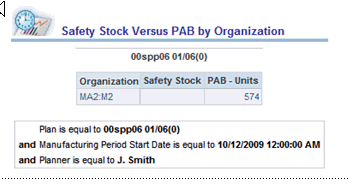
This compares safety stock and PAB, grouped by organization.
Safety stock versus PAB by Supersession Chain
This compares safety stock and PAB, grouped by supersession chain.
Replenishment by Type Report
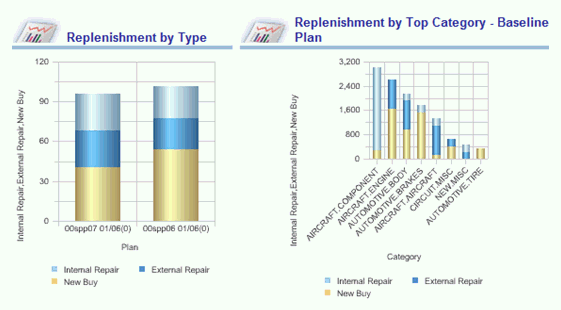
Repair vs. buy is one of the key decisions that a service parts planner has to make. This report graphically shows the planner what percentage of replenishments are met through repairs versus new parts. Within repairs, it shows how much is repaired by internal repair depots versus third party repair suppliers. A second graph shows the split between the all three sources, by category.
Drill-downs
The following drill-down reports are available from the Replenishment By Type Report:
Demand & Supply Totals by Category
This report is identical to the Demand & Supply totals by Category drill-down from Demand & Supply Summary report but opens in the context of the filters applied on the parent report. It is possible to drill down from both the archived plan and the baseline plan
Demand & Supply Totals by Organization
This report is identical to the Demand & Supply Totals by Organization drill-down from Demand & Supply Summary report but opens in the context of the filters applied on the parent report. It possible to drill down from both the archived plan and the baseline plan.
Demand & Supply Totals Trend
This is identical to the Demand & Supply Trend report in Demand & Supply page but opens in the context of the filters applied on the parent report. While that report permits the user to select multiple measures, when drilling down from here the report opens with all measures selected. Also, the table, (and not the graph) opens up when the planner drills down from here. This drill-down is available both for the Archived and the Baseline plan.
Top Repairs
This is similar to the ‘Top Repairs’ report in the Demand & Supply Page but opens in the context of the filters applied on the parent report. It is viewable along Category, and Organization dimensions.
Exceptions Report
Since the first thing a planner usually does while reviewing a plan is to look at the exceptions in the plan, the Exceptions Report is included in the Plan Health page. This report helps the planner analyze exceptions in the Baseline plan and compare them with those in other plans.
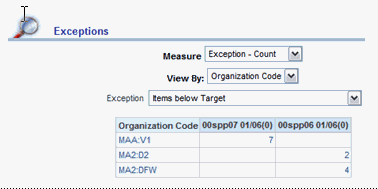
The user can filter the table across the following dimensions in addition to the page level filters:
-
Exception TypeAbility to select multiple exception types using the drop down containing the list of exception types.
-
Measure: Ability to select one of the exceptions facts as the measure to be displayed in the table. The measures include: Exception Count, Exception Value, Exception Days, Exception Quantity, and Exception Ratio
The table provides the following:
-
Ability to drill down to relevant reports (described below) from the Plan Value
-
Note that this report is a mixed report in that some of the exceptions are in Dollars ($), some in Quantity, Some as Ratio and others as Count or Days. The appropriate format should be followed as shown in the table above.
-
Pagination should be applied if required. A maximum of 25 lines per page should be displayed
The ‘Exception’ drop down contains all exceptions in an SPP plan and the planner can select one from the list to compare the two plans against.
In case there are multiple measures for an exception – for example, Safety stock exceptions can be measured in quantity or days – the Measure drop down would have a list of values that the planner can select from.
The planner has the ability to view the exceptions in the plan along different dimensions – Supersession chain, Category and Organization
Drill-downs
The following drill-down reports, defined above, are available from the Exceptions Report:
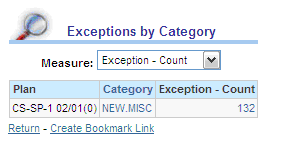
This report helps users analyze exceptions by Category in the plan that he drills down from.
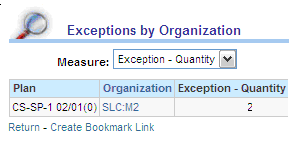
This report helps users analyze exceptions by Organization in the Baseline Plan and also compare exceptions between the Baseline and Comparison Plans.
The layout of this report is similar to the Exceptions by Category report, except that this report permits filtering, and opens by supersession chain.
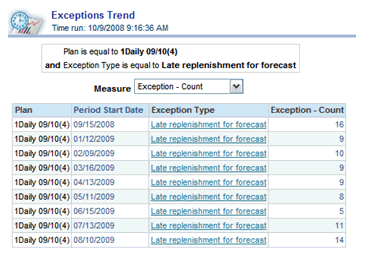
The Exceptions Trend graph plots the selected exception along the time dimension. This can be viewed either as a graph or as a table.
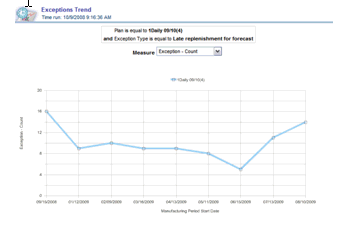
The table provides the ability to drill down to the same reports as in the chart.
Shipment & Returns - History & Trend Report
This report helps the users evaluate:
-
How did the Plan for key supply chain metrics compare against Actual in past periods
-
iHow do it project in the future (History vs. Plan / Forecast)
This graph plots key service supply chain metrics over time. It indicates how each of the service supply chain metrics have been performing historically and what the plan for them is, looking forward in time. If any of the metrics displays a significant deviation between periods then it is a visual indication of change.
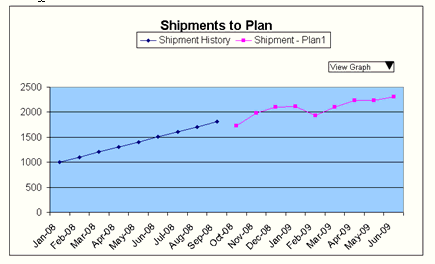
This report can be viewed either as a graph or as a table.
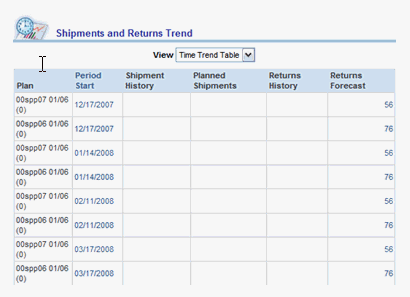
The table provides the following:
-
Ability to show or hide the table
-
Ability to drill down to the same reports as in the chart
-
Up to two decimals displayed
Drill-downs – Shipments to Plan
Demand & Supply Totals by Category
This report is identical to the Demand & Supply totals by Category drill-down from Demand & Supply Summary report but opens in the context of the filters applied on the parent report.
Demand & Supply Trend
This is similar to the Demand & Supply Trend report in Demand & Supply page but opens in the context of the filters applied on the parent report. While that report permits the user to select multiple measures, when drilling down from here, this report opens to compare Total Demand against Total Usable Supply. This drill-down is available both for the Archived and the Baseline plan. The context of the plan is passed, so that the drill-down report opens for the correct plan.
Top Demands
This is the same as the ‘Top Demands’ report defined above.
Top Supplies
This is the same as the ‘Top Supplies’ report defined above.
Exceptions Summary
This report is the same as the ‘Exceptions Summary’ report defined above.
Drill-downs – Returns to Plan
Top Returns
This is the same as the ‘Top Returns’ report defined above.
Using the Demand & Supply Page
This page allows the service parts plan analyst to efficiently evaluate how demand & supply in the service supply chain are balanced over time and how they vary from plan to plan. The reports and metrics identified for plan to plan comparison are detailed in the following sections
Page level Filters
The following page level filters are provided:
| Baseline Plan | A drop down with a list of plans that is to be used as the baseline. Only one selection is possible. |
| Comparison Plan: | A drop down with a list of plans from which the comparison plan may be selected. User can select multiple plans from this list. |
| Category | A drop down with a list of Categories. User can select multiple categories from this list. |
| Organization | A drop down with a list of Organizations. User can select multiple organizations from this list. |
| Planner | A drop down with a list of planners. User can select multiple planners from the list. |
| Period Start | This allows one to select the date from which the report display begins. |
Demand & Supply Summary Report
This report helps you see the break up of demand and the usable and defective supplies in each plan, and to determine how demand and supply differ between baseline and comparison plans (for example, to determine what has changed since last month). Both Usable and Defective supplies are shown in report.
The table representing this report and its layout is presented below:

The rows ‘Total Demand Difference’, ‘Total Usable Supply Difference’ and ‘Total Defective Supply Difference’ rows are computed as a percentage: (Baseline Plan Value minus Archived Plan Value) / (Archived Plan Value). The table provides the following:
-
Ability to drill down to relevant reports (described below) from the Plan Value
-
Decimals not shown
Drill-downs
Drill-downs from this report are the same as the drill downs from the Demand & Supply Summary report on the Plan Health Page.
Demand & Supply Trend Across Plans Report
This report allows you to compare a particular demand or supply measure between two plans. The measures that the planner can compare are: Total Demand, Total Usable Supply, Total Defective Supply, Projected Available Balance (Usable) and Safety Stock Targets. The report can be viewed either as a graph or as a table.
The graph plots the demand and supply measures over time using a line graph. When the lines diverge, it is a visual indication of change in the selected measure between the plans.
Filter dimensions
The report has a filter by Planner. If no planner is selected, the report renders for all planners. In addition, the user is able to filter the table across the following dimensions:
Measure Type: Ability to select the type of measure to be displayed on the graph. The supported measures are: Total Demand, Total Usable Supply, Total Defective Supply, Safety Stock, and Projected Available Balance (Usable). Users will have ability to select only one measure
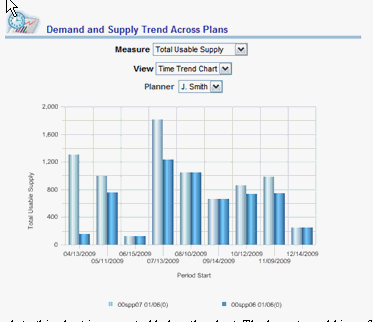
A table of values that corresponds to this chart is presented below the chart. The layout would is as follows:
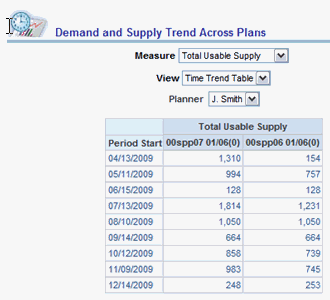
Drill-downs
Demand & Supply Totals by Category
This report is defined under the Demand & Supply totals by Category drill-down from Demand & Supply Summary report. It is possible to drill down from both the archived plan and the baseline plan. Demand & Supply Totals by Organization This report is defined under the Demand & Supply Totals by Organization drill-down from Demand & Supply Summary report.
Top Demands
This is the same as the ‘Top Demands’ report in the Demand & Supply Page. It is viewable by Category, Organization, Zone and Supersession. This drill-down report shows the top demands in the period that the planner drills-down from.
Top Supplies
This is the same as the ‘Top Supplies’ report in the Demand & Supply Page. It is viewable by Category, Organization and Supersession. This drill-down report shows the top demands in the period that the planner drills-down from.
Top Returns
This is the same as the ‘Top Returns’ report in the Demand & Supply Page. It is viewable by Category, Organization, Zone and Supersession. This drill-down report shows the top demands in the period that the planner drills-down from.
Top Repairs
This is the same as the ‘Top Repairs’ report in the Demand & Supply Page. It is viewable by Category, Organization and Supersession. This drill-down report shows the top demands in the period that the planner drills-down from.
Replenishment by Type
This is the same as the ‘Replenishment by Type’ report in the Plan Health page. When a planner clicks on the Total Supplies in a particular period and drills down to this report, the Replenishments in that period, by type, are displayed.
Exceptions Summary
This report is the same as the ‘Exceptions Summary’ report in the Exceptions page. When a planner selects this drill-down, the Exceptions Summary report shows exceptions only in the selected period.
Demand & Supply Trend within Base Plan Report
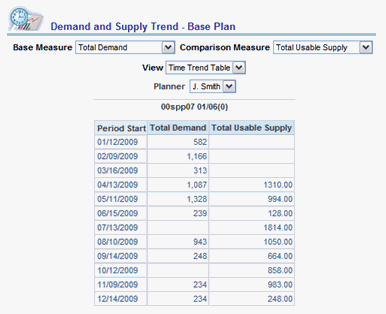
This report provides the ability to compare measures within a given plan. This can be useful in a number of ways, for example, to compare how demand compares with supply in each period
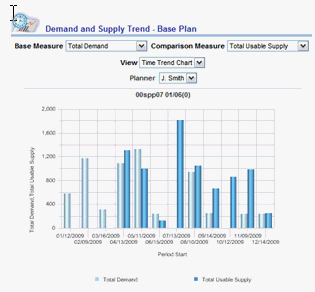
The planner has the option to view the data as a table. The table provides the ability to drill down to the same report as the chart. The format of the table is as follows:
Drill-downs
Demand & Supply Totals by Category
This report is defined under the Demand & Supply totals by Category drill-down from Demand & Supply Summary report. The period information (from which we drill down) is passed in, so that the drill-down report is opened only for that period. Page level filters are also respected in the drill-down report.
Demand & Supply Totals by Organization
This report is defined under the Demand & Supply Totals by Organization drill-down from Demand & Supply Summary report. The period information (from which we drill down) is passed in, so that the drill-down report is opened only for that period. Page level filters are also respected in the drill-down report.
Top Demands
This is the same as the ‘Top Demands’ report in the Demand & Supply Page. This is viewable by Category, Organization, Zone and Supersession. This drill-down report shows the top demands in the period that the planner drills-down from.
Top Supplies
This is the same as the ‘Top Supplies’ report in the Demand & Supply Page. This is viewable by Category, Organization and Supersession. This drill-down report shows the top supplies in the period that the planner drills-down from.
Top Returns
This is the same as the ‘Top Returns’ report in the Demand & Supply Page. This is viewable by Category, Organization, Zone and Supersession. This drill-down report shows the top supplies in the period that the planner drills-down from.
Top Repairs
This is the same as the ‘Top Repairs’ report in the Demand & Supply Page. This is viewable by Category, Organization and Supersession. This drill-down report show the top repairs in the period that the planner drills-down from.
Replenishment by Type
This report is the same as the ‘Replenishment by Type’ report in the Plan Health page. When a planner clicks on the Total Supplies in a particular period and drills down to this report, the Replenishments in that period, by type, are be displayed.
Exceptions Summary
This report is the same as the ‘Exceptions Summary’ report in the Exceptions page. When a planner selects this drill-down, the Exceptions Summary report shows exceptions only in the selected period.
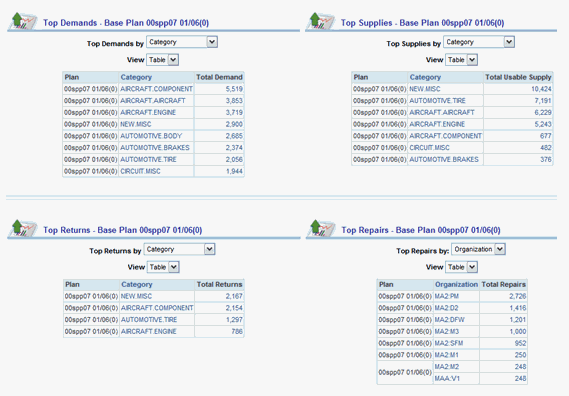
Top Demands Report, Top Supplies Report, Top Returns Report, Top Repairs Report
These reports show the top categories / zones / organizations / supersession with the highest demand, the categories / organizations with the highest supplies, the categories / zones / organizations with the highest returns, and the categories / organizations / supersessions with highest repairs.
These show which categories / zones/ organizations contribute the bulk of his business so that he can focus on them, especially in case of issues.
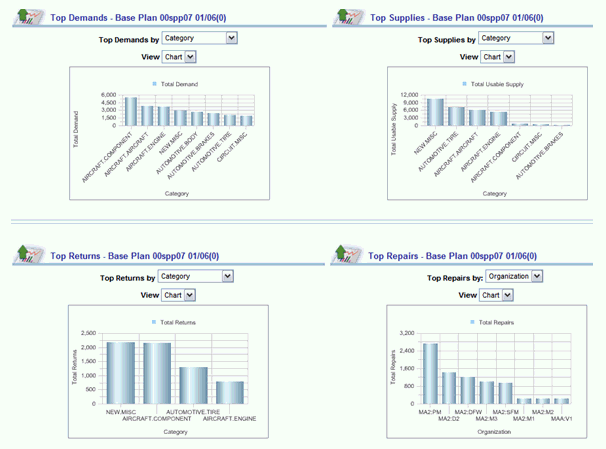
It is also possible to view these reports as tables.
Drill-downs from Top Demands
Demand & Supply Totals by Category
This report is defined under the Demand & Supply totals by Category drill-down from Demand & Supply Summary report. The page level filters are respected in the drill-down report.
Demand & Supply Totals by Organization
This report is defined under the Demand & Supply Totals by Organization drill-down from Demand & Supply Summary report. The page level filters are respected in the drill-down report.
Demand & Supply Totals by Supersession Chain

Demand & Supply Trend
This is the same as the Demand & Supply Trend- Base Plan report in Demand & Supply page. While that report permits the user to select multiple measures, when drilling down from here, the report opens to show Total Demand against Total supply, with the context of the cell / bar that the report id drilled down to.
Exceptions Summary
This report is the same as the ‘Exceptions Summary’ report in the Exceptions page. When selecting this drill-down, the Exceptions Summary report shows exceptions only in the context of the parameters passed (for example category).
Drill-downs from Top Supplies
Demand & Supply Totals by Category
This report is the same as defined under the Demand & Supply totals by Category drill-down from Demand & Supply Summary report. The page level filters are respected in the drill-down report.
Demand & Supply Totals by Organization
This report is defined under the Demand & Supply Totals by Organization drill-down from Demand & Supply Summary report. The page level filters are respected in the drill-down report.
Demand & Supply Totals by Supersession Chain
This report is defined under the Demand & Supply Totals by Supersession drill-down from the Top Demands report. The page level filters are respected in the drill-down report.
Demand & Supply Trend
This is the same as the Demand & Supply Trend- Base Plan report in Demand & Supply page. While that report permits the user to select multiple measures, when drilling down from here, the report opens to show Total Demand against Total supply, with the context of the cell / bar that the report id drilled down to.
Replenishment by Type
This report is the same as the ‘Replenishment by Type’ report in the Plan Health page. When a planner clicks on the Total Supplies, the Replenishments by type is displayed in the context of the parameters passed.
Exceptions Summary
This report is the same as the ‘Exceptions Summary’ report in the Exceptions page. When a planner selects this drill-down, the Exceptions Summary report shows exceptions only in the context of the parameters passed (for example category).
Drill-downs from Top Returns
Demand & Supply Totals by Category
This report is defined under the Demand & Supply Totals by Category drill-down from Demand & Supply Summary report. The page level filters are respected in the drill-down report.
Demand & Supply Totals by Organization
This report is defined under the Demand & Supply Totals by Organization drill-down from Demand & Supply Summary report. The page level filters are respected in the drill-down report.
Demand & Supply Totals by Supersession Chain
This report is defined under the Demand & Supply Totals by Supersession drill-down from the Top Demands report. The page level filters are respected in the drill-down report.
Demand & Supply Trend
This is the same as the Demand & Supply Trend- Base Plan report in Demand & Supply page. While that report permits the user to select multiple measures, when drilling down from here, the report opens to show Total Demand against Total supply, with the context of the cell / bar that the report id drilled down to.
Exceptions Summary
This report is the same as the ‘Exceptions Summary’ report in the Exceptions page. When a planner selects this drill-down, the Exceptions Summary report shows exceptions only in the context of the parameters passed (for example category).
Drill-downs from Top Repairs
Demand & Supply Totals by Category
This report is defined under the Demand & Supply Totals by Category drill-down from Demand & Supply Summary report. The page level filters are respected in the drill-down report.
Demand & Supply Totals by Organization
This report is as defined under the Demand & Supply Totals by Organization drill-down from Demand & Supply Summary report. The page level filters are respected in the drill-down report.
Demand & Supply Totals by Supersession Chain
This report is defined under the Demand & Supply Totals by Supersession drill-down from the Top Demands report. The page level filters are respected in the drill-down report.
Demand & Supply Trend
This is the same as the Demand & Supply Trend- Base Plan report in Demand & Supply page. While that report permits the user to select multiple measures, when drilling down from here, the report opens to show Total Demand against Total supply, with the context of the cell / bar that the report id drilled down to.
Replenishment by Type
This report is the same as the Replenishment by Type’report in the Plan Health page. When a planner clicks on the Total Supplies, the Replenishments by type is displayed in the context of the parameters passed.
Exceptions Summary
This report is the same as the ‘Exceptions Summary’ report in the Exceptions page. When a planner selects this drill-down, the Exceptions Summary report shows exceptions only in the context of the parameters passed (for example category).
Running Top Change Reports
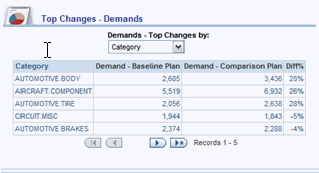
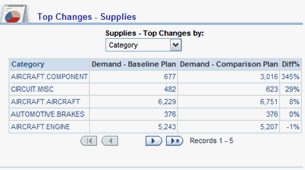
These reports compare Demands, Supplies, Returns and Repairs between two plans to see which are the Categories / Zones / Organizations which have the maximum changes between these plans. These are useful in case of issues, and to investigate which of the changes caused the exceptions.
Top Changes - Demands report
Drill-downs
Demand & Supply Trend Report
This report is defined in the ‘Demand & Supply Trend within Base Plans’ report on the Demand & Supply Page. It opens to the plan from which the planner drills down.
Top Demands Report
This report is defined in the ‘Top Demands’ report on the Demand & Supply Page. It opens to the plan from which the planner drills down.
Top Changes - Supplies report
Drill-downs
Demand & Supply Trend Report
This report is defined in the ‘Demand & Supply Trend within Base Plans’ report on the Demand & Supply Page. It opens to the plan from which the planner drills down.
Top Supplier Report
This report is defined in the ‘Top Supplies’ report on the Demand & Supply Page. It opens to the plan from which the planner drills down.
Top Changes - Returns report
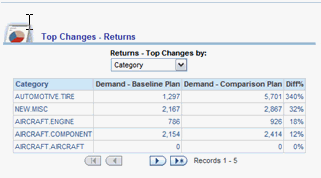
Drill-downs
Demand & Supply Trend Report
This report is defined in the ‘Demand & Supply Trend within Base Plans’ report on the Demand & Supply Page. It opens to the plan from which the planner drills down.
Top Returns Report
This report is defined in the ‘Top Returns’ report on the Demand & Supply Page. It opens to the plan from which the planner drills down.
Top Changes - Repairs report
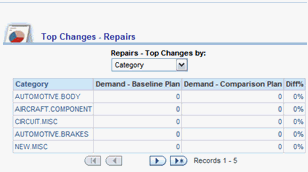
Drill-downs
Demand & Supply Trend Report
This report is defined in the ‘Demand & Supply Trend within Base Plans’ report on the Demand & Supply Page. It opens to the plan from which the planner drills down.
Top Repairs Report
This report is defined in the ‘Top Repairs’ report on the Demand & Supply Page. It opens to the plan from which the planner drills down.
Using the Exceptions Page
This page contains reports that allow users to analyze exceptions in the current plan and help compare against an alternate plan.
Page level Filters
The following page level filters are provided:
| Baseline Plan | A drop down with a list of plans that is to be used as the baseline. Only one selection is possible. |
| Comparison Plan | A drop down with a list of plans from which the comparison plan may be selected. The user can select multiple plans from this list. |
| Category | A drop down with a list of Categories. The user can select multiple categories from this list. |
| Planner | A drop down with a list of planners. User can select one planner to see exceptions on the items he plans |
| Organization | A drop down with a list of Organizations. The user can select multiple organizations from this list. |
| Time | Ability to select the time unit against which the reports should be displayed. The supported Time measures include: Week, Month, and Quarter |
| Planner | A drop down with a list of planners. The user can select multiple planners from the list. |
| Period Start | This allows one to select the date from which the report display begins |
Exceptions Report
The first thing a planner usually does while reviewing a plan is to look at the exceptions in the plan. Hence the Exceptions in the plan are included in the Plan Health form. This report would help the planner analyze exceptions in the Baseline plan and compare them with the Archived plans.
The format of the report is shown below:
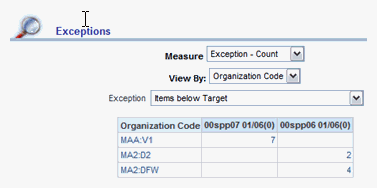
The ‘Exception’ drop down contains all exceptions in an SPP plan and the planner can select one from the list to compare the two plans against.
In case there are multiple measures for an exception – for example, Safety stock exceptions can be measured in quantity or days – the Measure drop down has a list of values that the planner can select from.
The planner has the ability to view the exceptions in the plan along different dimensions – Supersession chain, Category and Organization.
Drill-downs
Drill-downs from this report are the same as the drill downs from the ‘Exceptions’ report on the Plan Health page.
Exceptions Summary Report
This report helps users analyze exceptions in the Baseline Plan and compare exceptions between the Baseline and Comparison Plans. The comparison plan may be a prior plan (what has changed since last month?) or an alternate plan (Can we do better than the current plan?).
The table representing this report and its layout is presented below:
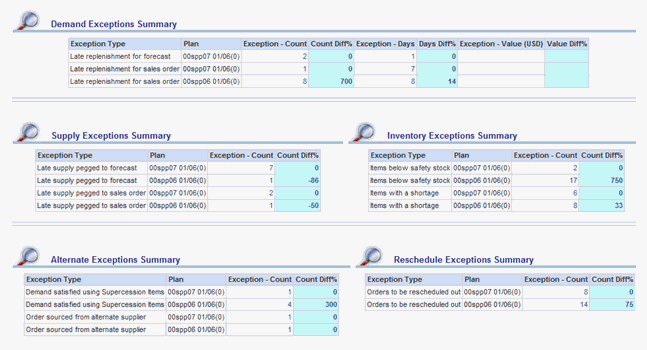
The table provides the following:
-
Ability to drill down to relevant reports (described below) from the Plan Value
-
Note that this report is a mixed report in that some of the exceptions are in Dollars ($), some in Quantity, Some as Ratio and others as Count or Days.
-
In case of Exception Type as Value – reporting currency will be used.
Drill-downs
Exceptions by Category
This report is defined in the ‘Exceptions by Category’ drill-down from the Exceptions report on the Plan Health page. This report would open for the exception that the planner is drilling down from.
Exceptions by Organization
This report is defined in the ‘Exceptions by Organization’ drill-down from the Exceptions report on the Plan Health page. This report would open for the exception that the planner is drilling down from.
Exceptions by Supersession
This report is defined in the ‘Exceptions by Supersession Chain’ drill-down from the Exceptions report on the Plan Health page. This report would open for the exception that the planner is drilling down from.
Exceptions Trend
This report is defined in the ‘Exceptions Trend’ drill-down from the Exceptions report on the Plan Health page. This report would open for the exception that the planner is drilling down from
Exceptions by Supplier
This report is defined in the ‘Exceptions by Supplier’ drill-down from the Exceptions report on the Plan Health page. This report would open for the exception that the planner is drilling down from
Demand Supply Trend
This report is defined in the ‘Demand & Supply Trend’ report on the Demand & Supply Page. This report would open with the Measure Total Demand selected
Using the Service Level Agreement Analysis Page
This page allows comparing plans on service levels, costs, inventory and profitability, and is ideally suited to evaluate contracts and service levels. In case of a new service level agreement, it is possible to compare two plans, with and without the agreement, to evaluate the impact of taking up the contract, on inventory value, profitability, costs etc. Thus, this report can aid the planner in deciding whether or not to take up a new contract or SLA.
Note: The reports in this section are based on Inventory Optimization plans.
Page Layout
This page includes the following reports:
-
SLA Summary
-
SLA Comparison Across Plans
-
Service Level Analysis – Most & Least Compliant
-
Profitability Analysis
-
Safety Stock across Plans
Page level Filters
The following page level filters are provided to the user:
| Baseline Plan | A drop down with a list of baseline plans. Only one selection is possible. |
| Comparison Plan | A drop down with a list of plans from which the comparison plan may be selected. Users have the ability to select multiple plans from this list. . |
| Category | A drop down with a list of Categories. User have the ability to select multiple categories from this list. |
| Organization | A drop down with a list of Organizations. User have the ability to select multiple organizations from this list. |
| Planner | A drop down with a list of planners. User have the ability to select multiple planners from the list. |
| Period Start | This allows one to select the date from which the report display begins |
SLA Summary Report
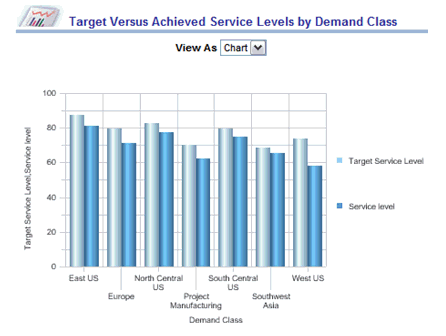
This report enables you to review multiple plans simultaneously along several dimensions, to see if SLAs are being met, and the profitability of the individual plans. A service organization may have service level agreements with several customers, in which case, this report helps look at the Target vs. Planned service levels in the two plans. It is also possible to compare inventory values, different costs (like Purchase Cost, Repair costs, carrying costs, transportation cost) revenue, profit, etc, between the selected plans.
The format of the report is shown below:

Drill-downs
Target vs Achieved Service Levels by Demand Class
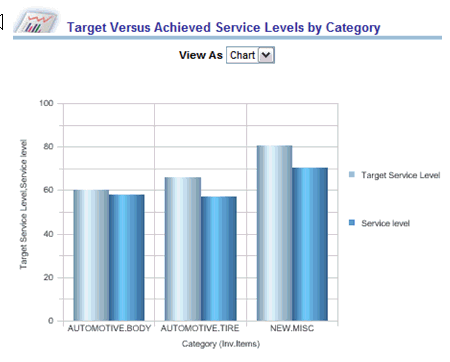
Target vs Achieved Service Levels by Category
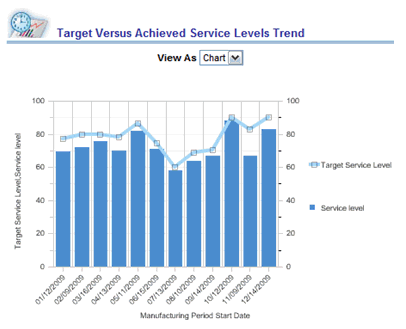
Target vs Achieved Service Levels Trend
Top Contribution to Costs
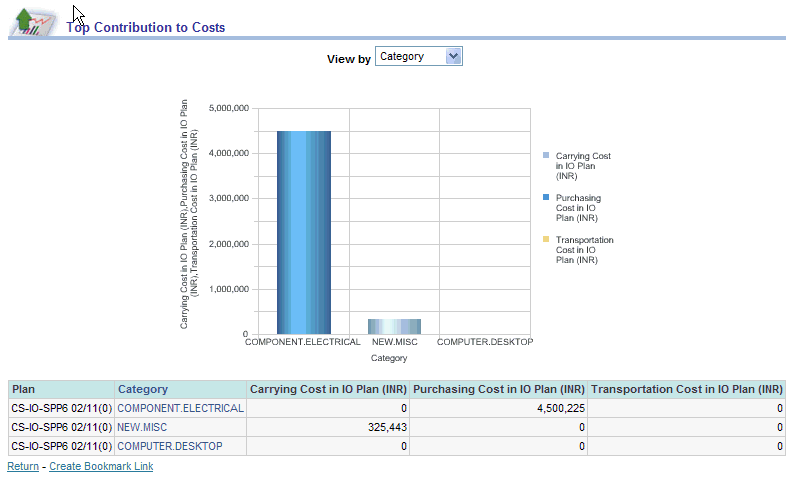
Note: The View By can be by Category, Organization
Note: The View By can be by Demand Class, Category, Organization
Top Contribution to Profit
Note: he View By can be by Category, Organization
SLA Comparison Across Plans Report
This report enables a planner to compare Service Levels Agreements / Contracts, across plans.
Filter dimensions
The planner specifies the following at the report level:
-
Measure: The measure on which the planner wants to compare the two plans. Allowed meaures are: Target Service Level, Achieved Service Level, Total Revenue
-
View As: to specify whether the report should be displayed as a Chart or Table.
Report Description
This report allows the planner to compare service level agreements in two plans along different measures. The plans to be compared are specified as page level filters. The report compares the SLAs planned for in the two plans, based on the measure selected, and the report is displayed either as a Graph or as a Table, depending on the User’s report level selection.
The layout of this report is shown below:
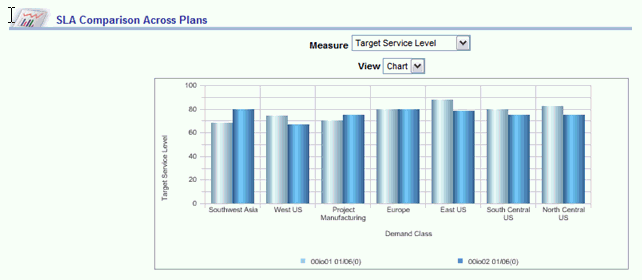
It can also be viewed as a table, as follows:
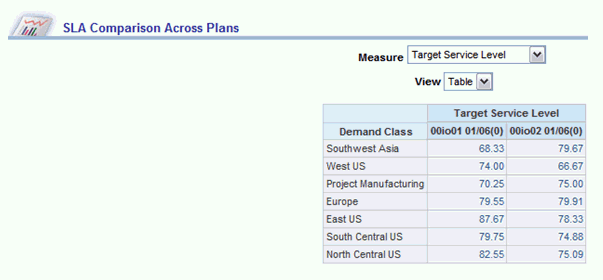
Drill-downs
Target vs. Achieved Service Level – by Category
This report is similar to the Target vs. Achieved Service Level by Category drill-down from the SLA Summary screen. The report opens in the context of the Demand Class from which the planner drills down to this report.
Target vs. Achieved Service Level Trend
This report is similar to the Target vs. Achieved Service Level Trend drill-down from the SLA Summary screen. The report opens in the context of the Demand Class from which the planner drills down to this report
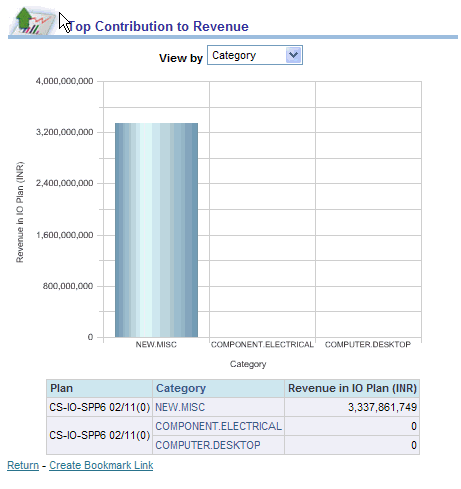
Top Contribution to Revenue
This report is similar to the Top Contribution to Revenue drill-down from the SLA Summary screen. When the planner selects this drill-down a second level selection determines the dimension on which the planner wants to view the Top Contribution to Revenue (Demand Class, Category) . The report opens in the context of the Demand Class from which the planner drills down to this report.
Service Level Analysis Report
This report has two constituent reports, allowing a planner to analyze a plan and identify service level agreements with the least and most deviation from agreed targets. It allows you to identify service level contracts with the least and greatest deviation from target. The layout of the report is shown below:

Drill-downs
Target vs. Achieved Service Level – by Category
This report is similar to the Target vs. Achieved Service Level by Category drill-down from the SLA Summary screen. The report opens in the context of the Demand Class from which the planner drills down to this report.
Target vs. Achieved Service Level Trend
This report is similar to the Target vs. Achieved Service Level Trend drill-down from the SLA Summary screen. The report opens in the context of the Demand Class from which the planner drills down to this report
Profitability Analysis Report
This report helps identify the most and least profitable items in the service supply chain. The layout of the report is shown below:
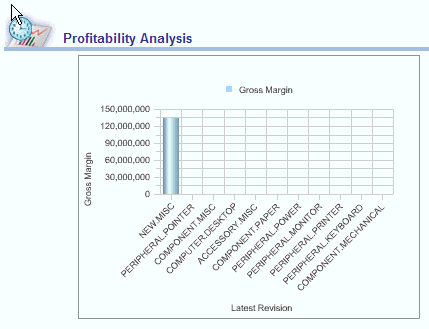
Drill-downs
Target vs. Achieved Service Level Trend
This report is similar to the Target vs. Achieved Service Level Trend drill-down from the SLA Summary screen. The report opens in the context of the item from which the planner drills down to this report
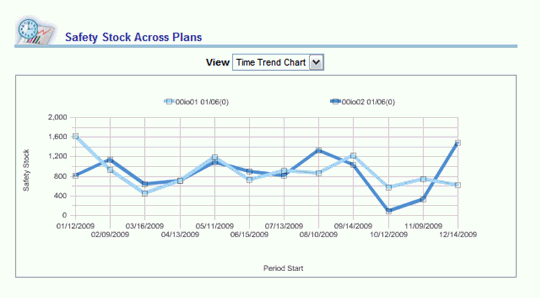
Safety Stock Across Plans Report
This report helps compare safety stock targets between multiple plans. The layout is shown below:
Drill-downs
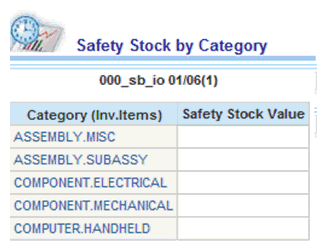
Safety Stock by Category
This report shows the safety stock targets by category for the plan that is drilled down from.
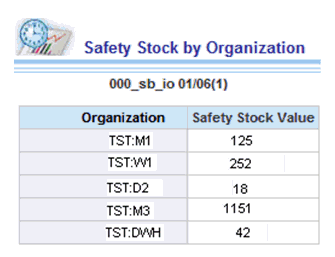
Safety Stock by Organization
This report shows the safety stock targets by organization for the plan that is drilled down from.
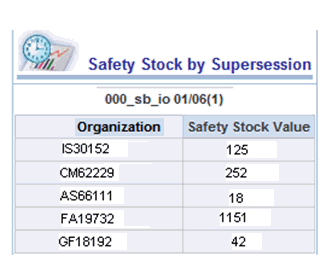
Safety Stock by Supersession Chain
This report shows the safety stock targets by supersession chain for the plan that is drilled down from.
Using the Historical Performance Page
This page has reports that allow users to assess the supply chain performance from period to period. It page contains historical information and provides the ability to compare previously Planned value to Actuals in those past periods
Page level Filters
The following page level filters are provided:
-
Archived Plan: A drop down with a list of plans to be used as the baseline. Only one selection is possible.
-
Period: Provides the ability to select the date range over which reports will be displayed

Service Supply Chain Performance Report
Filter dimensions
The user is able to filter the table across the following dimensions in addition to the page level filters:
-
Time 1: A drop down with a list of start dates corresponding to the selected Time Type from which the baseline period is selected. Only one selection is possible.
-
Time 2: A drop down with a list of start dates corresponding to the selected Time Type from which the comparison period may be selected. Only one selection is possible.
Report Description
This report helps you analyze performance metrics in Period Time 1 and compare supply chain metrics between periods Time 1 and Time 2. The table representing this report and its layout is presented below
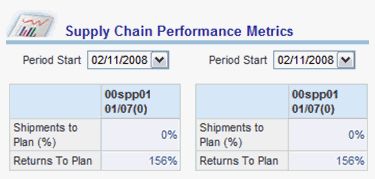
The table provides the following:
-
Ability to drill down to relevant reports .
-
Shipments to Plan is computed as: (Shipments History) / (Consensus Forecast)
-
Returns to Plan is computed as (Returns History) / (Consensus Returns Forecast)
-
The actuals (Shipments, Returns) required for computing these measures may be obtained from history data.
Drill-downs
Top Demands
This is the same as the ‘Top Demand’ report in the Demand & Supply Page. This should be viewable by Category, Organization, Zone and Supersession.
Top Returns
This is the same as the ‘Top Returns’ report in the Demand & Supply Page, and is viewable by Category, Organization, Zone and Supersession.
Shipments to Plan
This report is similar to the ‘Shipments to Plan’ report detailed below.
Returns to Plan
This report is similar to the ‘Returns to Plan’ report detailed below.
Exceptions Summary
This report is similar to the ‘Exceptions Summary’ report under the Exceptions page.
Service Supply Chain Metrics – Trend Report
Report Description
This report helps you evaluate:
-
How have the key supply chain metrics been trending over time
-
How do we project them to trend in the future given the plan
The graph plots key supply chain metrics over time. It indicates how each of the supply chain metrics have been performing against the plan value both historically and looking forwards in time. If any of the metrics displays a significant deviation between periods then it is a visual indication of change.
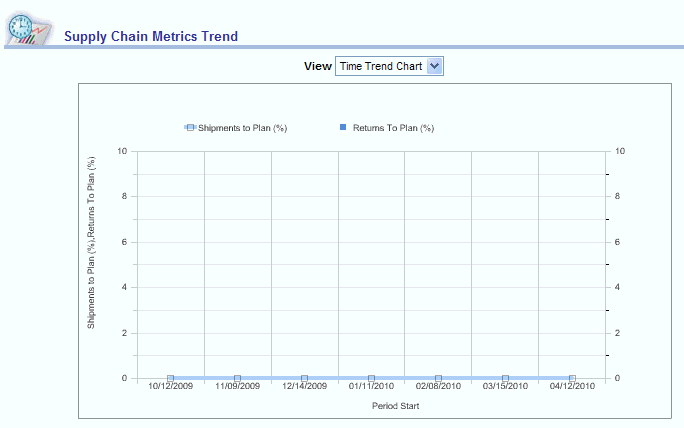
The report provides the:
-
Ability to view the data either as a graph or as a table
-
Ability to drill down to the detail reports
Drill-downs
Top Demands
This is the same as the ‘Top Demand’ report in the Demand & Supply Page, and is viewable by Category, Organization, Zone and Supersession. The Top Demands in the period from where the Planner drills down are displayed.
Top Returns
This is the same as the ‘Top Returns’ report in the Demand & Supply Page, and is viewable by Category, Organization, Zone and Supersession. The Top Returns in the period from which the planner drills down are displayed.
Shipments to Plan
This report is similar to the ‘Shipments to Plan’ report detailed below. However, the shipments to plan in the period that the planner drills down from are displayed
Returns to Plan
This report is similar to the ‘Returns to Plan’ report detailed below. The Returns against forecast in the period that the planner drills down from are displayed.
Exceptions Summary
This report is similar to the ‘Exceptions Summary’ report under the Exceptions page. Only exceptions in the period that the planner drills down from are displayed.
Shipments to Plan Report
Filter dimensions
In addition to page level filters, the following filters specified at the report level are respected:
-
Group By – The dimension on which the Top / Bottom N are to be displayed. Valid values are Category, Supersession, Zone, Organization.
For example, if the planner selects Group By=Category, the Top and Bottom N categories with Shipment to Plan are shown.
Report Description
This report consists of two graphs and shows the Planner the top and bottom Shipments to Plan, by Category / Zone / Supersession / Org. , Using this report, the planner can see which categories / zones / supersession / organizations are shipping close to planned values and which are deviating most from the plan. The graphs for this report are displayed below:
The report provides the:
-
Ability to view the data either as a graph or as a table
-
Ability to drill down to the detail reports
Drill-downs
Top Demands
This is the same as the ‘Top Demand’ report in the Demand & Supply Page. There are four different drill-downs, for Top Demands by Category, Top Demands by Organization, Top Demands by Zone and Top Demands by Supersession
Top Supplies
This is the same as the ‘Top Supplies’ report in the Demand & Supply Page. There are three different drill-downs, for Top Supplies by Category, Top Supplies by Organization and Top Supplies by Supersession
Demand & Supply Totals by Category
This report is as defined under the Demand & Supply totals by Category drill-down from Demand & Supply Summary report.
Demand & Supply Totals by Organization
This report is as defined under the Demand & Supply totals by Organization drill-down from Demand & Supply Summary report.
Demand & Supply Trend
This is the same as the Demand & Supply Trend- Base Plan report in Demand & Supply page. While that report permits the user to select multiple measures, when drilling down from here, the report opens for Total Demands vs Total Usable Supplies selected.
Exceptions Summary
This report is similar to the Exceptions Summary report on the Exceptions page.
Returns to Plan Report
In addition to page level filters, the following filters specified at the report level are respected:
-
Group By – The dimension on which the Top / Bottom N are to be displayed. Valid values are Category, Supersession, Zone, Organization.
For example, if the planner selects Group By=Category, the Top and Bottom N categories with Returns to Plan are shown.
Report Description
This report shows the Planner the top / bottom Returns to Plan, by Category / Zone / Supersession / Org. It allows the planner to see which categories / zones / supersession / organizations had returns close to forecast values and which are deviating the most from forecast. The graph for this report is displayed below:
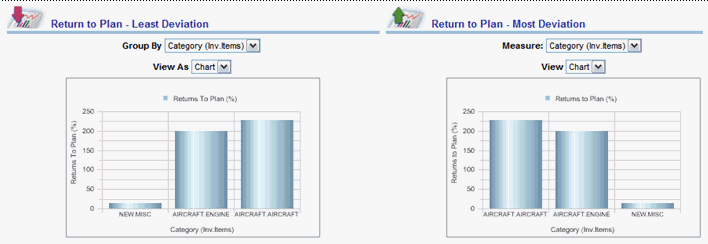
A table of values that corresponds to this chart is presented below:

The report provides the:
-
Ability to view the data either as a graph or as a table
-
Ability to drill down to the detail reports
Drill-downs
Top Returns
This is the same as the ‘Top Returns’ report in the Demand & Supply Page. When this is selected from the drill down menu, a second level of drill-down opens up, allowing the planner to specify the dimension on which he would like to see the Top Returns– that is, Top Returns by Category, Organization, Zone etc.
Exceptions Summary
This report is similar to the Exceptions Summary report on the Exceptions page.