Returns Dashboard
This chapter covers the following topics:
Overview
Returns Dashboard enables the organizations to monitor its return streams to reduce returns processing costs, recover value from returned assets, build better products, and minimize its impact on the environment. Returns Dashboard also helps to adhere to various environmental regulations such as WEEE and ROHS. These laws require organizations to take back products that a customer no longer wants, take back packaging materials, track the recycling programs and scrap contributions, and remove hazardous materials from returns and dispose them properly. Organizations require tools to help manage these new requirements, minimize their costs and provide the reporting necessary to comply with the legislation.
The Returns Dashboard enables you to perform the following:
-
Monitor how much material is being returned through each return stream: Returns dashboard helps to monitor how much material is returned from customers and the value of that material. This helps to reduce the overall number of returns, monitor the return stream to react quickly to rapidly increasing returns, and create programs to increase the recovery of higher-value assets.
-
Monitor how much scrap and hazardous material comes from returns: Companies have legal and ethical responsibility to monitor and mitigate their impact on the environment. In addition to energy consumption and carbon emissions, manufacturing and retail companies produce significant amounts of scrap and hazardous waste. Returns Dashboard provides the capability to monitor how much of the return stream ends up in scrap so that effective ways are developed to re-use and recycle materials and to build products that create less waste and hazardous material.
Returns Business Intelligence Page Overview
The Returns Business Intelligence page displays current Returns Streams and Material Disposition metrics. The header of the Returns Business Intelligence page enables you to select the time period and organizational scope for which you want to see data.

-
Year to Date displays data for the current year.
-
Quarter to Date displays data for the current quarter of the selected year..
-
The Last 7 Days allows you to pick the last seven days (inclusive).
-
Choosing a specific date displays data only for that date.
-
Choosing the current date, month, quarter or year, the Dashboard displays data for that period-to-date.
You can view metrics for across all operating units and also view metrics for any operating unit if the profile option, CSD: Returns Dashboard Visibility Level, is set to Enterprise level. If you have operating unit visibility, and MOAC is enabled, the Operating Unit field in the Returns Dashboard header requires you to pick an operating unit you have access to via MOAC setup, in order to query Returns metrics. If MOAC is not enabled and the profile is set to Operating Unit, then the operating unit field in the Returns Dashboard is not updateable and is set to the operating unit specified by the profile MO: Operating Unit.
To view the relevant return streams, enter the fields mentioned above and click the Go button. The Returns tab and Eco-Impact tabs populates with the information of the specified period.
The body of the Returns Business Intelligence page contains two tabs - Returns and Eco-Impact. For more details about these tabs, select one of the following:
Using the Returns Tab
The Returns tab displays a consolidated report of the number of units returned by the return stream

The Return Stream Comparisons region displays the following information.
-
Return Stream: Return Streams are lookups associated with an Order Management (OM) return reason code. Returns must have an OM reason code that is linked to a Return stream in order to be shown in this table.
-
Units Returned Selected Period: Represents the number of units on RMAs for the specified return stream within the period of analysis. You can query this from the Sales Order and Repair Order tables.
-
Units Returned Prior Year: Represents the number of discrete units returned to the business that map to the specified return stream during the prior year. Prior year represents same period of time as the selected period, except in the prior year. For example, if the selected period is March 1st-31st 2010, then the prior year data is returns from March 1st-31st 2009.
-
Returned Weight Selected Period: Represents the total weight of all units returned that map to the specified return stream. The weight of any item is defined for it in the Inventory Item Master.
-
Returned Weight Prior Year: Represents the total weight of all units returned during the prior year. The weight of any item is defined for it in the Inventory Item Master.
-
Returned Value Selected Period: Represents the total value of all units returned that map to the specified return stream. The value of any item is specified as the standard cost of that item in Cost Management.
-
Returned Value Prior Year: Represents the total value of all units returned during the prior year. The value of any item is specified as the standard cost of that item in Cost Management.
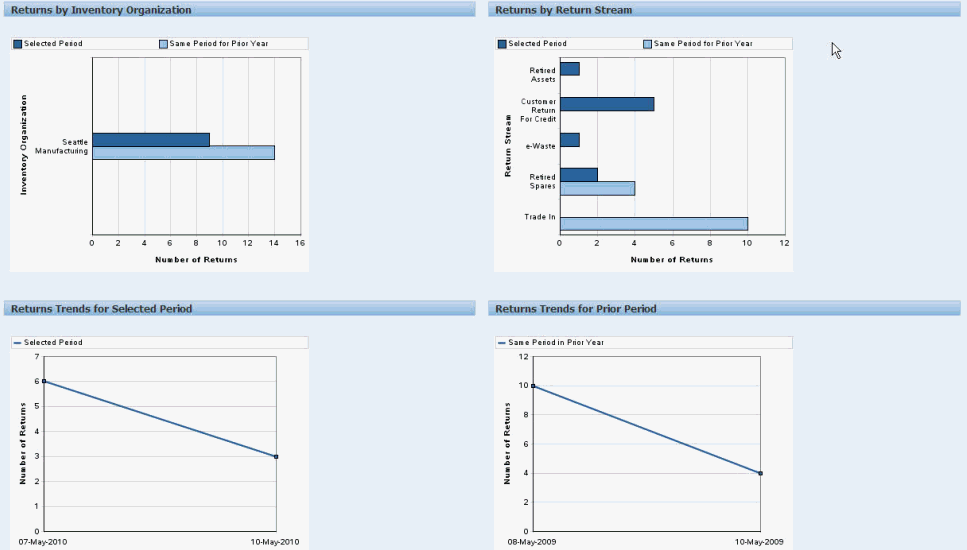
The Returns by Inventory Organization graph represents the flow of returns for a particular inventory organization for a selected period and its corresponding previous year.
The Returns by Return Stream graph represents the flow of returns for various return streams for a selected year and its corresponding previous year.
The Returns Trends for Selected Period graph shows the total flow of returns for a selected period.
The Returns Trends for Prior Period graph shows the total flow of returns for the previous period.

Using the Eco-Impact Tab
The Eco-Impact Tab provides a comparative analysis of targeted eco-impacts. The tab provides the following information:
-
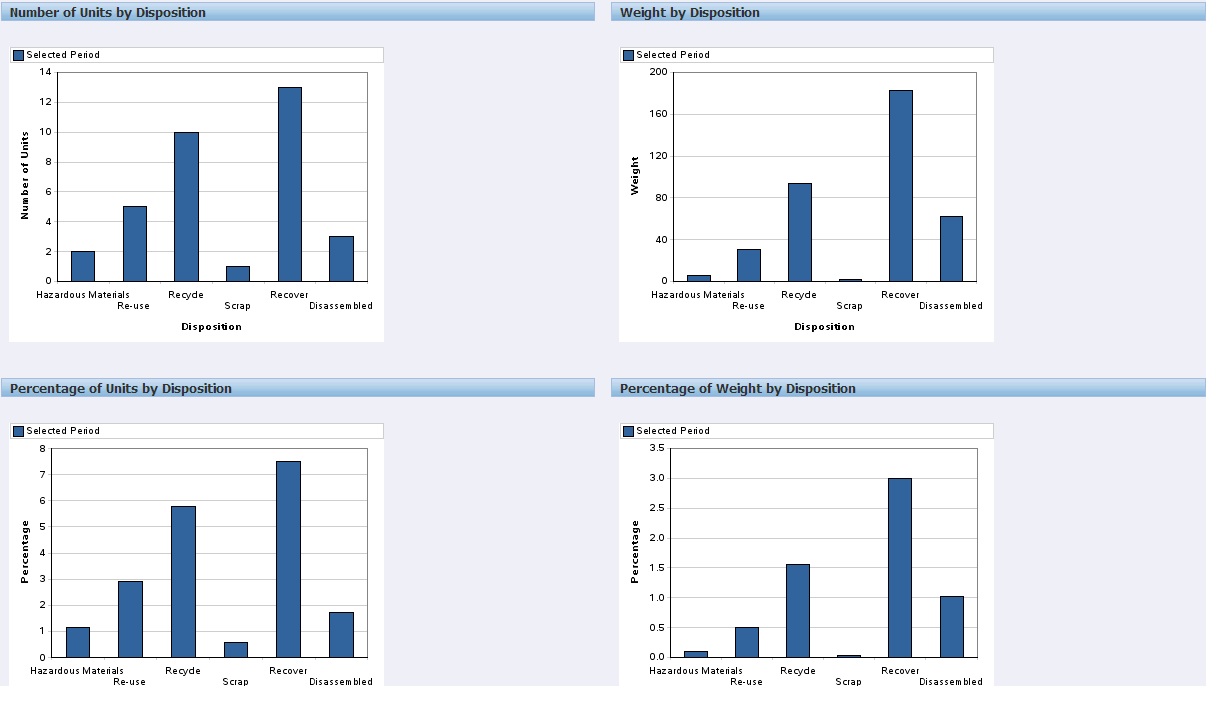
Number of Units by Disposition shows the number of units for each disposition in the selected period vis a vis the prior period and the percentage change in these periods. Green threshold indicators indicate that everything is operating within acceptable limits.
-
Weight by Disposition shows the total weight of the units transacted for each disposition in the selected period vis a vis the prior period and the percentage change. Green threshold indicators indicate that everything is operating within acceptable limits.
-
Percentage of Units by Disposition shows the number of units dispositioned against the number of units returned in all return streams expressed as a percentage.
-
Percentage of Weight by Disposition shows the total weight dispositioned against the total weight returned in all return streams expressed as a percentage.

-
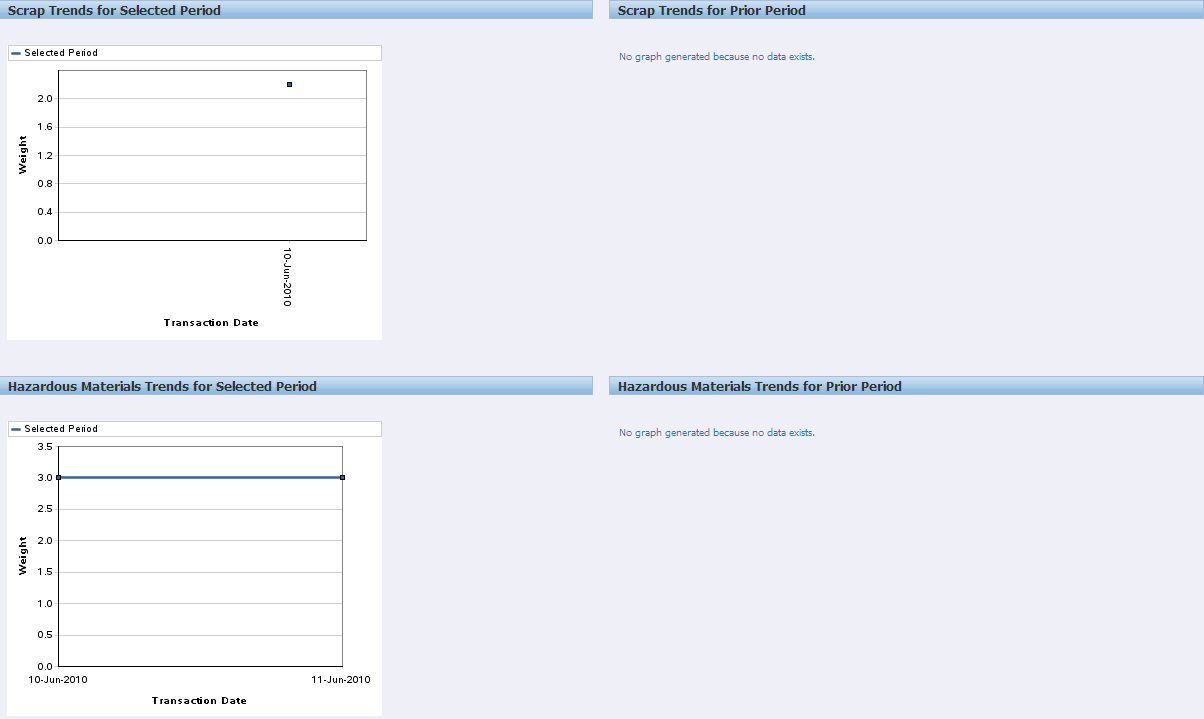
Scrap Trends for Selected Period shows time-series trends for weight of material sent to scrap during the analysis period.
-
Scrap Trends for Prior Period shows time-series trends for weight of material sent to scrap during the same period in prior year.
-
Hazardous Materials Trends for Selected Period shows time-series trends for weight of material disposed as hazardous materials during the analysis period.
-
Hazardous Materials Trends for Prior Period shows time-series trends for weight of material disposed as hazardous materials during the same period in prior year.

-
Scrap by Inventory Organization shows the weight of returned material sent to scrap for a particular Inventory Organization.
-
Hazardous Materials by Inventory Organization shows the weight of returned material disposed as hazardous materials for a particular Inventory Organization.

Note: All the Scrap and Hazardous Materials metrics are measured by the amount/weight of the materials that were WIP negative issued or returned with a reason code that belongs to the Scrap/Hazardous Materials dispositions that were setup.