Data Validation
This chapter covers the following topics:
- About Data Validation
- Overview of Data Validation Programs
- Audit Fact
- Level Value Audit
- Setting Up the Audit Query
About Data Validation
The demand planning process involves analysis of historical and forecast data from a number of sources.
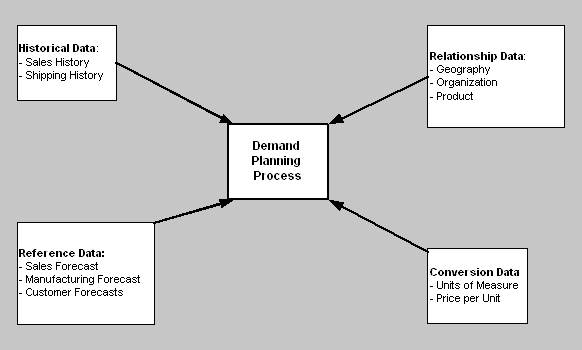
Historical data is used to analyze the sales or shipment patterns in the past to predict the future demands, usually using a statistical technique. Demand planners then use reference data such as sales forecasts, customer forecasts, and manufacturing forecasts to compare, validate, and update the forecast based on the historical data. Relationship data allows demand planners to analyze data by various ways such as by geographical areas of sales, by organizations, and by product types to identify specific pattern and trends so that adjustments can be made to the forecast, and at the same time alert organizations involved in demand and supply management.
The data from all the sources need to be accurate, and also organized in proper way to provide the needed outputs such as reliable forecasts of future demands and appropriate alerts and exchange of information with demand and supply management.
Data from the sources can be corrupted due to many reasons including bad transactions, missing transactions, human errors, computational errors, and improper format. Therefore, it is very important that a validity check on the data is performed to ensure the no errors are present in the data used by the demand planning process.
Overview of Data Validation Programs
Oracle Demand Planning provides tools to validate the various types of data needed for demand planning. There are two programs that can be used to validate the collected data:
Audit Fact is used to validate fact data, such as:
-
Shipping Data
-
Booking Data
-
Manufacturing Forecast
-
Unit of Measurement (UOM) Data
-
Pricing Data
Level Values Audit provides the tool to check that all the relationship data have been collected correctly.
Both programs check for validity and provide summary and detailed reports to the users. Oracle Demand Planning also provides a lookup or view program to review the rules used for each of the above fact and level value validation program. This is called Audit Statement and is described later in this section.
Audit Fact
Once data such as Shipping Data, Booking Data, Currency Conversion, UOM Conversion, Manufacturing Forecast, and Sales Opportunity have been collected from the source, the Audit Fact allows users to verify nonexistent dimension values in the fact data.
In Audit Fact, preseeded queries handle fact validation, such as correct item, item references in interclass unit of measure conversions, and item references in price list data. Whenever there is a discrepancy between a fact data and corresponding level value data, then a highlighted flag appears in the Audit Fact report. The audit report presents the consolidated output of the auditing process reflecting the mismatched data. Audit Fact Data Report audits data for seeded as well as custom data streams, price lists, and unit of measure conversion data. It returns results in an output file.
For example, the booking history data has an organization named ABC Org. for the Organization Dimension with a corresponding identifier of Primary Key 229. However, in the level values, there is no such value corresponding to Primary Key 229. The report highlights this fact. Primary Keys are system-generated keys used for identification and cross-referencing of data elements from different tables.
The Audit Fact report also shows a consolidated display of the erroneous data by data streams lists. The report lists the data records reflecting the non-existent level values.
To run Audit Fact:
-
Choose the Demand Planning System Administrator responsibility.
-
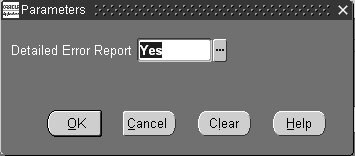
In the Navigator, select Audit Fact to open the Parameters window, which appears on top of the Pull_Utility window.
-
You can select either Yes or No in the Detailed Error Report field. If you select No, you will get a summary report. To get a detailed error report, choose Yes, then select OK to open the Pull_Utility window.
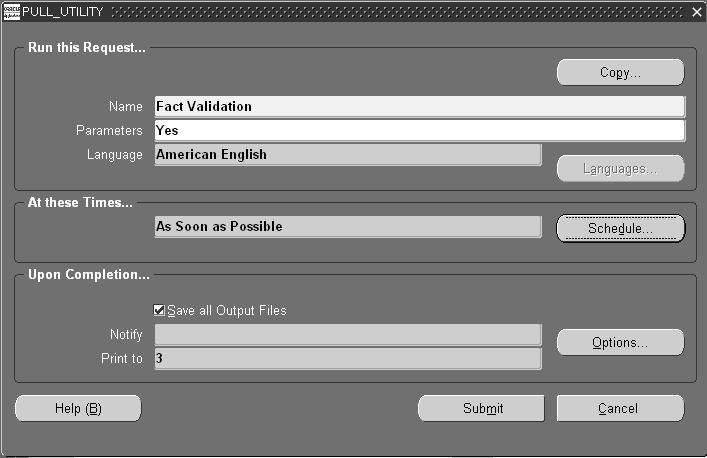
The Pull_Utility window contains the Fact Validation in the Name field and Yes in the Parameters field.
-
Select Submit. A message appears confirming that the request was submitted. Please note the Request ID.
-
Select No to close the window.
-
Select View > Requests from the main window menu bar.
The Find Requests window appears.
-
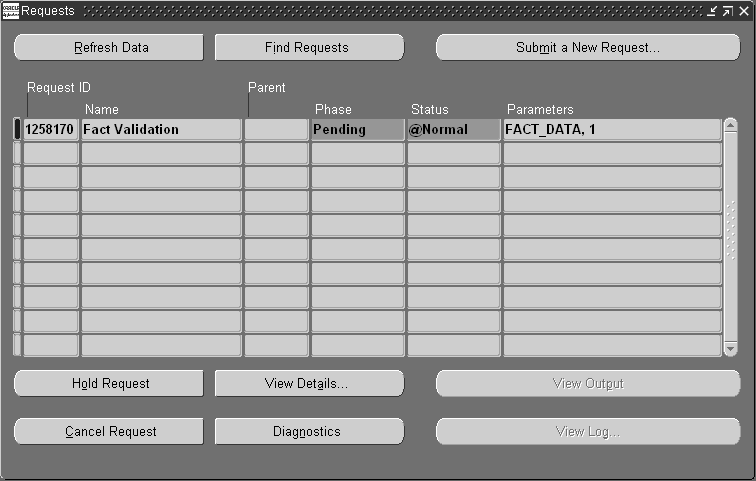
Select Find to open the Requests status window.
-
Select Refresh Data if you need to see the request status under the Request ID.
-
Select View Output to see the report.
The report shows exception message for mismatches in values between collected booking history and levels values for the dimensions where the mismatch happened. It shows primary keys (identifies a data item in a table) in red for the missing level values for the dimensions. In the above case, the Product and Organization dimensions have mismatch. This is explained in the table below that shows a sample output report. For details, see: Setting Up the Audit Query.
ROW ID Instance Item PK Org PK Channel PK Sales Rep PK Location PK Qty AAAda1AAfAAAHGqAAA 201 MMX332 0373829 INDIRECT -777 1005 10 AAAda1AAfAAAHGqAAB 201 MMX332 0373829 INDIRECT -777 1005 10 AAAda1AAfAAAHGqAAC 201 MMX332 0373829 INDIRECT -777 1005 10 AAAda1AAfAAAHGqAAd 201 MMX332 0373829 INDIRECT -777 1005 10
The following table explains the function of each column in sample output report:
| Column | Function |
|---|---|
| ROWID | System-generated ID for the row. |
| Instance | Name of the source instance. |
| Item PK | Primary Key of the item for which there is no corresponding collected level values. The program looked at the Primary Key MMX332 in the level value table and there was no value for Primary Key MMX332 for the Product dimension. In other words, there is a missing value for Product Dimension at Item Level in level value table. |
| Org PK | Primary Key of the Organization for which there is no corresponding value in the collected Organization Level value. This is flagged in red. |
Other primary keys for the rest of the dimensions are also shown as a reference. Some examples of dimensions: Sales Channel, Sales Representative, and Organization. They indicate the primary keys that can be used to locate the records in the booking history table for these dimensions.
The program checks for mismatches between the tables where data is collected and the tables where level values are collected. For example, it checks shipping history table, price conversion table, and the Unit of Measure table. Then it flags for mismatches with corresponding level values.
The result of any mismatch does not prevent building demand plans. A demand plan with missing data just does not use the data, and produces incomplete results for demand planners.
As shown in the sample output report, the shipping history table does not have corresponding level values. To prevent this problem, you must check the values in the level value tables and fact tables, identify the root cause, and rectify the problem. The problem may have arisen due to many reasons, such as a change in an item number or an organization name change.
Level Value Audit
This validation program is used to verify missing level values in the hierarchies. After the level value data collection, you can use this feature to verify whether there are any missing level values from level value collections. For example, for a geography dimension, you can verify whether the Ship To locations roll up to regions.
Level Value Audit enables you to:
-
Verify that the collected hierarchy level values are accurate and there is no missing data for a particular hierarchy level.
-
Display the inaccurate or missing level values.
-
Clean up inaccurate records before forecasting.
Validate composite calendars loaded by you.
To run the Level Value Audit:
-
Choose the Demand Planning System Administrator responsibility.
-
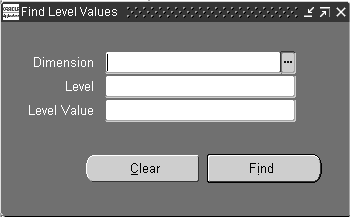
To open the Find Level Values window, select Dimension Values > Level Values in the Navigator.
-
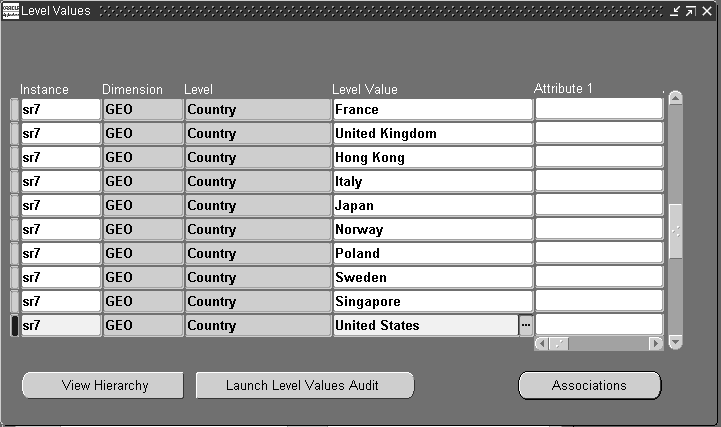
Select values for the Dimension and Level fields and select Find to open the completed Level Values window.
-
The View Hierarchy button is described in Graphical Display of Hierarchies.
Selecting Associations enables you to find a higher level value (parent) for a selected lower level value (child) for a dimension. For example, for the Geography dimension, if a country name such as United States is selected, it shows its corresponding area (or parent), which is North America.
-
Select Launch Level Values Audit.
A note appears, which indicates that the request has been accepted and being processed.
-
Select OK to close this window.
-
Select View > Requests from the main menu.
-
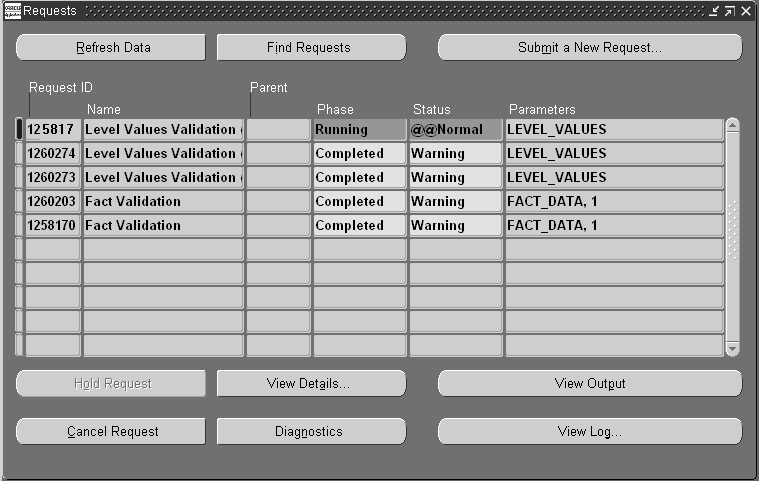
Select Find to open the Requests status window.
-
Select View Output to see the report.
The following two tables are a sample report:
Checking for level values at aggregate levels that have no children:
| Level Value | Level | Child Level |
|---|---|---|
| France | Region | Ship to Location |
| Test Group | Customer Class | Customer |
Results in two errors.
Checking for parentless level values:
| Level Value | Level | Parent Level |
|---|---|---|
| AS011062 | Item | Product Category |
| PLT100 | Item | Product Category |
| SEE102 | Item | Product Category |
| SEE103 | Item | Product Category |
| France | Region | Country |
Results in five errors.
In the example output above, there are two situations of missing relationships displayed. One is childless parent and another is parentless child. For the parent France at the level Region there is no child record at the lower level Ship To Location. Similarly, in the second example, for child Item AS011062, there is no corresponding parent at Product Category level.
The above problem can happen due to the dynamic nature of a business. As business changes, hierarchical relationships may also change. For example, if a Product Category changes, but no one changes the relationship with the Items, this type of problem can occur.
If such a problem is detected, the result could be misleading in demand planning. For example, if there is a sales booking from a ship to location in France, Demand Plan does not detect the booking.
In order to prevent this problem, you need to find out root causes for the missing relations and ensure that problems are corrected in data source tables (for example, Relationship Tables) from where these relationships are collected in the demand planning.
Setting Up the Audit Query
Sets of base queries have been seeded into the core application for both Audit Fact and Level Values Audit. You can review these query statements by following the directions below. Furthermore, implementation consultants, or users with limited SQL experience can add or modify this set of preseeded queries to provide custom detailed validation, or to format the output of existing audit statements.
To setup an Audit Query:
-
Choose the Demand Planning System Administrator responsibility.
-
In the Navigator, select Setup > Audit Statement.
-
From the menu bar select View > Find while the cursor is on the Name area.
A list of predefined audits appears.
-
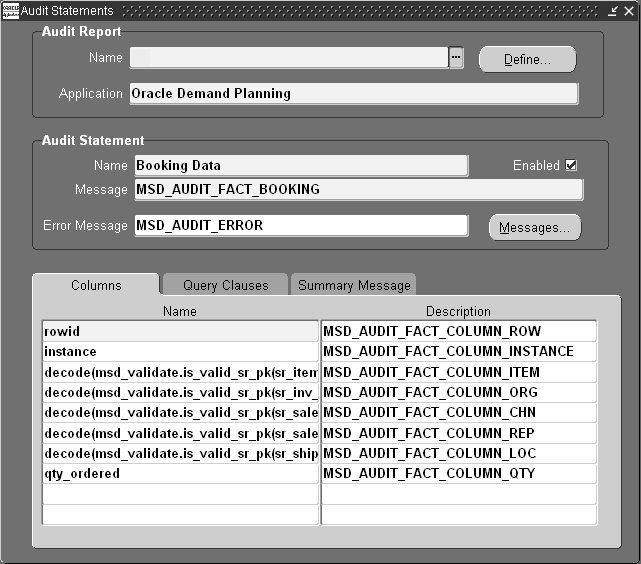
Choose any of the Audit Statements (e.g., Booking Data), to open the Audit Statements window with the list of audits.
-
The following table lists the names of the fields, their functions, and legal values that appear in this window:
Field Function Legal Values (Audit Report) Name User-defined name of the audit report. List of Values Define... button Brings up FND form which lets you modify, create, or delete audit report. Not applicable (Audit Statement) Name System-provided name of a preseeded audit statement. Not applicable Enabled check box Indicates whether to execute the Audit Statement. Checked or unchecked Message Gives the FND message that is output before the statement is run. Not applicable Error Message Name of an error message that is displayed when the audit statement query retrieves any errors. Not applicable Messages... button Allows you to define the specific error text that is displayed in the error message above. If the special token &COUNT has been included in this error text, it displays as the number of errors retrieved. Not applicable Columns tab: Name column The Columns tab lists the columns of the query. Name is the actual column name or SQL expressions. Not applicable Columns tab: Description column This field is optional. It refers to FND messages that are written as column headers in the report's output. Not applicable -
If you want to change the FROM and WHERE clauses of your SQL query, select the Query Clauses tab.
-
If you want to define a Summary Message for the fact validation or level value validation, select the Summary Messages tab.
Use the information in the following table to fill out the fields in this tab:
Field Function Show only summary message in output check box When you run Validate Fact or Validate Level values, you have a choice of whether to display a detailed report or a summary report. Use this check box to display one or the other. To display a summary report, check this box. To display a detailed report, do not check this box. Summary Message Enter the name of the Message. This text can contain a number of user-defined token (variable) values. Token Column Enter the name of the token in the message. Value Column Enter the SQL code that will define the value of the token.