Plant Manager Dashboard
This chapter covers the following topics:
- Overview of the Plant Manager Dashboard
- Asset Performance (OEE)
- Asset Performance (OEE) by Equipment
- Equipment Downtime Analysis
- Equipment Downtime Reasons
- Production Slippage Trend
- Equipment Scrap Analysis
- Equipment Scrap Reasons
- Equipment Efficiency Analysis
- Equipment Efficiency Detail
- Production Loss Analysis
- Production Loss Detail
- Production Performance
- Batch Performance
- Batch Performance Detail
- Sustainability Performance by Department
- Sustainability Performance by Equipment
- Sustainability Performance Equipment Hourly Summary Page
- Sustainability Performance Equipment Hourly Detail Page
Overview of the Plant Manager Dashboard
Overall Equipment Effectiveness (OEE) is a key metric that every plant manager monitors. The Plant Manager Dashboard provides a complete view of the equipment and helps the plant manager to assess where the source for production losses occur. The Plant Manager Dashboard and integrated reports provide the plant manager views of the production data for the plant in terms of overall equipment effectiveness, batch performance, schedule adherence, and production loss analysis for the departments and equipment on the shop floor
Oracle Manufacturing Operations Center collects data from disparate sources into this single role-based dashboard that allows Plant Managers and staff to view manufacturing operations efficiently and effectively. The open and flexible BI technology from Oracle Fusion Middleware makes it easy to build and modify KPIs and dashboards.
The Plant Manager Dashboard lets you report and analyze electricity consumption, electricity cost, and carbon emission for an entity You can view information for all the levels of entity hierarchy, plant, department, floor, floor section, and equipment.
The following table identifies the dashboard pages and the reports made available to the Plant Manager role:
| Dashboard Pages | Reports |
|---|---|
| Asset Performance (OEE) | Overall Equipment Effectiveness by Plant |
| Overall Equipment Effectiveness By Department (Bottom Performers) | |
| Overall Equipment Effectiveness Details By Plant | |
| Overall Equipment Effectiveness Details By Department | |
| Overall Equipment Effectiveness Trend by Plant | |
| Overall Equipment Effectiveness Trend by Department | |
| Asset Performance (OEE) by Equipment | Overall Equipment Effectiveness by Department |
| Overall Equipment Effectiveness by Equipment (Bottom Performers) | |
| Overall Equipment Effectiveness Details by Department | |
| Overall Equipment Effectiveness Details by Equipment | |
| Overall Equipment Effectiveness Trend by Department | |
| Overall Equipment Effectiveness Trend by Equipment | |
| Equipment Downtime Analysis | Equipment Downtime Analysis |
| Machine Availability Ratio Trend | |
| Equipment Downtime Reasons | Downtime Reasons |
| Production Slippage Trend | Production Slippage Trend |
| Production Loss Analysis | Production Loss Distribution |
| Effective Production Capacity | |
| Production Loss Analysis | |
| Production Loss Detail | Production Loss Detail |
| Equipment Efficiency Analysis | Equipment Efficiency Analysis |
| Equipment Performance Ratio Trend | |
| Equipment Efficiency Detail | Equipment Efficiency Detail |
| Equipment Scrap Analysis | Equipment Scrap Analysis |
| First Pass Yield Trend | |
| Equipment Scrap Reasons | Equipment Scrap Reasons |
| Batch Performance | Production Variance by Product Category |
| Production Variance by Product | |
| PPM Trend (Month to Date) | |
| Batch Cycle Time Trend (Month to Date) | |
| Service Level Performance by Product Category | |
| Service Level Performance by Product | |
| Batch Performance Detail | Batch Performance Detail |
| Production Performance | Performance to Schedule Measures by Plant |
| Performance to Schedule Measures by Department | |
| Performance to Schedule Measures by Equipment (Bottom Performers) | |
| Production Slippage (Equipment) | |
| Current Month Production Slippage Trend by Department | |
| Current Month Production Slippage Trend by Equipment | |
| Sustainability Performance | Electricity Consumption |
| Electricity Cost | |
| CO2 Emission | |
| Production Value Analysis by Product | |
| Trend | |
| Ranking and Distribution |
Asset Performance (OEE)
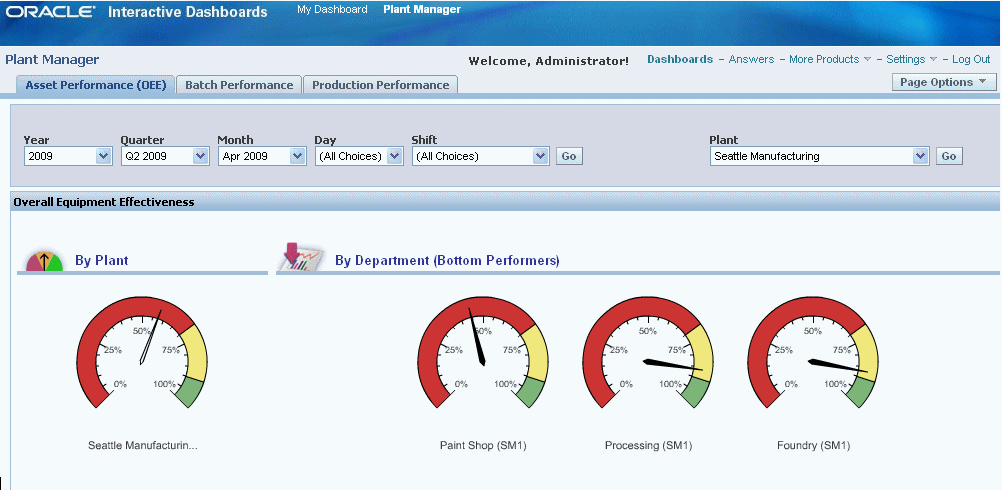
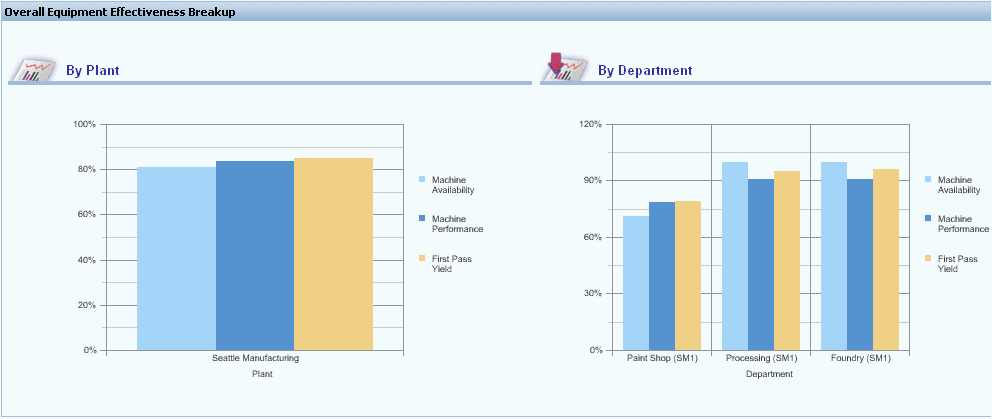
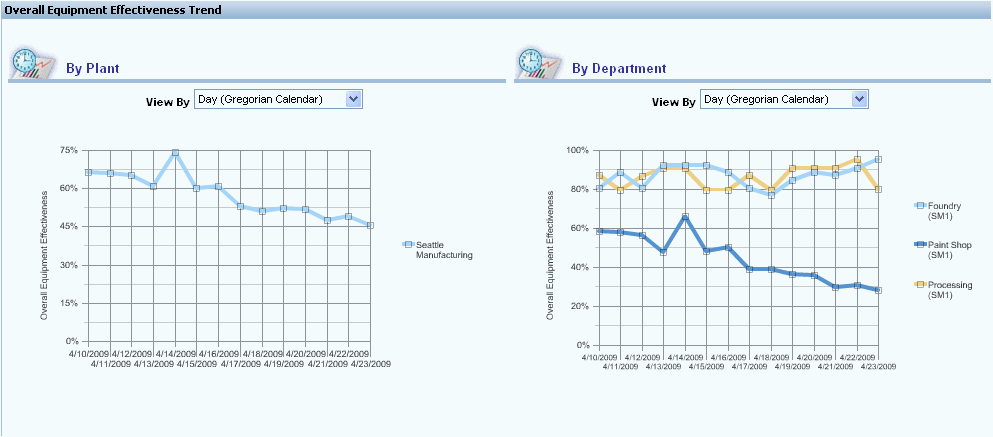
The Asset Performance page provides performance data for the plant and displays the bottom four departments performance in terms of Overall Equipment Effectiveness (OEE) measures. It displays Machine Availability Ratio, Machine Performance Ratio, and First Pass Yield. Asset Performance (OEE) reporting regions include:
-
Overall Equipment Effectiveness by Plant
-
Overall Equipment Effectiveness by Department (Bottom Performers)
-
Overall Equipment Effectiveness Details by Plant
-
Overall Equipment Effectiveness Details by Department
-
Overall Equipment Effectiveness Trend by Plant
-
Overall Equipment Effectiveness Trend by Department
You can view Asset Performance (OEE) by the following dimensions:
-
Time dimension – Year, Quarter, Month, Day, and Shift
-
Equipment dimension – Plant
To view asset performance (OEE)
-
From the Manufacturing Operations Center User responsibility, select the Plant Manager Dashboard. The Asset Performance (OEE) page appears. This page displays Overall Equipment Effectiveness, Overall Equipment Effectiveness Details, and Overall Equipment Effectiveness Trend regions.
-
Scroll down the Asset Performance (OEE) page to view:
-
Overall Equipment Effectiveness By Plant
-
Overall Equipment Effectiveness By Department (Bottom Performers)
-
Overall Equipment Effectiveness Details By Plant
-
Overall Equipment Effectiveness Details By Department
-
Overall Equipment Effectiveness Trend By Plant
-
Overall Equipment Effectiveness Trend By Department
From the Asset Performance (OEE) page, you can navigate to other pages to view additional manufacturing operations details.
-
Related Topics
Asset Performance (OEE) by Equipment
Asset Performance (OEE) by Equipment
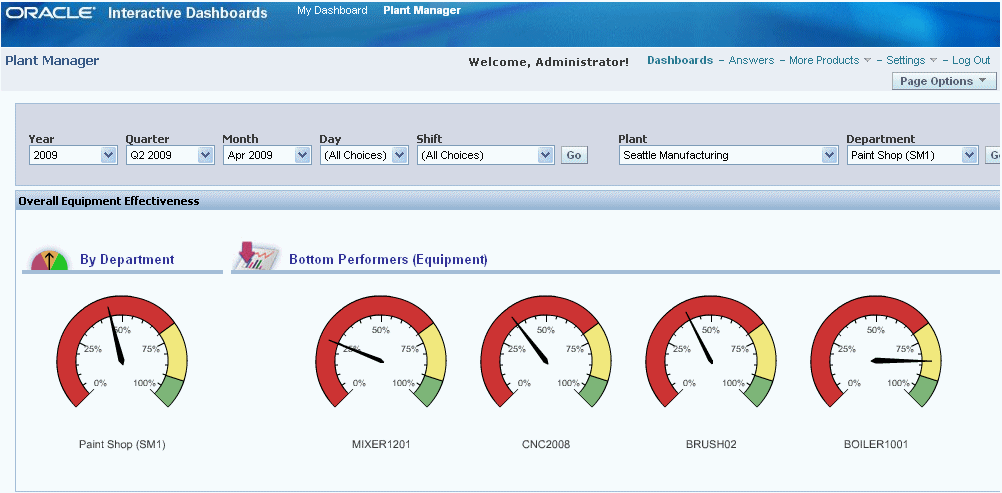
The Asset Performance page provides performance data for equipment and displays the bottom four equipment performance in terms of Overall Equipment Effectiveness (OEE) measures. It displays Machine Availability Ratio, Machine Performance Ratio, and First Pass Yield. Reporting regions include:
-
Overall Equipment Effectiveness by Department
-
Overall Equipment Effectiveness by Equipment (Bottom Performers)
-
Overall Equipment Effectiveness Details by Department
-
Overall Equipment Effectiveness Details by Equipment
-
Overall Equipment Effectiveness Trend by Department
-
Overall Equipment Effectiveness Trend by Equipment
You can view Asset Performance (OEE) by Equipment by the following dimensions:
-
Time dimension – Year, Quarter, Month, Day and Shift
-
Equipment dimension – Plant and Department
To view Asset Performance (OEE) by Equipment
-
From the Asset Performance (OEE) page, click on a Department gauge in the Overall Equipment Effectiveness By Department (Bottom Performers) region. For example, click on the Paint Shop (SM1) gauge to drill down and display details of low OEE contribution. The Asset Performance (OEE) by Equipment page displays the Overall Equipment Effectiveness (OEE) for Equipment belonging to the Paint Shop department.
-
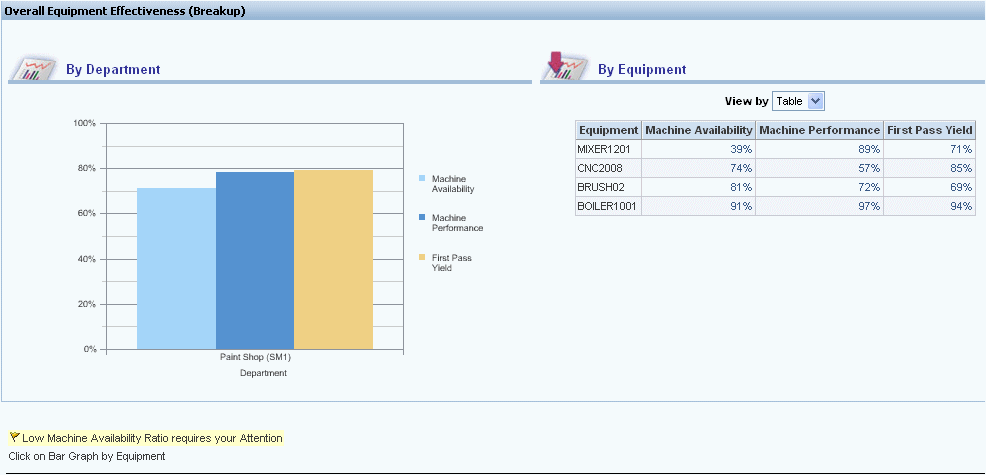
Scroll down the page to view Overall Equipment Effectiveness Details by Department and by Equipment regions. The page displays Machine Availability Ratio, Machine Performance Ratio, and First Pass Yield by Department and by Equipment.
-
Change the View by to: Table
-
Select a link in the Machine Availability column to view Equipment Downtime details. See: Equipment Downtime Analysis, and Equipment Downtime Reasons.
-
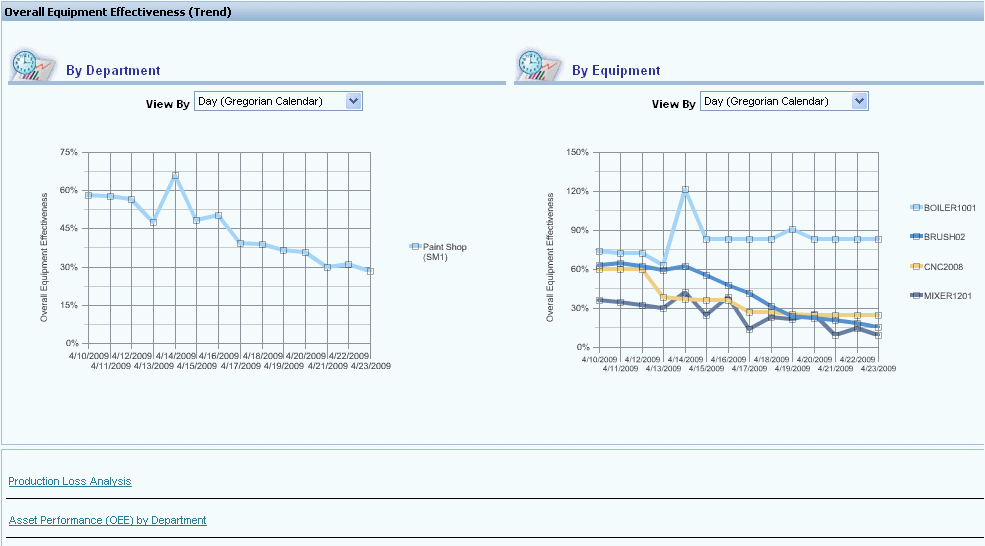
Scroll further to view Overall Equipment Effectiveness Trend by Department and by Equipment regions.
Related Topics
Equipment Downtime Analysis
You can use the Equipment Downtime Analysis page to analyze the equipment downtime by downtime reasons. Reporting regions include:
-
Equipment Downtime Analysis
-
Machine Availability Ratio Trend
-
Equipment Downtime Detail
You can view equipment downtime by the following dimensions:
-
Time dimension – Year, Quarter, Month, and Day
-
Equipment dimension – Plant, Department, and Equipment
To view equipment downtime details
-
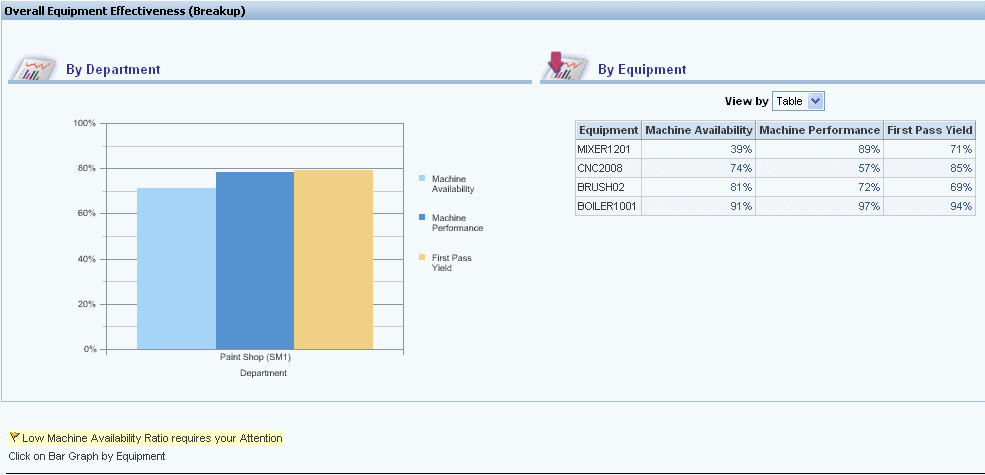
From the Asset Performance (OEE) by Equipment page, you can navigate to the Equipment Downtime Analysis page to view equipment downtime details. Scroll down to Overall Equipment Effectiveness Details by Equipment region.
-
Change the View by to: Table
-
Select a link from the Machine Availability column.
-
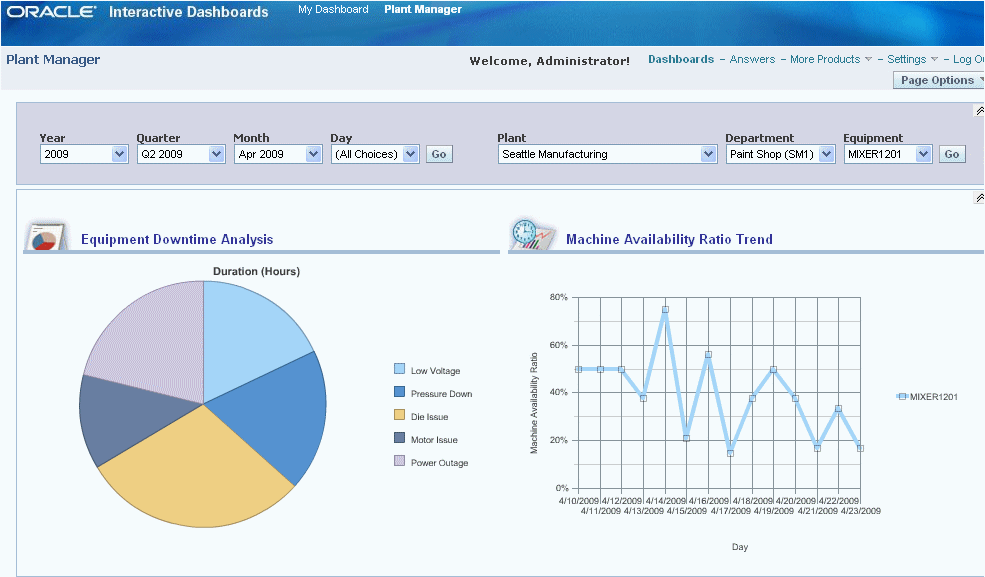
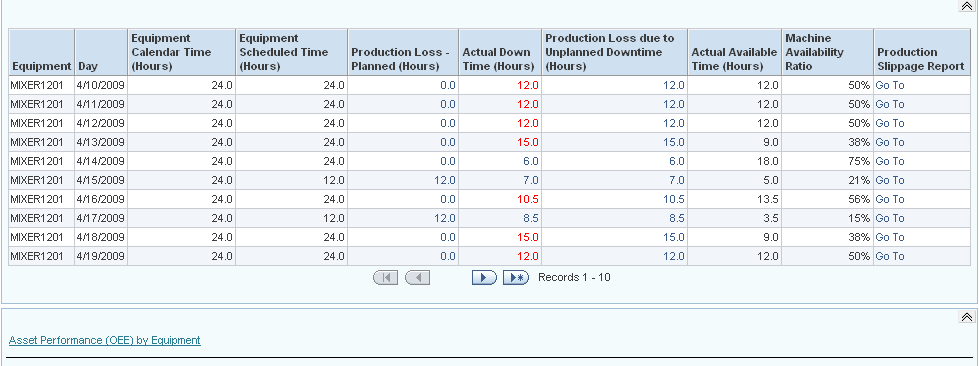
The Equipment Downtime Analysis page appears. This page displays Equipment Downtime Reasons and Machine Availability Ratio Trend graphs.
-
Scroll down this page to view daily details of equipment downtime information.
-
Select the Asset Performance (OEE) by Equipment link to return to that page.
Related Topics
Equipment Downtime Reasons
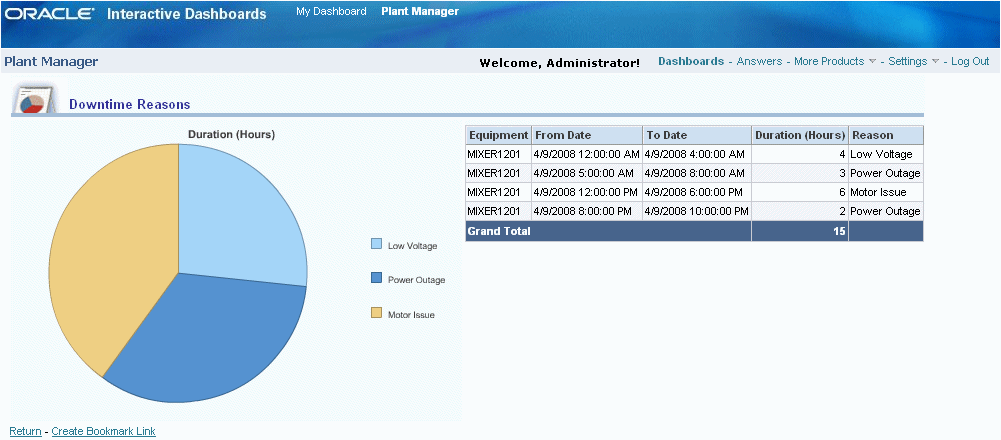
The Equipment Downtime Reasons report lets you view the downtime reasons for a particular day selected from the Equipment Downtime Analysis page. The report displays Downtime Hours and Reasons for the equipment by Shift level for the day.
To view Equipment Downtime Reasons
-
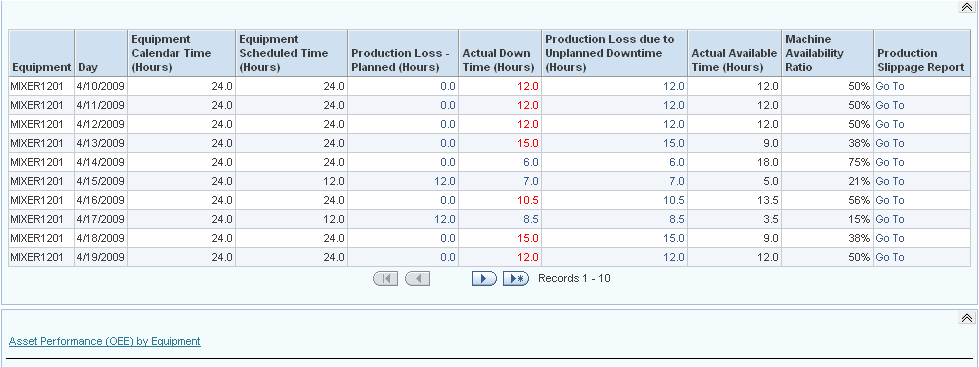
Navigate to the Equipment Downtime Analysis page and scroll down to the Equipment Downtime details region.
-
Select a link from the Actual Down Time (Hours) column. The Downtime Reasons page appears and displays Equipment Downtime reasons by Shift for the day.
-
Click the Return link to return to the Equipment Downtime Analysis page.
Related Topics
Production Slippage Trend
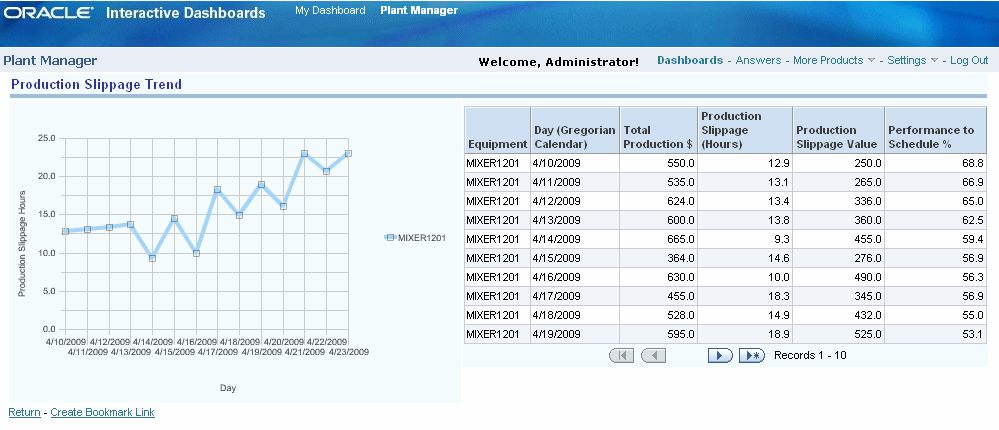
The Production Slippage Trend report displays the production slippage and trend by equipment and shift for a monthly period.
To view Production Slippage Trend
-
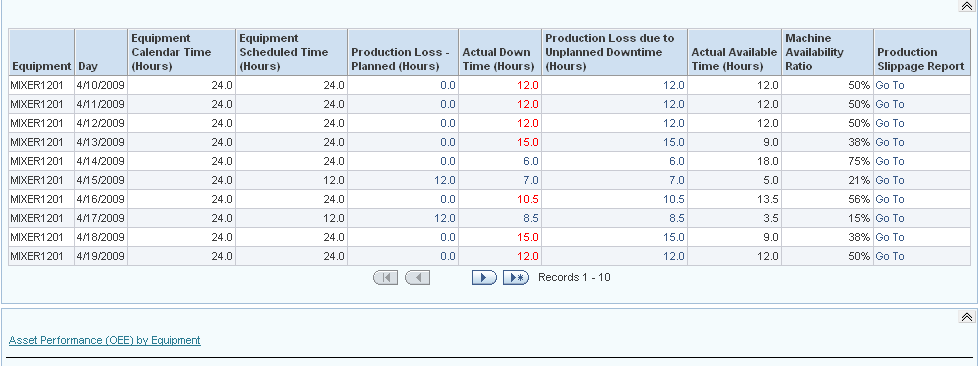
Navigate to the Equipment Downtime Analysis page and scroll down to the Equipment Downtime details region.
-
Select a link from the Production Slippage Report column. The Production Slippage page appears. The page displays production slippage measures and trend by equipment and shift for a month period.
Related Topics
Equipment Scrap Analysis
You can use the Equipment Scrap Analysis page to analyze the scrap transactions by scrap reasons. Reporting regions include:
-
Equipment Scrap Analysis
-
First Pass Yield Trend
-
Equipment Scrap Detail
You can view scrap transactions by the following dimensions:
-
Time dimension – Year, Quarter, Month and Day
-
Equipment dimension – Plant, Department, and Equipment
To view Equipment Scrap Analysis
-
Navigate to the Asset Performance (OEE) by Equipment page.
-
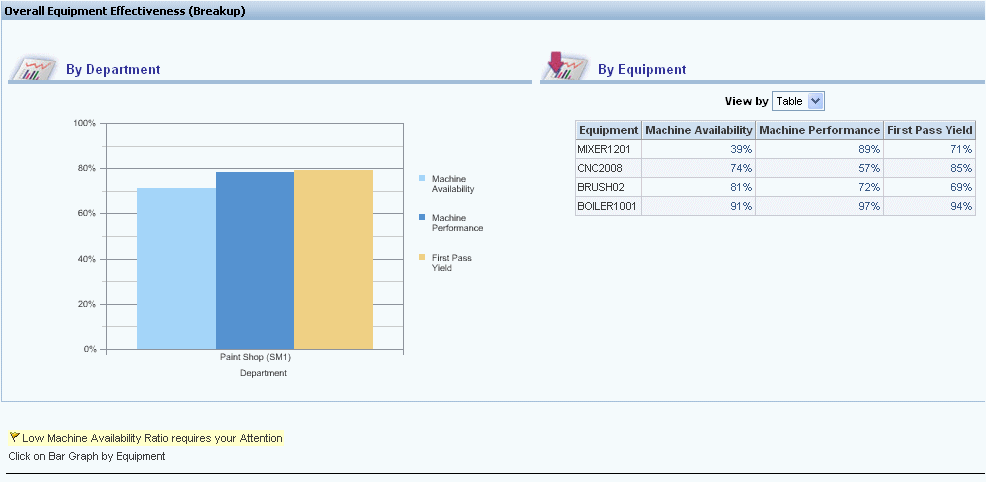
Scroll down to the Overall Equipment Effectiveness Details - By Equipment region.
-
Change the View by to: Table
-
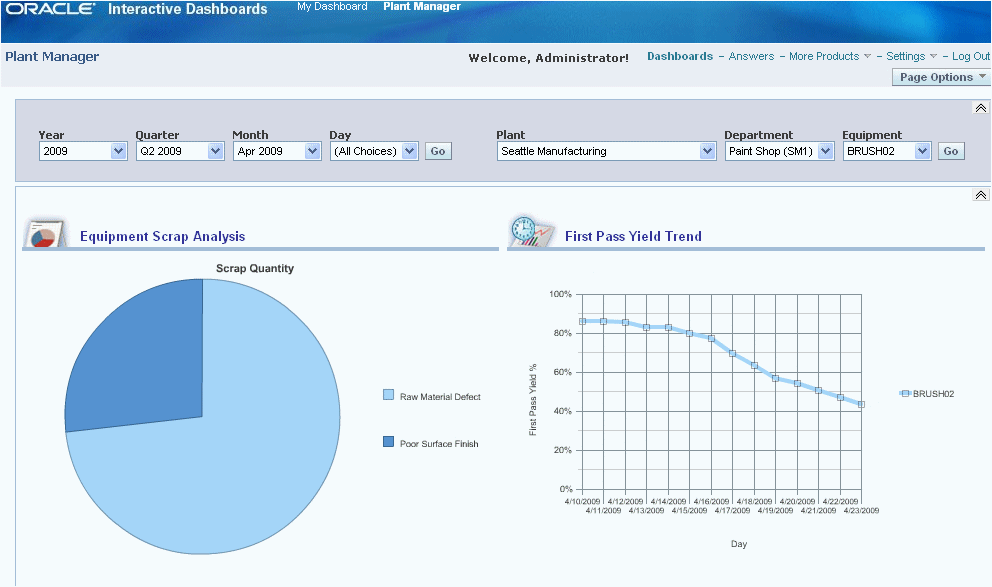
Select a value in the First Pass Yield column. The Equipment Scrap Analysis page appears where you can view quality details. This page displays Equipment Scrap Analysis and First Pass Yield Trend graphs.
-
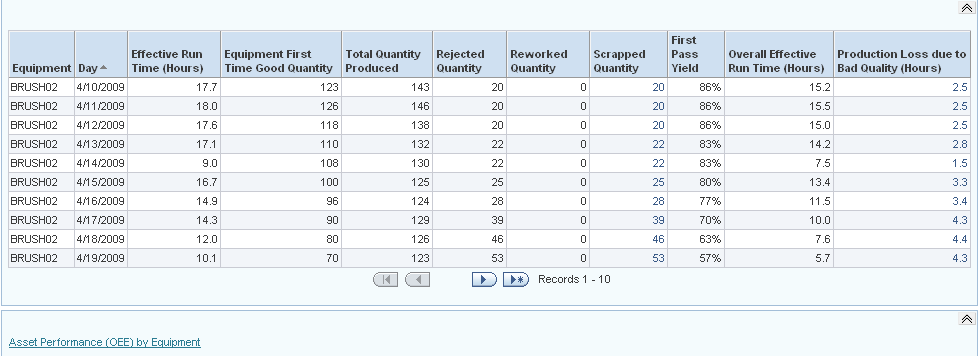
Scroll down the page to view Scrap Details.
-
Select the Asset Performance (OEE) by Equipment link to return to that page.
Related Topics
Equipment Scrap Reasons
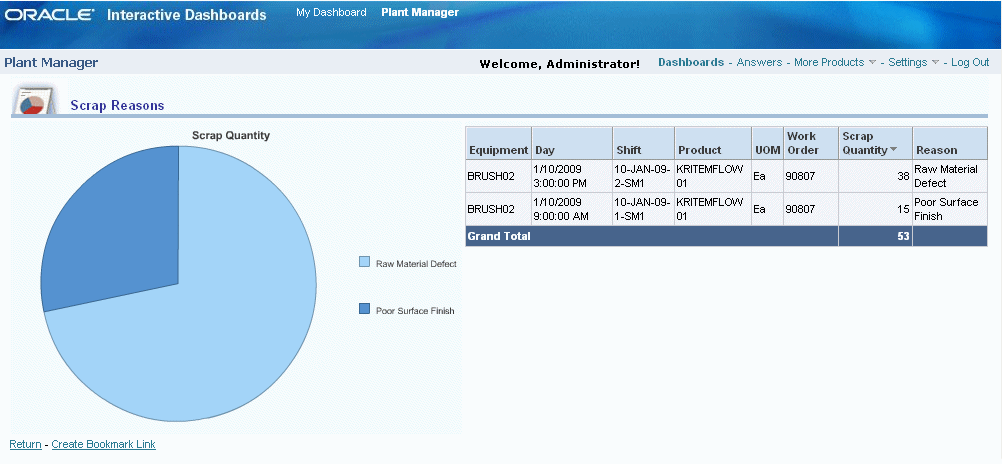
The Scrap Reasons report lets you view the scrap reasons for a particular day. Select Scrap Reasons from the Equipment Scrap Analysis page. The report displays the Scrap Quantity and Reasons for the equipment at shift level for the day.
To view Equipment Scrap Reasons
-
Navigate to the Equipment Scrap Analysis page.
-
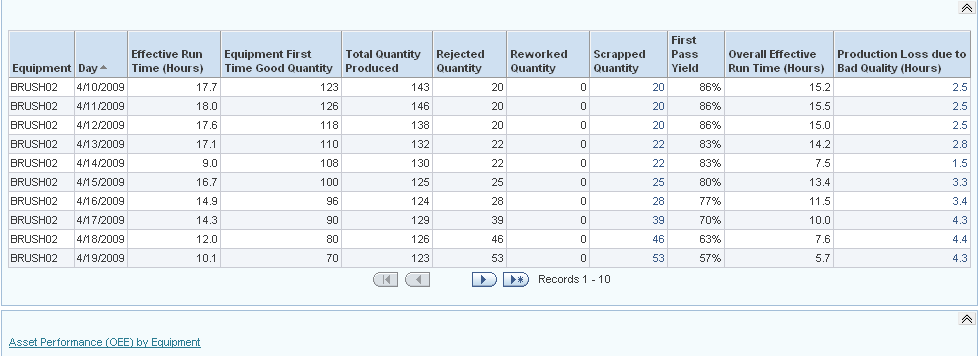
Scroll down to the Equipment Scrap Analysis Details region.
-
Select a value in the Scrapped Quantity column to view scrap details and reasons by shift for the day. The Scrap Reasons report appears.
-
Select the Return link to return to the Equipment Scrap Analysis page.
Related Topics
Equipment Efficiency Analysis
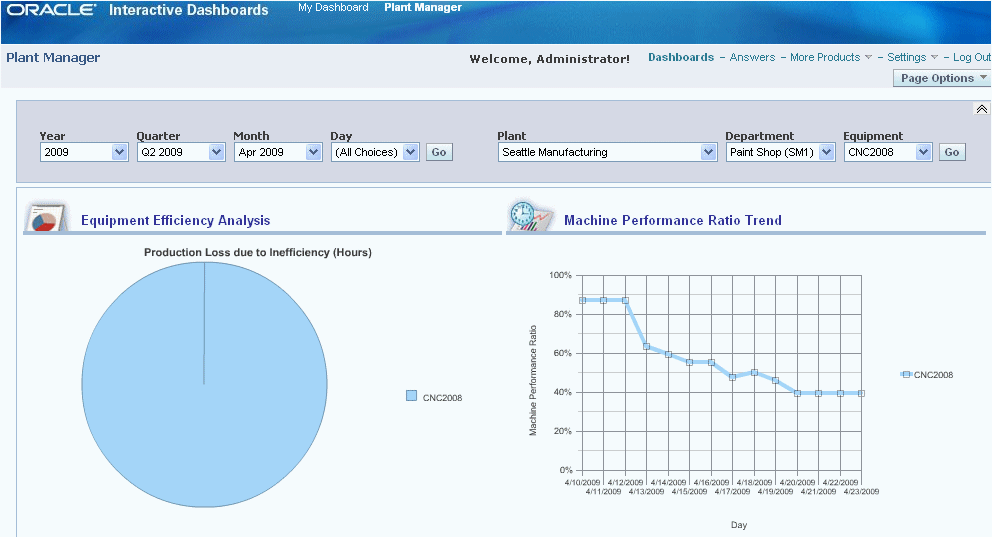
The Equipment Efficiency Analysis page displays production loss due to inefficiency of the equipment. Reporting regions include:
-
Equipment Efficiency Analysis
-
Machine Performance Ratio Trend
-
Equipment Efficiency Detail
You can view Equipment Efficiency Analysis by the following dimensions:
-
Time dimension – Year, Quarter, Month, and Day
-
Equipment dimension – Plant, Department, and Equipment
To view the Equipment Efficiency Analysis page
-
Navigate to the Asset Performance (OEE) by Equipment page.
-
Scroll down to the Overall Equipment Effectiveness Details by Equipment region.
-
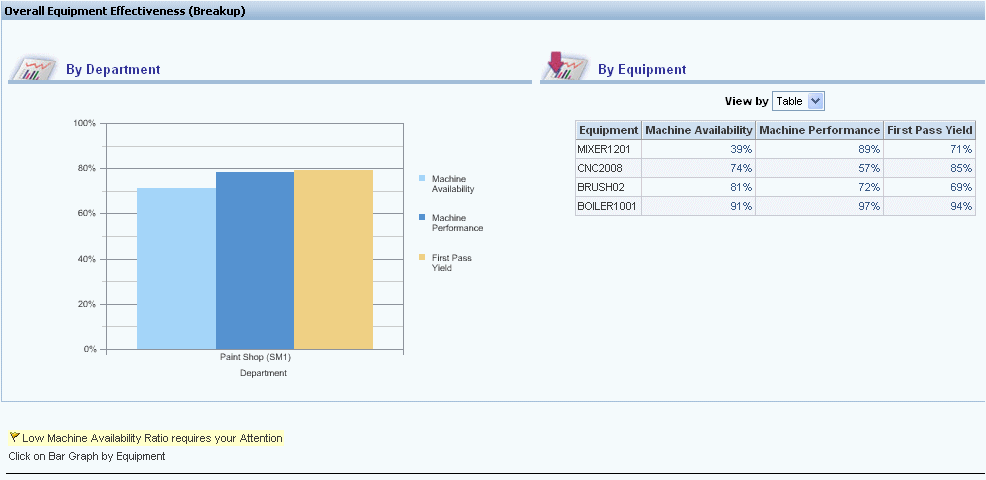
Change View by to: Table.
-
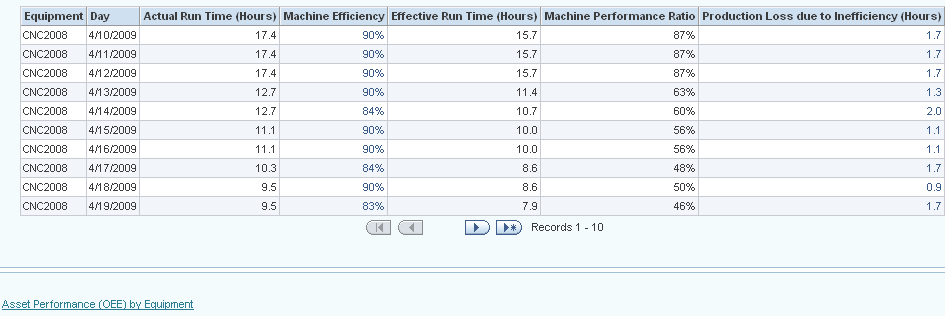
Select a value from the Machine Performance column for an equipment item. The Equipment Efficiency Analysis page appears. This page displays and reports the production loss due to inefficiency.
-
Scroll down the page to view Equipment Efficiency Details.
-
Select the Asset Performance (OEE) by Equipment link to return to that page.
Related Topics
Equipment Efficiency Detail
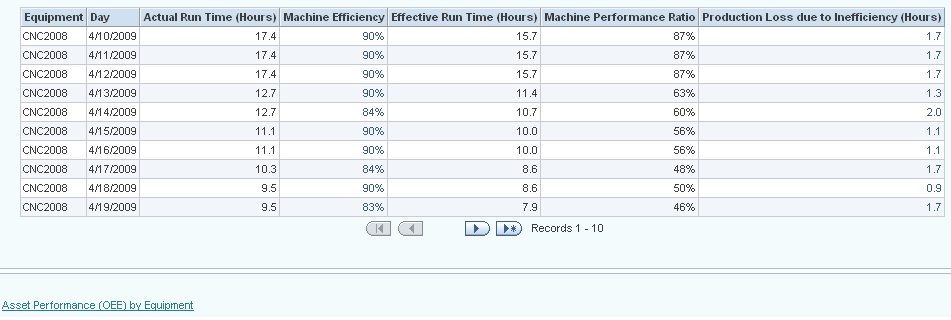
The Equipment Efficiency Detail report lets you view the Equipment Efficiency for a particular day, and is selected from the Equipment Efficiency Analysis report. The report displays the Efficiency for the equipment at shift level for the day.
To view Equipment Efficiency Detail
-
Navigate to the Equipment Efficiency Analysis page.
-
Scroll down the page to the details region.
-
Select a value in the Machine Efficiency column. The Equipment Efficiency Details report appears.

-
Select the Return link to return to the Equipment Efficiency Analysis page.
Related Topics
Production Loss Analysis
You can use the Production Loss Analysis page to analyze production loss by equipment. Reporting regions include:
-
Production Loss Distribution
-
OEE Time Analysis
-
Production Loss Analysis
You can view Production Loss by the following dimensions:
-
Time dimension – Year, Quarter, Month, and Day
-
Equipment dimension – Plant, Department, and Equipment
To view Production Loss Analysis
-
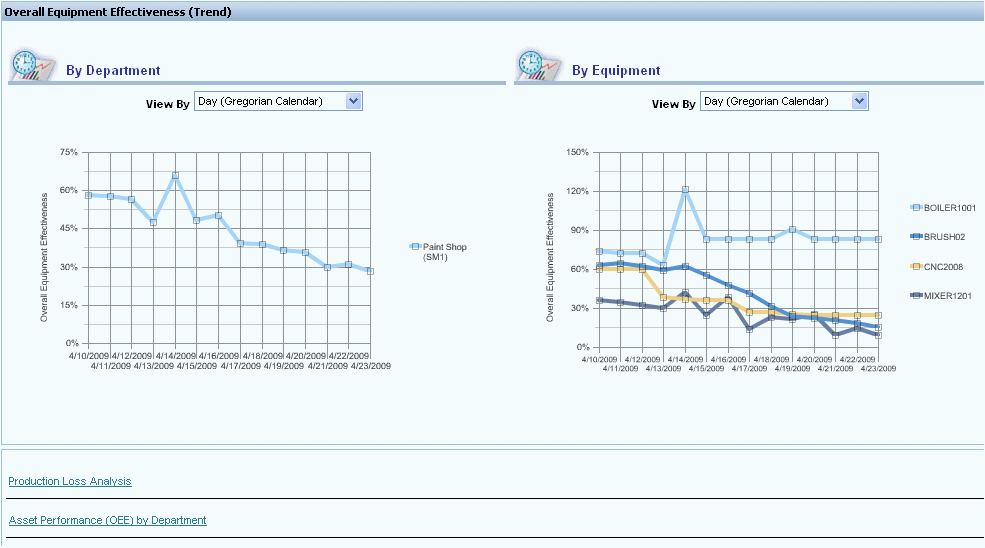
Navigate to the Asset Performance (OEE) by Equipment page.
-
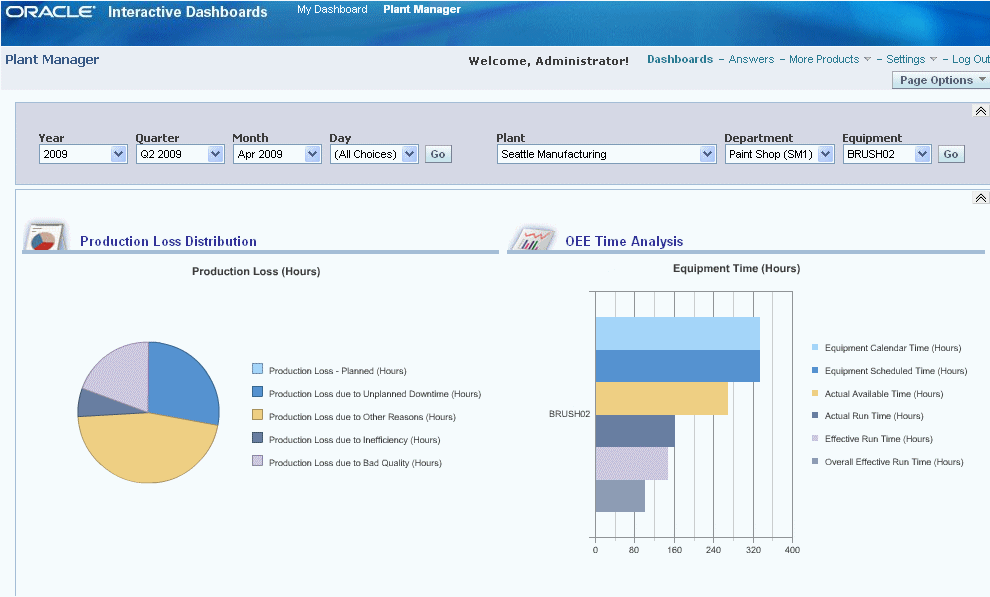
Select the Production Loss Analysis link. The Production Loss Analysis page appears.
-
The page displays the distribution of production loss as well as the OEE time metrics for the equipment.
-
The page provides the Production Loss detail and can be defined as:
-
Planned
-
Unplanned
-
Due to Other Reasons
-
Due to Inefficiency
-
Due to Bad Quality
-
-
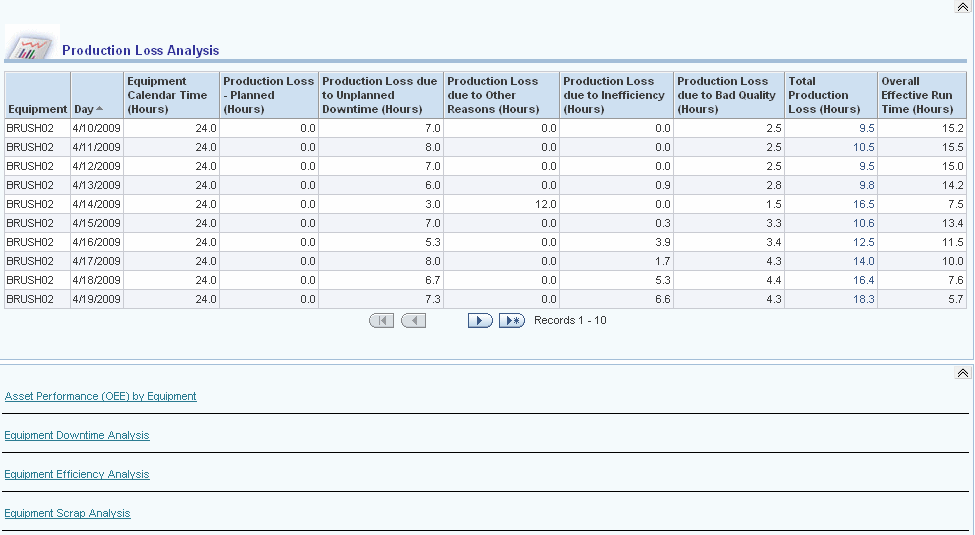
Scroll down the page to view Production Loss Analysis. This includes Total Production Loss in hours and Overall Effective Run Time in hours.
-
You can view the Production Loss Detail page by selecting a value in the Total Production Loss column and analyze the Production Loss by day and shift.
-
Select the Asset Performance (OEE) by Equipment link to return to that page.
Related Topics
Production Loss Detail
The Production Loss Detail page lets you view the Production Loss for a particular day, and is selected from the Production Loss Analysis page. The page displays the Production Loss and details for the equipment at the shift level for the day.
You can view Production Loss Detail page by the following dimensions:
-
Time dimension – Year, Quarter, Month, Day and Shift
-
Equipment dimension – Plant, Department, and Equipment
To view Production Loss Detail
-
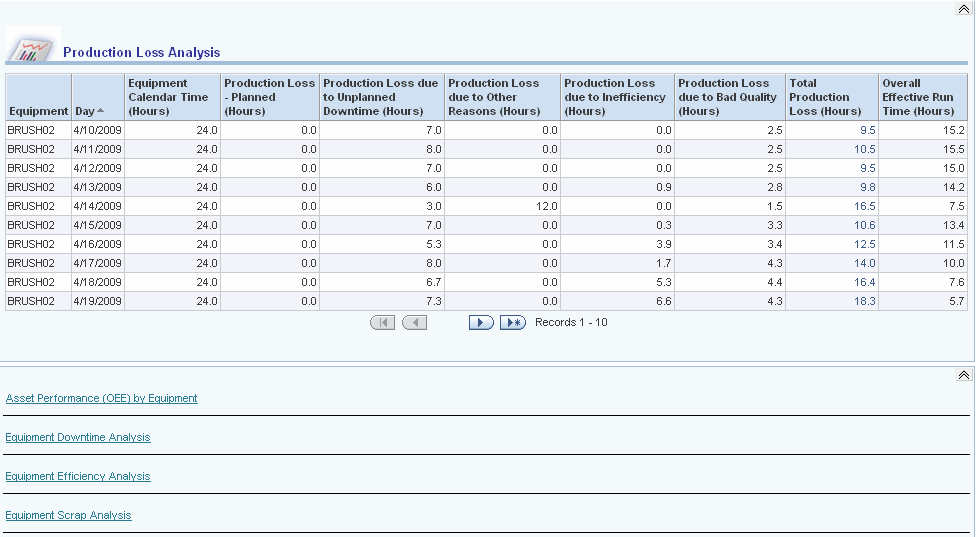
Navigate to the Production Loss Analysis page and scroll down to the Production Loss Analysis region.
-
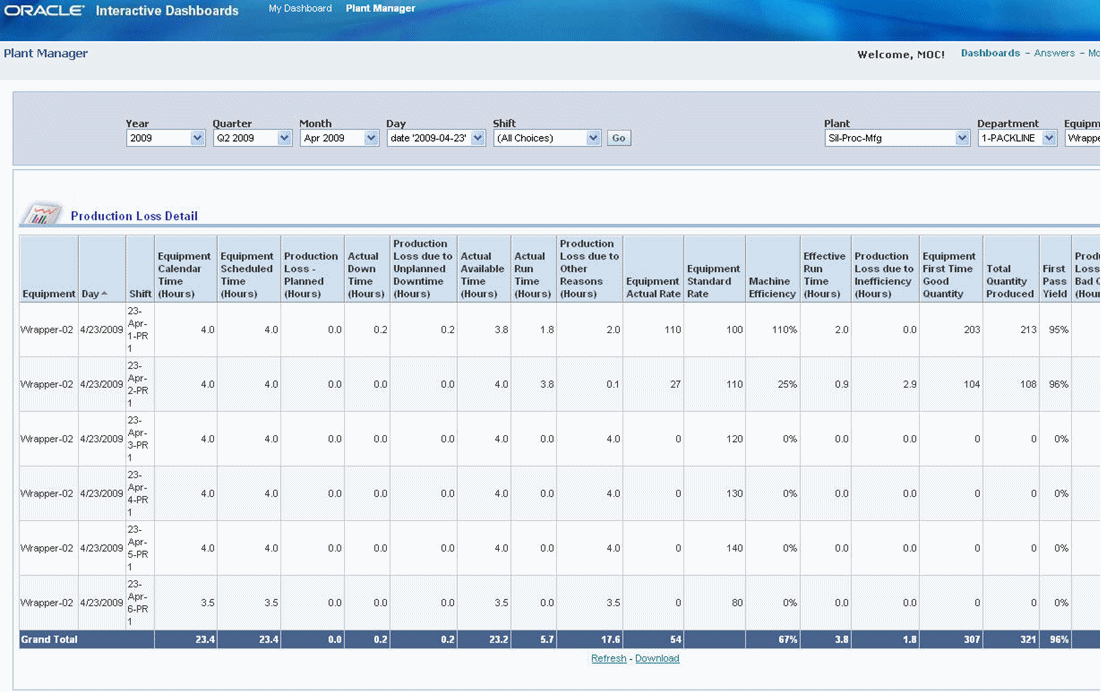
Select a value in the Total Production Loss column to analyze the Production Loss by day and shift. The Production Loss Detail page appears.
-
This report displays the Production Loss detail as well as the OEE Time Analysis for equipment.
-
Select the Return link to return to the Production Loss Analysis page.
Related Topics
Production Performance
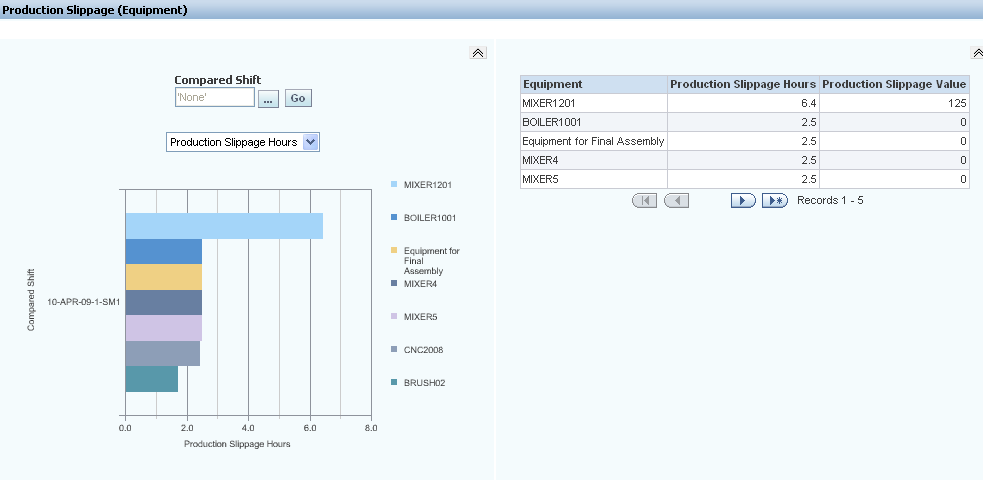
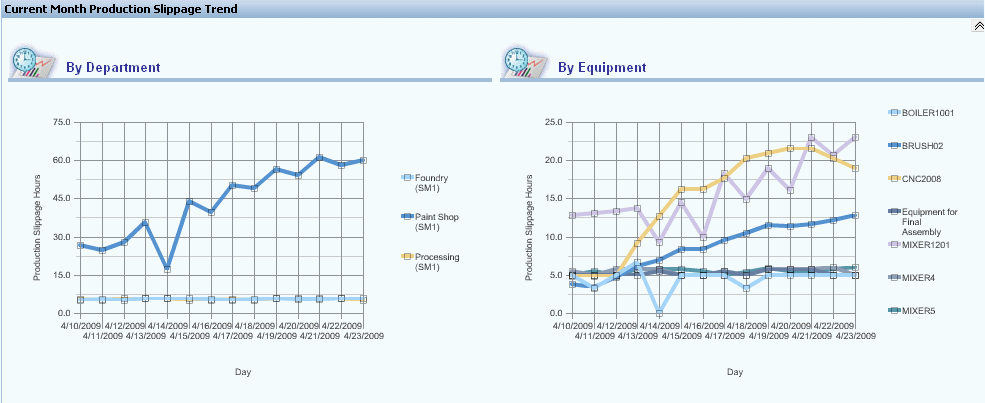
The Production Performance page provides the performance to schedule measures by plant, department, and bottom performing equipment. It also displays production slippage in comparison to different shifts and the current month production slippage trend. Reporting regions include:
-
Performance to Schedule Measures by Plant
-
Performance to Schedule Measures by Department
-
Performance to Schedule Measures by Equipment (Bottom Performers)
-
Production Slippage by Equipment
-
Current Month Production Slippage Trend by Department
-
Current Month Production Slippage Trend by Equipment
You can view Production Performance by the following dimensions:
-
Time dimension – Year, Quarter, Month, Day, and Shift
-
Equipment dimension – Plant and Department
To view Production Performance
-
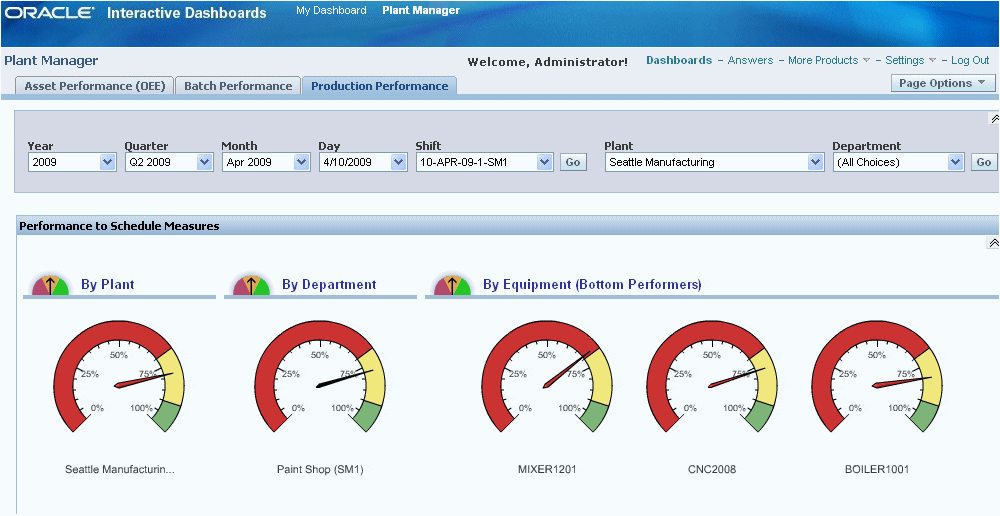
Navigate to the Production Performance page. The page displays Performance to Schedule Measures By Plant, By Department, and By Equipment Bottom Performers.
-
Scroll down the Production Performance page to view the Production Slippage (Equipment) region.
-
You can scroll down the page further to view Current Month Production Slippage Trend by Department and by Equipment.
Related Topics
Batch Performance
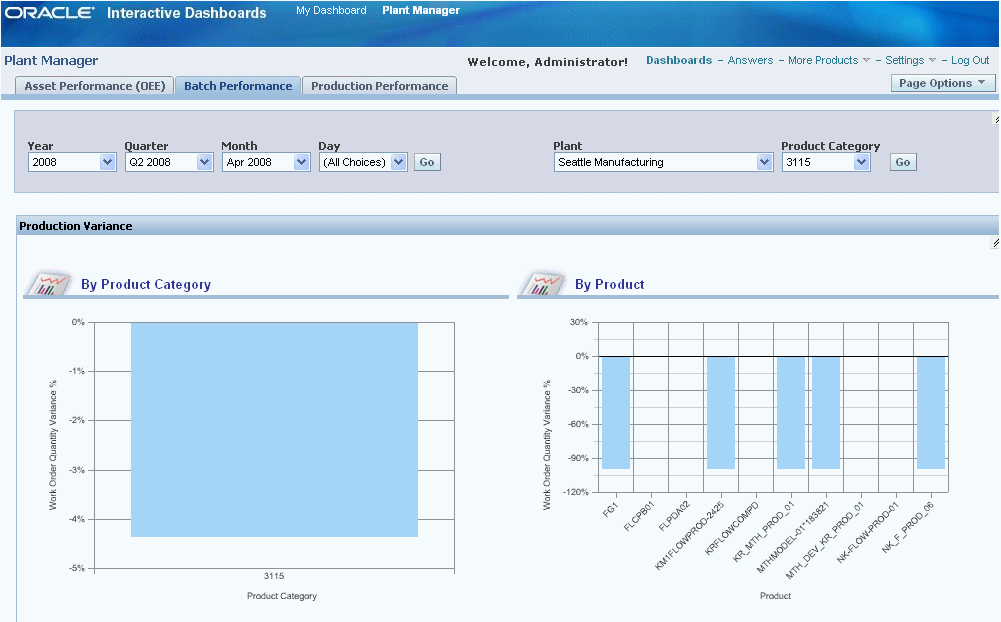
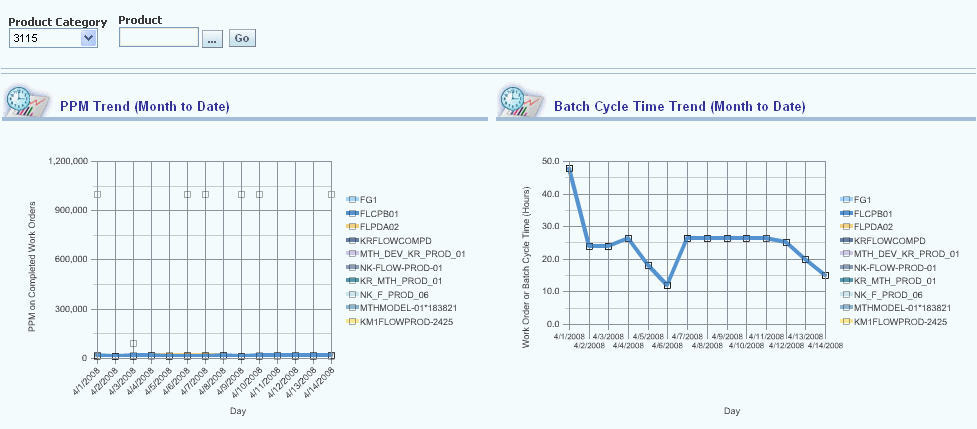
The Batch Performance page displays performance metrics that include Work Order Quantity Variance, PPM, Batch Cycle Time Trend, and Service Level Performance. Reporting regions include:
-
Production Variance by Product Category
-
Production Variance by Product
-
PPM Trend (Month to Date)
-
Batch Cycle Time Trend (Month to Date)
-
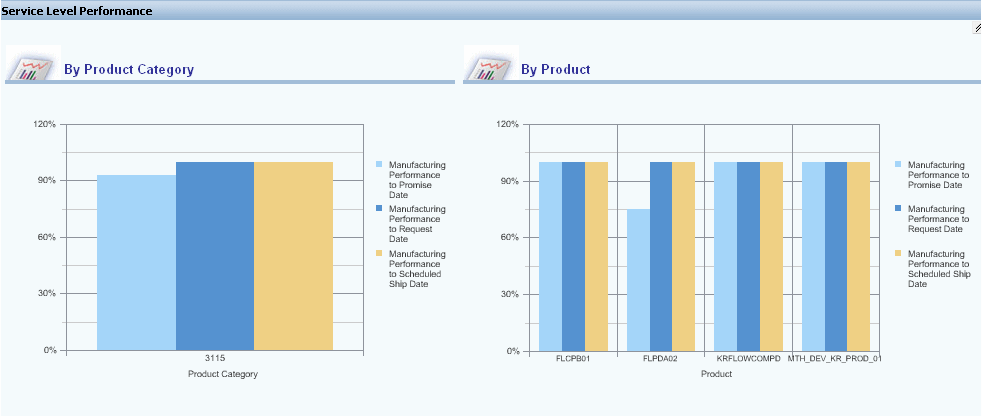
Service Level Performance by Product Category
-
Service Level Performance by Product
You can view Batch Performance by the following dimensions:
-
Time dimension – Year, Quarter, Month, and Day
-
Equipment dimension – Plant and Product Category
To view Batch Performance
-
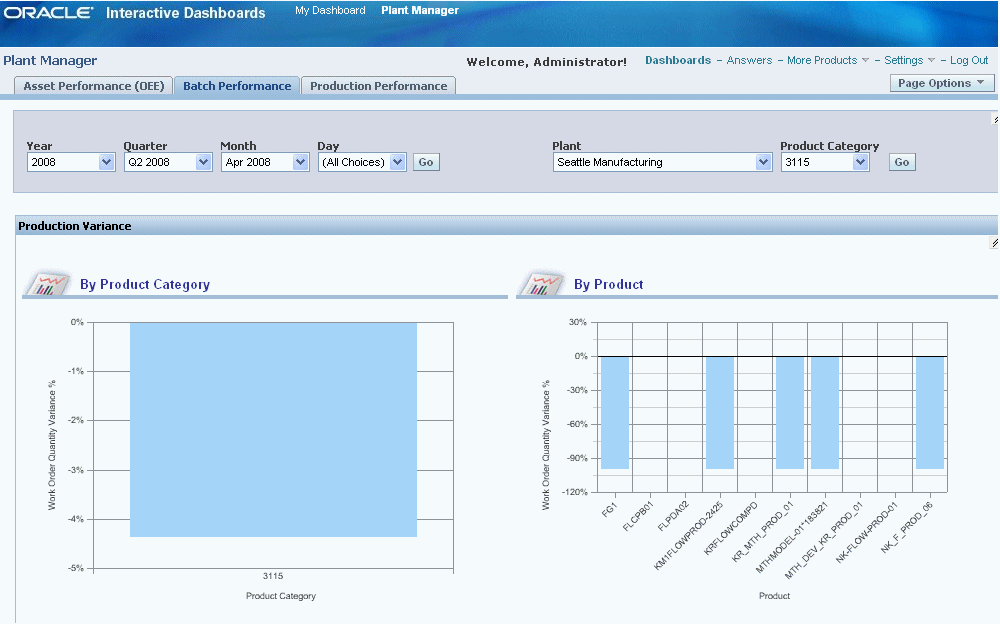
Navigate to the Batch Performance page to view production variance. You can view production variance by Product Category and by Product.
-
In the Production Variance By Product region, you can click on a Work Order Quantity Variance Percent bar within the bar graph to view work order contributing details.
-
Scroll down the Batch Performance page to view PPM Trend (Month to Date) and Batch Cycle Time Trend (Month to Date) regions.
-
Continue to scroll down the page to also view Service Level Performance by Product Category and by Product.
Related Topics
Batch Performance Detail
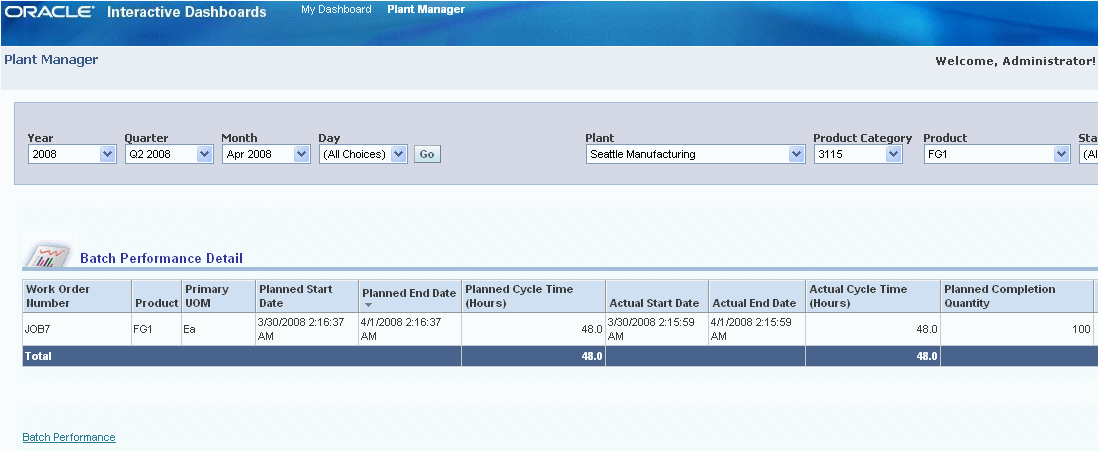
The Batch Performance page allows you to navigate to the Batch Performance Detail page. From the Batch Performance Details page, you can view details of specific work orders that are contributing to the production variance.
To view Batch Performance Detail
-
Navigate to the Batch Performance page.
-
In the Production Variance By Product region, you can click on a Work Order Quantity Variance Percent bar within the bar graph to view work order contributing details. The page displays details of work orders that contribute to the production variance for the product.
-
Select the Batch Performance link at the bottom of the page to navigate back to the Batch Performance page.
Related Topics
Sustainability Performance by Department
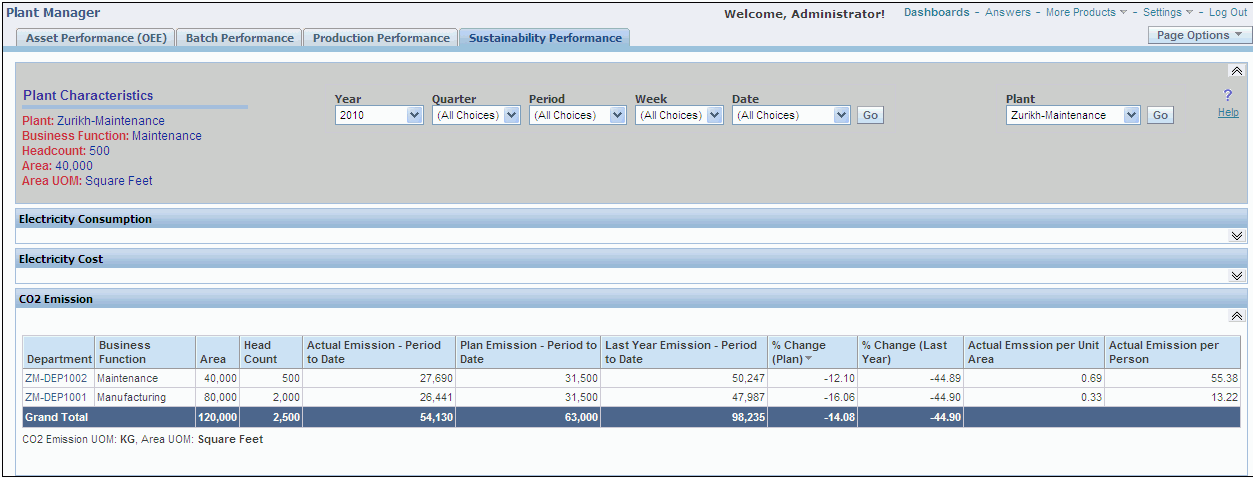
The Sustainability Performance by Department page displays the electricity consumption, electricity cost, and carbon emission for all departments in a plant.
To view the Sustainability Performance by Department page
-
Navigate to the Plant Manager dashboard using the Manufacturing Operations Center User responsibility. Select the Sustainability Aspect tab.
-
Select the time period for which you want to view the details. Choose the Year, Quarter, Period, Week, and Date. All Choices displays as the default value for all the time period fields.
-
Select the Plant for which you want to display the reports. All production sites from the Site master display in the list of values. The first site in ascending alphabetical order of Sites is the default value.
-
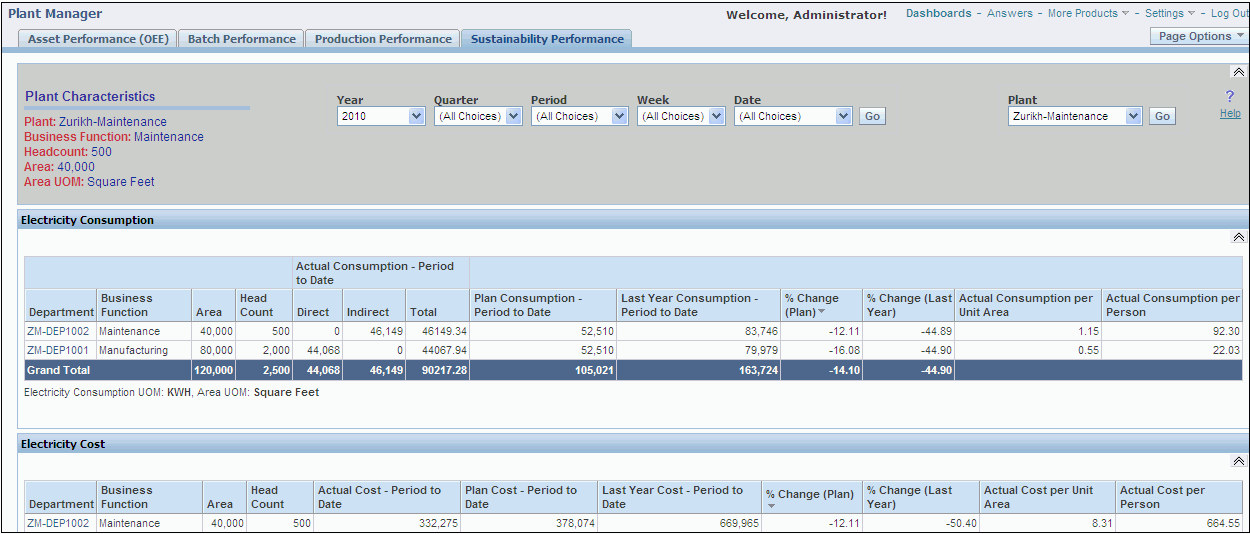
Click Go. The Sustainability Performance by Department Appears. The following Plant Characteristics display:
-
Plant
-
Business Function is the business function of the plant.
-
Headcount is the number of employees in the plant
-
Area is the area of the plant.
-
Area UOM is the unit of measure in which Area is expressed.
-
-
Scroll down the page to view the following reports for each department in the plant:
-
Electricity Consumption
-
Electricity Cost
-
CO2 Emission
-
Production Value Analysis by Product
-
Trend
-
Ranking and Distribution
Electricity Consumption:
-
Department is the name of the department of the plant. You can click on a department to view reports on the equipment in the department.
-
Business Function is the business function of the department
-
Area is the area of the department.
-
Headcount is the number of employees working in the department.
-
Direct Actual Consumption- Period to Date is the actual electricity consumed by the department in a specific time period for production purposes.
-
Indirect Actual Consumption- Period to Date is the actual electricity consumed by the department in a specific time period for non-production purposes. For example, lighting, air-conditioning, and water treatment systems.
-
Total Actual Consumption – Period to Date is the sum of Direct and Indirect Actual Consumption.
-
Plan Consumption- Period to Date is the planned electricity to be consumed by the department.
-
Last Year Consumption – Period Date is the electricity consumed by the department in the same time period of the previous year.
-
% Change (Plan) is the percentage deviation of actual consumption from planned electricity consumption by the department. A red flag displays when the value is more than zero.
-
% Change (Last Year) is the percentage deviation of actual electricity usage by the department in the period of the current year from that of the last year. A red flag displays when the value is more than zero.
-
Actual Consumption Per Unit Area is the actual electricity consumed per unit area of the department.
-
Actual Consumption Per Person is the actual electricity consumed per person in the department.
-
Electricity Consumption UOM is the unit of measure in which electricity consumption is expressed.
-
Area UOM is the unit of measure in which the department area is expressed.
Electricity Cost:
-
Actual Cost -Period to Date is the cost of actual electricity consumed by the department in a specific time period.
-
Plan Cost- Period to Date is the cost of planned electricity to be consumed by the department in a specific time period.
-
Last Year Cost – Period Date is the cost of electricity consumed by the department in the same time period of the previous year.
-
% Change (Plan) is the percentage deviation of cost of actual electricity consumption from planned electricity consumption by the department. A red flag displays when the value is more than zero.
-
% Change (Last Year) is the percentage deviation of cost of actual electricity usage by the department in the period of the current year from that of the last year. A red flag displays when the value is more than zero.
-
Actual Cost Per Unit Area is the cost of actual electricity consumed per unit area of the department.
-
Actual Cost Per Person is the cost of actual electricity consumed per person in the department.
CO2 Emission
-
Actual Emission-Period to Date is the carbon emission based on electricity consumption by the department in a specific time period.
-
Plan Emission-Period to Date is planned emissions based on electricity consumption by the department.
-
Last Year Emission-Period Date is emission based on electricity consumed by the department in the same time period of the previous year.
-
% Change (Plan) is the percentage deviation of actual from planned emissions by the department. A red flag displays when the value is more than zero.
-
% Change (Last Year) is the percentage deviation of actual emission by the department in the period of the current year from that of the last year. A red flag displays when the value is more than zero.
-
Actual Emission Per Unit Area is the actual emission per unit area of the department.
-
Actual Emission Per Person is the emission per person in the department.
Production Value Analysis by Product:
The Production Value Analysis by Product report provides information on the actual electricity consumed, cost of electricity consumed, and carbon emissions due to the consumption per production output of the department.
-
Product is the product name.
-
Production Value is the value of the produced product.
-
Actual Electricity Consumption-Period to Date is the actual electricity consumed for producing the product.
-
Actual Electricity Cost-Period to Date is the cost of the actual electricity consumed for producing the product.
-
Actual CO2 Emission – Period to Date is carbon emission based on electricity consumption by the department in a specific time period.
-
Actual Electricity Consumption per Unit Production Value is the actual electricity consumed by the department for the production of the value of one unit of production output.
-
Actual Electricity Cost Per Unit Production Value is the cost of actual electricity consumed by the department for the production of the value of one unit of production output.
-
Actual CO2 Emission Per Unit Production Value is the CO2 emission based on actual electricity consumed by an entity for the production of the value of one unit of production output.
-
Electricity Consumption UOM is the unit of measure in which the electricity consumption is expressed.
-
CO2 Emission UOM is the unit of measure in which the CO2 emission is expressed.
-
Currency UOM is the currency in which the Production Value is expressed.

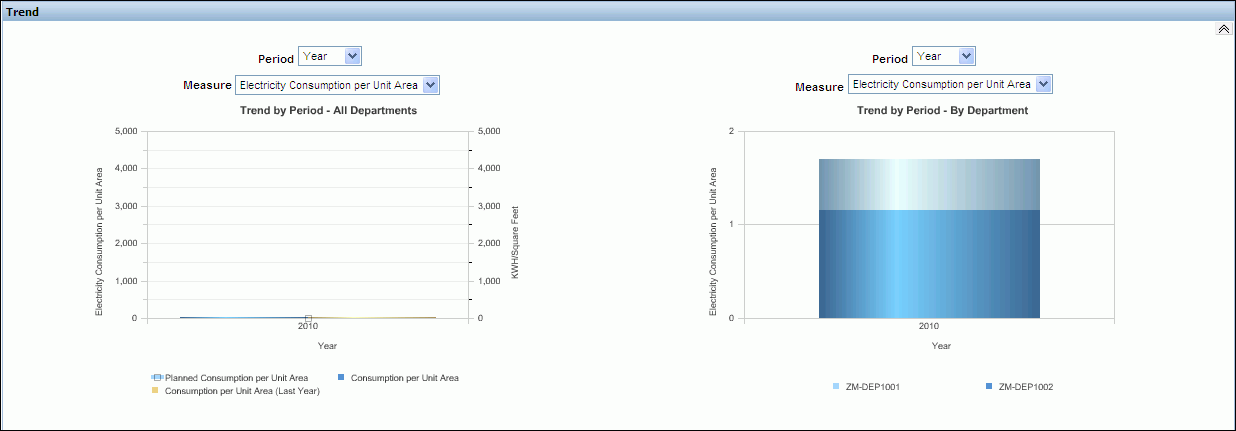
Trend:
The Trend graph report provides a graphical representation of the electricity consumption, electricity cost, and CO2 emission for:
-
All departments in a plant by the Trend by Period-All Departments report.
-
Each department in a plant by the Trend by Period-By Department report
To view the trend graph report, select the report you want to view in the Measure field from the following options.
-
Electricity Consumption
-
Electricity Consumption Per Unit Area
-
Electricity Consumption Per Person
-
Electricity Cost
-
Electricity Cost Per Unit Area
-
Electricity Cost Per Person
-
CO2 Emission
-
CO2 Emission Per Unit Area
-
CO2 Emission Per Person
Ranking and Distribution:
The Ranking and Distribution report provides a graphical representation of the department rankings and distributions based on electricity consumption, cost, and CO2 emission.
To view the Ranking and Distribution report select any one of the following KPIs in the Measure field for which you want to view the report:
-
Electricity Consumption
-
Electricity Consumption Per Unit Area
-
Electricity Consumption Per Person
-
Electricity Cost
-
Electricity Cost Per Unit Area
-
Electricity Cost Per Person
-
CO2 Emission
-
CO2 Emission Per Unit Area
-
CO2 Emission Per Person
Site Ranking report displays the top five departments in the descending order for the selected measure.
Distribution by Department report displays the distribution of the selected measure across all departments of the plant.
Distribution by Usage Category displays the distribution of the selected measure across various usage categories for all departments at the plant, for example, electricity consumption for air conditioning, lighting, production equipment etc.

-
Sustainability Performance by Equipment
You can view the electricity consumption, electricity cost, and carbon emission for all equipments in a department using the Sustainability Performance by Equipment page.
To view the sustainability performance by equipment page
-
Navigate to the Sustainability Performance page.
-
Select a department from the Department column of the Electricity Consumption report. The Sustainability Performance page by Equipment displays. You can also change the time period and the Department for which you want to view the report or select All Choices to view the reports for all departments.
-
The following reports display:
-
Distribution and Trend region displays the following graph reports:
-
Distribution by Usage Categories graph provides the distribution of the selected measure across various usage categories for all equipment in the department. You can choose to view the report for the Measures, Electricity Consumption, CO2 Emission, and Electricity Cost.
-
Trend by Period- By Equipment graph provides the trend in electricity consumption, CO2 emission, and electricity cost by all equipments in a department over a specific time period.

-
-
Department Summary region displays the following information for the department:
-
Equipment is the name of the equipment.
-
Department is the department in which the equipment is present.
-
Scrap % is the percentage of scrap expected for equipment.
-
Total Electricity Consumption is the actual electricity consumed by the equipment in the RUN, IDLE, DOWN, and OFF statuses.
-
Value Added Electricity Consumption is the actual electricity consumed by the equipment in the RUN status.
-
Non- Value Added Electricity Consumption is the electricity consumed by the equipment in the IDLE, DOWN, or OFF statuses.
-
Value Added Electricity % is the percentage of the Value Added Consumption per Total consumption for an entity.
-
CO2 Emission is the actual CO2 emission by the equipment.
-
Overall Equipment Effectiveness is calculated by multiplying Availability Ratio, Performance Ratio, and First Pass Yield for an equipment.

-
-
Sustainability Performance Equipment Hourly Summary Page
You can view the electricity consumption, electricity cost, equipment output, and carbon emission for hourly time periods for equipment in a plant using the Sustainability Performance Equipment Hourly Summary Page.
To view the sustainability performance equipment hourly summary page
-
Navigate to the Sustainability Performance tab. The Sustainability Performance by Department displays.
-
Select a department from the Department column of the Electricity Consumption report. The Sustainability Performance page by Equipment displays.
-
Select equipment in the Equipment Summary report. The Sustainability Performance by Equipment Hourly Summary displays. You can also change the time period and the Equipment for which you want to view the reports or select All Choices to view the reports for all equipments.
-
The following reports display for the equipment:
-
Electricity Consumption Trend report is a graphical representation of the trend in electricity consumption of the equipment in hourly time intervals.

-
Equipment Output Trend report is a graphical representation of the trend in output production and the scrap quantity recorded for the equipment during shifts.

-
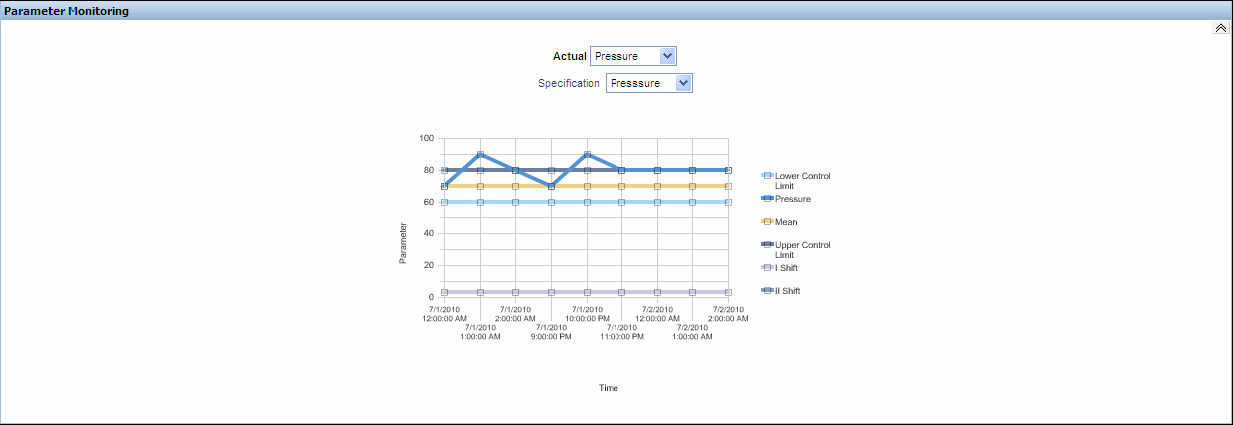
Parameter Monitoring report is a graphical representation of the measures of parameters like temperature and pressure over hourly time periods.
-
Equipment Status Trend is a graphical representation of the trend in which an equipment is in Idle, Run, Down, and Off statuses over hourly time periods. You can choose to display a Bar or Area Graph.

-
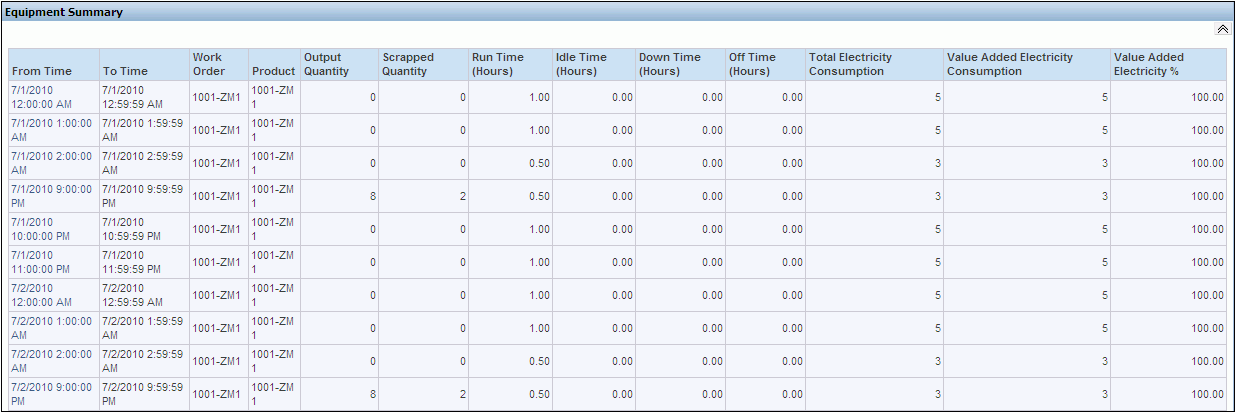
Equipment Summary report is a tabular representation of the durations for which the equipment is in the Idle, Run, Down and Off statuses over hourly time periods.
-
Sustainability Performance Equipment Hourly Detail Page
You can view the detailed information on electricity consumption, electricity cost, equipment output, and carbon emission for an equipment in a specific hourly time period using the Sustainability Performance Equipment Hourly Detail Page.
To view the Sustainability Performance Equipment Hourly Detail page
-
Navigate to the Equipment Summary region of the Equipment Hourly Summary page.
-
Click the From Time to view the equipment detail reports for the equipment within a specific hour. The Equipment Hourly Detail page appears.
-
The following reports display for the equipment within the selected hour:
-
Electricity Consumption Detail Trend graphically displays the electricity consumption by the equipment within the selected hour.
-
CO2 Emission Detail Trend graphically displays the carbon emission by the equipment within the selected hour.

-
Equipment Status Trend graphically displays the times for which the equipment is in the Up, Idle, Down, and Off Statuses within the selected hour.
-
Production Output Trend graphically displays the product output quantity and scrap quantity produced by the equipment within the selected hour.

-