Process Manufacturing Cost Comparisons
Overview of Cost Comparisons
The In-Memory Cost Management Cost Comparison tool provides the ability to compare detailed indented assembly and recipe costs across different plants and organizations. Costs are presented in a side by side view. This enables you to view costed bills or recipes and associated elements, investigate differences, and take actions on costs impacting profitability. You can:
-
Import simulation analysis directly into Microsoft Excel spreadsheets.
-
Use capabilities from Oracle Hyperion Smart View.
-
Dynamically refresh data.
-
Create reports in Microsoft Excel, Word, and PowerPoint.
The Cost Comparison pages consist of two functions: searching for elements, and viewing the results. You can also navigate the Cost Comparison page by selecting Cost Compare in the Cost Simulation View Summary page.
Related Topics
Searching for Process Cost Comparison Elements
Searching for Cost Comparison Elements, Oracle In-Memory Cost Management for Discrete Industries User's Guide
Searching for Process Cost Comparison Elements
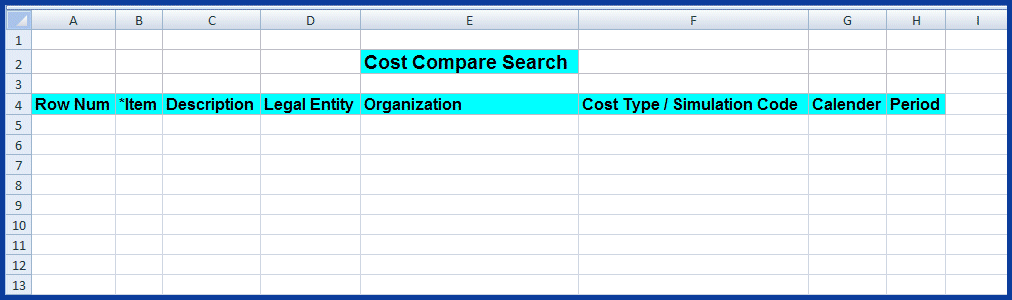
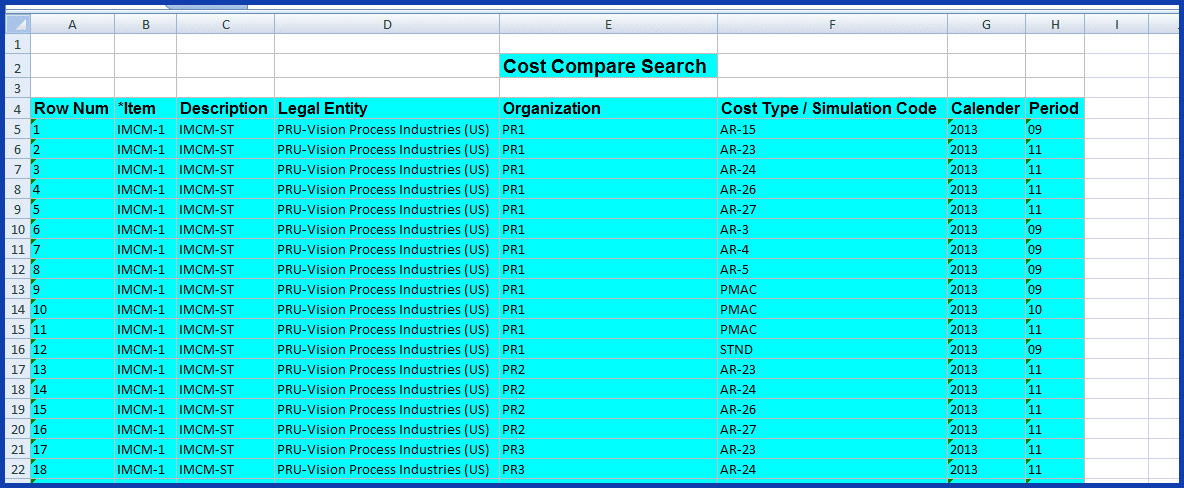
The Process Cost Comparison Search function enables you to select search criteria, display the results of your search, and navigate to the results page to compare costs. You can search for values using Process Cost Compare Search page.
To search for Process Manufacturing items for comparison
-
Navigate to the Process Cost Compare Search page.
-
If you need to establish or change a connection to your data, select the Smart View Panel, see: Connecting to Data Sources
-
Enter search data.
The Item value is required.
Optionally you can also enter values in the Description, Legal Entity, Organization, Cost Type/Simulation Code, Calender, and Period columns. You can search for values by:
-
Entering values, or partial values and wild card characters in the parameter columns.
-
Selecting multiple values by choosing Member Selection.
The Member Selection dialog box appears for selecting from a large list of specific column type values. See: Using the Member Selector
-
-
After you have entered search criteria, select Refresh.
The data corresponding to your search criteria appears on the spreadsheet.
Related Topics
Viewing Process Cost Comparison Results
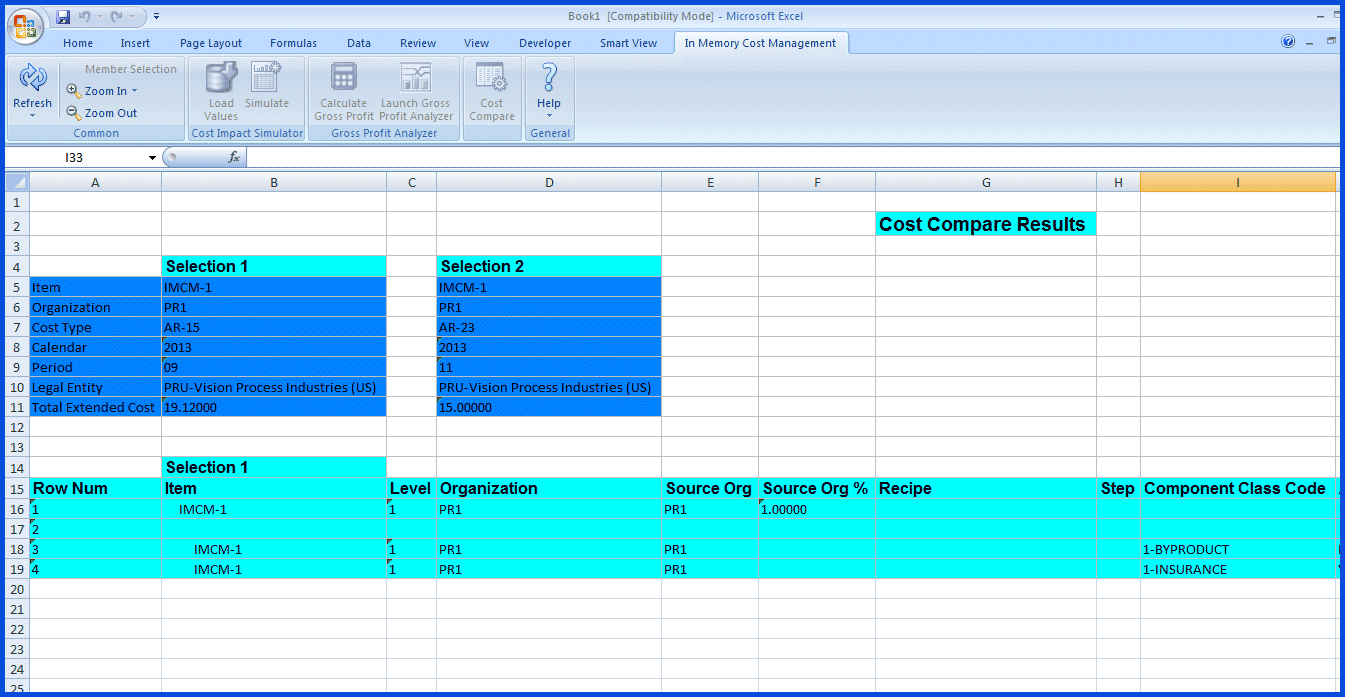
Viewing Process Cost Comparison Results
The Process Cost Compare Results page displays a side by side view of costed material and resources in recipes. You can navigate to this page by:
-
Entering search criteria in the Process Cost Compare Search page and selecting records to compare.
-
Selecting Cost Compare in the Process Cost Simulation View Summary page.
-
If one item is selected on the View Summary page, the results appearing on the Cost Compare Results page display the comparison between the simulated and basis cost type for the item selected.
-
If two items are selected on the View Summary page, the results appearing on the Cost Compare Results page display the comparison between the simulated and basis cost type for the item selected. Results appearing on the Cost Compare Results page display comparison between two items selected for the simulation costs.
-
To view cost comparison results
-
Navigate to the Process Cost Compare Search page, and enter your search criteria, see: Searching for Process Cost Comparison Elements
-
When the results of your search appear on the worksheet, select two items.
-
Select Cost Compare in the In-Memory Cost Management ribbon.
The results from your selected records appear on the Cost Compare Results page.
-
The Cost Compare Results page opens with first level of components expanded for both selections in the following fields:
-
Item, Level, Organization, Source Organization, Source Organization Percentage
-
Recipe, Step, Component Class Code, Analysis Code, Formula Quantity
-
Rate or Amount, Extended Qty/Rate or Amount, Item Cost/Resource Rate, Extended Cost, Description
-
Formula, Formula Qty/Resource Usage Unit of Measure, Routing, Routing Unit of Measure
-
Operation, Step Quantity, Step Quantity Unit of Measure, Process Quantity, Process Quantity Unit of Measure
-
Resource count, Activity Factor, Include in Rollup
-
-
Select the row for one or two specific subassemblies.
-
Select the Zoom In tool to expand the child rows.
-
Zoom In action can be performed for all levels of the subassemblies.
-
When displaying data for two assemblies, all child rows in each assembly are shown.
-
The rows where data is the same in both assemblies appear first; these first rows are populated with data coming from both assemblies.
-
-
Select the expanded subassembly and choose Zoom Out to collapse the child rows of data.
-
Choose Zoom Out again to return to the Cost Compare Search page