JavaScript is required to for searching.
Skip Navigation Links
Exit Print View
System Administration Guide: Oracle Solaris Containers-Resource Management and Oracle Solaris Zones
search filter icon
search icon

Document Information

Preface

Part I Resource Management

1.  Introduction to Solaris 10 Resource Management

2.  Projects and Tasks (Overview)

3.  Administering Projects and Tasks

4.  Extended Accounting (Overview)

5.  Administering Extended Accounting (Tasks)

6.  Resource Controls (Overview)

7.  Administering Resource Controls (Tasks)

8.  Fair Share Scheduler (Overview)

9.  Administering the Fair Share Scheduler (Tasks)

10.  Physical Memory Control Using the Resource Capping Daemon (Overview)

11.  Administering the Resource Capping Daemon (Tasks)

12.  Resource Pools (Overview)

13.  Creating and Administering Resource Pools (Tasks)

14.  Resource Management Configuration Example

15.  Resource Control Functionality in the Solaris Management Console

Using the Console (Task Map)

Console Overview

Management Scope

Performance Tool

How to Access the Performance Tool

Monitoring by System

Monitoring by Project or User Name

Resource Controls Tab

How to Access the Resource Controls Tab

Resource Controls You Can Set

Setting Values

Console References

Part II Zones

16.  Introduction to Solaris Zones

17.  Non-Global Zone Configuration (Overview)

18.  Planning and Configuring Non-Global Zones (Tasks)

19.  About Installing, Halting, Cloning, and Uninstalling Non-Global Zones (Overview)

20.  Installing, Booting, Halting, Uninstalling, and Cloning Non-Global Zones (Tasks)

21.  Non-Global Zone Login (Overview)

22.  Logging In to Non-Global Zones (Tasks)

23.  Moving and Migrating Non-Global Zones (Tasks)

24.  Solaris 10 9/10: Migrating a Physical Solaris System Into a Zone (Tasks)

25.  About Packages and Patches on a Solaris System With Zones Installed (Overview)

26.  Adding and Removing Packages and Patches on a Solaris System With Zones Installed (Tasks)

27.  Solaris Zones Administration (Overview)

28.  Solaris Zones Administration (Tasks)

29.  Upgrading a Solaris 10 System That Has Installed Non-Global Zones

30.  Troubleshooting Miscellaneous Solaris Zones Problems

Part III lx Branded Zones

31.  About Branded Zones and the Linux Branded Zone

32.  Planning the lx Branded Zone Configuration (Overview)

33.  Configuring the lx Branded Zone (Tasks)

34.  About Installing, Booting, Halting, Cloning, and Uninstalling lx Branded Zones (Overview)

35.  Installing, Booting, Halting, Uninstalling and Cloning lx Branded Zones (Tasks)

36.  Logging In to lx Branded Zones (Tasks)

37.  Moving and Migrating lx Branded Zones (Tasks)

38.  Administering and Running Applications in lx Branded Zones (Tasks)

Glossary

Index

Performance Tool

The Performance tool is used to monitor resource utilization. Resource utilization can be summarized for the system, viewed by project, or viewed for an individual user.

Figure 15-1 Performance Tool in the Solaris Management Console
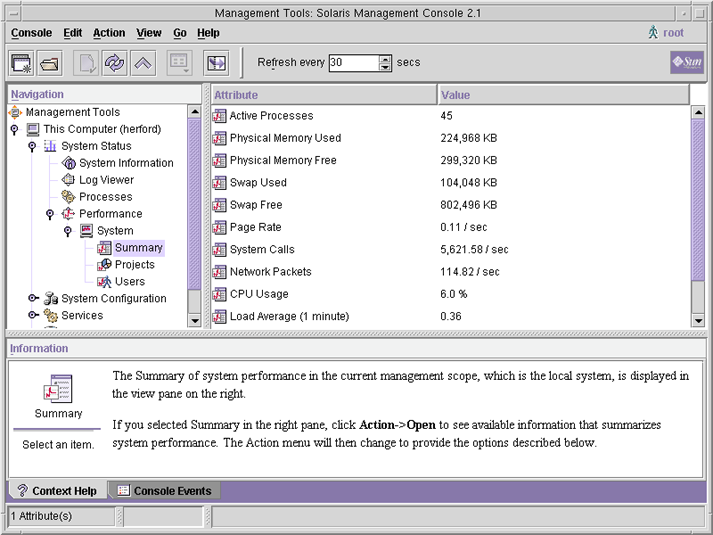
Screen capture shows Performance under Management Tools in Navigation pane and summary of system performance Attribute and Value pane.

How to Access the Performance Tool

The Performance tool is located under System Status in the Navigation pane. To access the Performance tool, do the following:

  1. Click the System Status control entity in the Navigation pane.

    The control entity is used to expand menu items in the Navigation pane.

  2. Click the Performance control entity.
  3. Click the System control entity.
  4. Double-click Summary, Projects, or Users.

    Your choice depends on the usage you want to monitor.

Monitoring by System

Values are shown for the following attributes.

Attribute
Description
Active Processes
Number of processes that are active on the system
Physical Memory Used
Amount of system memory that is in use
Physical Memory Free
Amount of system memory that is available
Swap Used
Amount of system swap space that is in use
Swap Free
Amount of free system swap space
Page Rate
Rate of system paging activity
System Calls
Number of system calls per second
Network Packets
Number of network packets that are transmitted per second
CPU Usage
Percentage of CPU that is currently in use
Load Average
Number of processes in the system run queue which are averaged over the last 1, 5, and 15 minutes

Monitoring by Project or User Name

Values are shown for the following attributes.

Attribute
Short Name
Description
Input Blocks
inblk
Number of blocks read
Blocks Written
oublk
Number of blocks written
Chars Read/Written
ioch
Number of characters read and written
Data Page Fault Sleep Time
dftime
Amount of time spent processing data page faults
Involuntary Context Switches
ictx
Number of involuntary context switches
System Mode Time
stime
Amount of time spent in the kernel mode
Major Page Faults
majfl
Number of major page faults
Messages Received
mrcv
Number of messages received
Messages Sent
msend
Number of messages sent
Minor Page Faults
minf
Number of minor page faults
Num Processes
nprocs
Number of processes owned by the user or the project
Num LWPs
count
Number of lightweight processes
Other Sleep Time
slptime
Sleep time other than tftime, dftime, kftime, and ltime
CPU Time
pctcpu
Percentage of recent CPU time used by the process, the user, or the project
Memory Used
pctmem
Percentage of system memory used by the process, the user, or the project
Heap Size
brksize
Amount of memory allocated for the process data segment
Resident Set Size
rsssize
Current amount of memory claimed by the process
Process Image Size
size
Size of the process image in Kbytes
Signals Received
sigs
Number of signals received
Stopped Time
stoptime
Amount of time spent in the stopped state
Swap Operations
swaps
Number of swap operations in progress
System Calls Made
sysc
Number of system calls made over the last time interval
System Page Fault Sleep Time
kftime
Amount of time spent processing page faults
System Trap Time
ttime
Amount of time spent processing system traps
Text Page Fault Sleep Time
tftime
Amount of time spent processing text page faults
User Lock Wait Sleep Time
ltime
Amount of time spent waiting for user locks
User Mode Time
utime
Amount of time spent in the user mode
User and System Mode Time
time
The cumulative CPU execution time
Voluntary Context Switches
vctx
Number of voluntary context switches
Wait CPU Time
wtime
Amount of time spent waiting for CPU (latency)