| Oracle® Argus Insight BOXI Administrator's Guide, Release 6.0 E18285-01 |
|
 Previous |
 Next |
In addition to the preformatted Standard Reports, Argus Insight provides Report Writer, Cubes, and Dashboard Indicators tools that let you create custom reports for ad hoc/special reporting requirements.
Report Writer is used to create a custom report by directly selecting datamart fields and applying filters on them. The report output can be displayed in various layouts and can be saved in file formats, such as PDF, XLS, or CSV.
A Cube is a data model that contains multiple dimensions (key reporting elements). You can observe and analyze the interactions between reporting elements by performing operations such as nesting, drill, sort, count, and total. Argus Insight provides six built in Cubes pertaining to varied reporting aspects.
Dashboard Indicator reports are configured by the administrator and made available to users based on their profile. These reports pull the latest data from the datamart and provide information on key product performance and workflow efficiency parameters.
The following topics explain how to use the custom report tools.
Using Report Writer
Using AdHoc Reports
In this version of Argus Insight, Report Writer utilizes the features of Business Objects® XI™ Java Report Panel to let you create custom reports by directly selecting datamart fields and viewing the customized result (report output). The Report Writer interface provides a list of database fields organised in a tree structure. To create a report, expand the trees corresponding to the required database fields and select the fields to be displayed as columns in your report.
Once you have created your report, you can edit the report, change the report layout, run the report in specific formats, and save the report.
The following topics explain how to use Report writer for creating and managing custom reports.
Creating a New Report
Editing Reports
Changing the Report Layout
Saving and Accessing Reports
Using SMQs in Report Writer
Using Case Annotations
This topic explains how to start Report Writer and create a new report. Use the following procedure to create a new report..
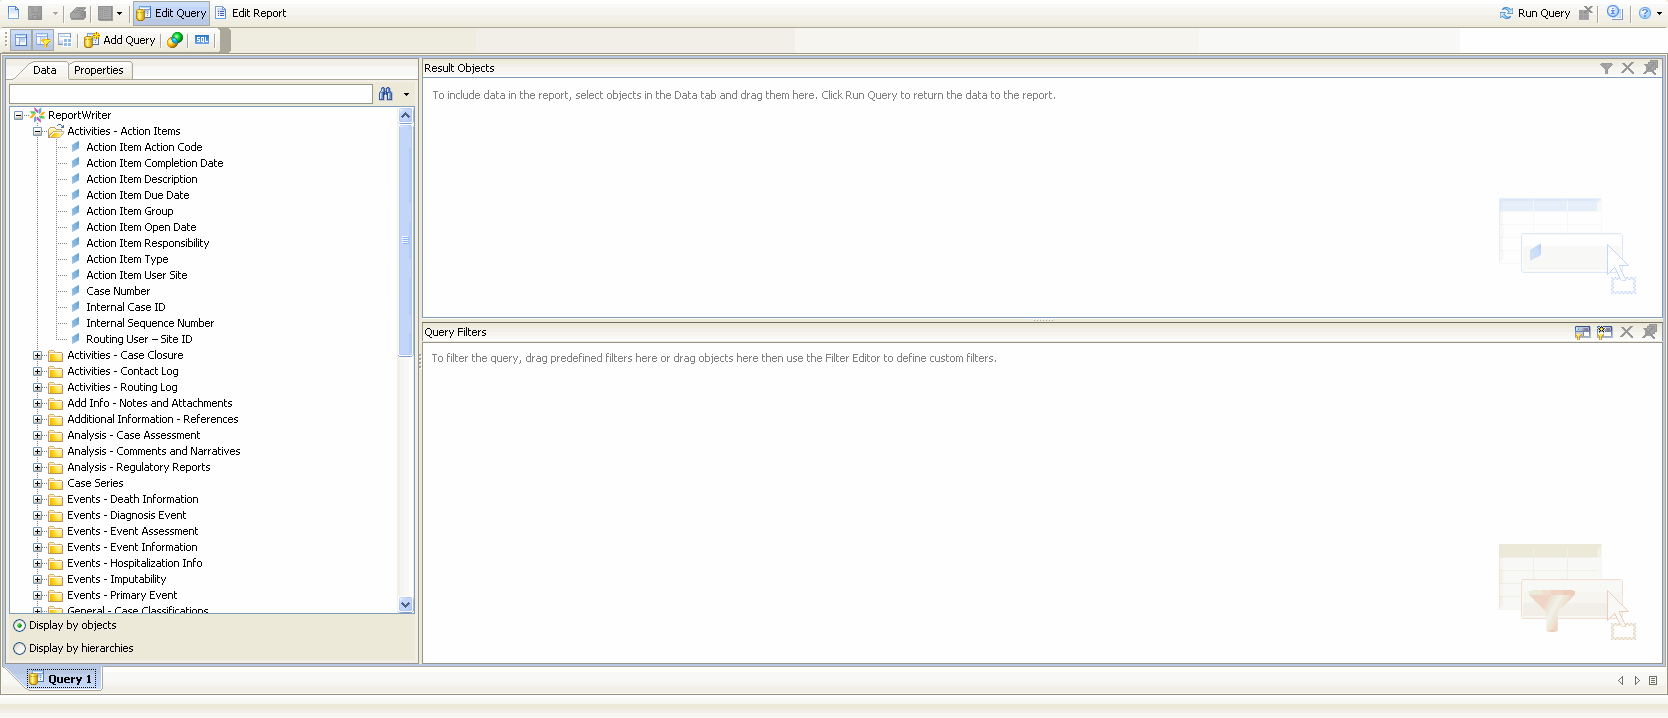
In Argus Insight, select Case Series Reports > Report Writer > New. The Business Objects® XI™ Java Report Panel appears. In the left frame, the Report Writer panel contains all the fields (i.e. classes and dimensions). These are used as the filtering criterion for data analysis.
|
Note: The fields that you select here are displayed as columns in your report output. |
Select the Active Case Series Filter.
|
Note: We recommend selecting the Active Case Series Filter before selecting the datamart fields for your report. This prevents Report Writer from querying the entire datamart and slowing down the report output generation. To view the Active Case Series, select Query Results > Case Series > Active in Argus Insight. If you want to make another Case Series active, select Query Results > Case Series > Library in Argus Insight. In the Case Series Library page that appears, check the Case Series you want to make active and click Make Active. |
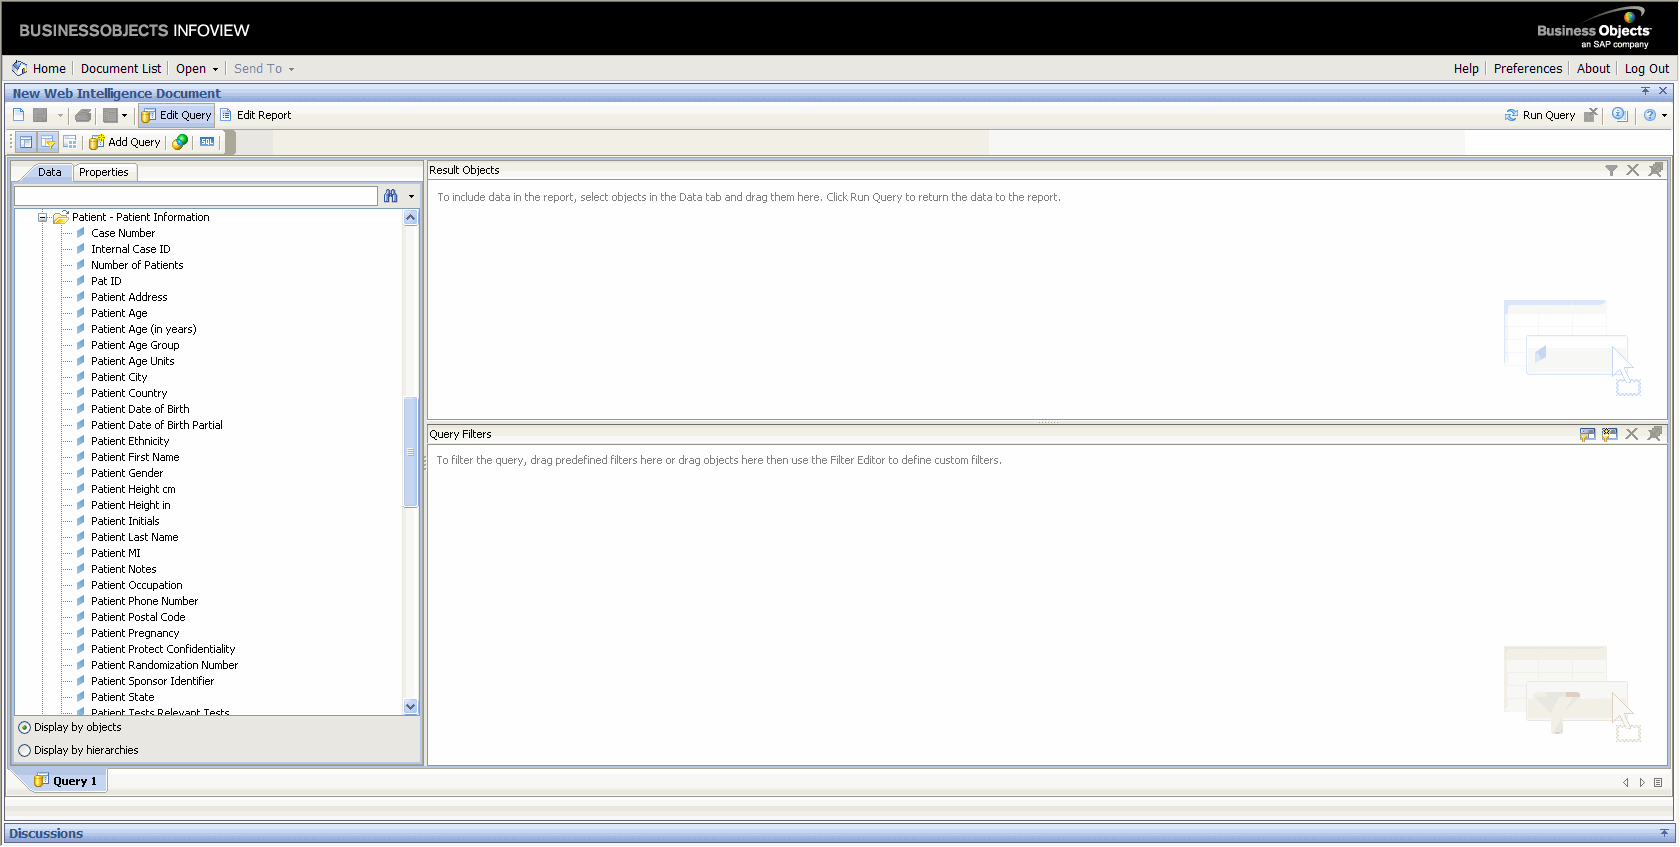
In the left frame, expand the class folders under Report Writer.The dimensions for the class category are displayed.
|
Tip: Classes and DimensionsIn this example, we will discuss a class and its dimension.
In the illustration displayed above, Patient- Patient Information is a class and Case Number is a dimension. When you expand the Patient- Patient Information class, you can see all the associated dimensions of this class. For instance, the dimension Case Number captures the Case Number for all the reported cases. You can use any combination of dimensions as filtering criterion. Each dimension you include in your query, appears as a column in the report output section. Using the required combination of dimensions you can collate data to analyze your information better. Filtering In this example, we will discuss the concept of filtering. An example of filtering is, when you want to list case numbers, where female patients, were associated with an overdose of drug. In this scenario, Case Number and Dug Overdose are the two dimensions which will appear in the report output. To ensure that only female patient cases are listed, use the panel to define the exact filtering requirements. To ensure that only female patient cases are listed, use the Query Filters panel to define the exact filtering requirements. When you execute this query, the report output section displays the tabulated data for female patients, with Case Number and Dug Overdose data displayed in columns. |
Scroll down the list of views so that the Active Case Series Filter folder is visible.
Expand the Filters folder. The built in Active Case Series Filter is displayed.
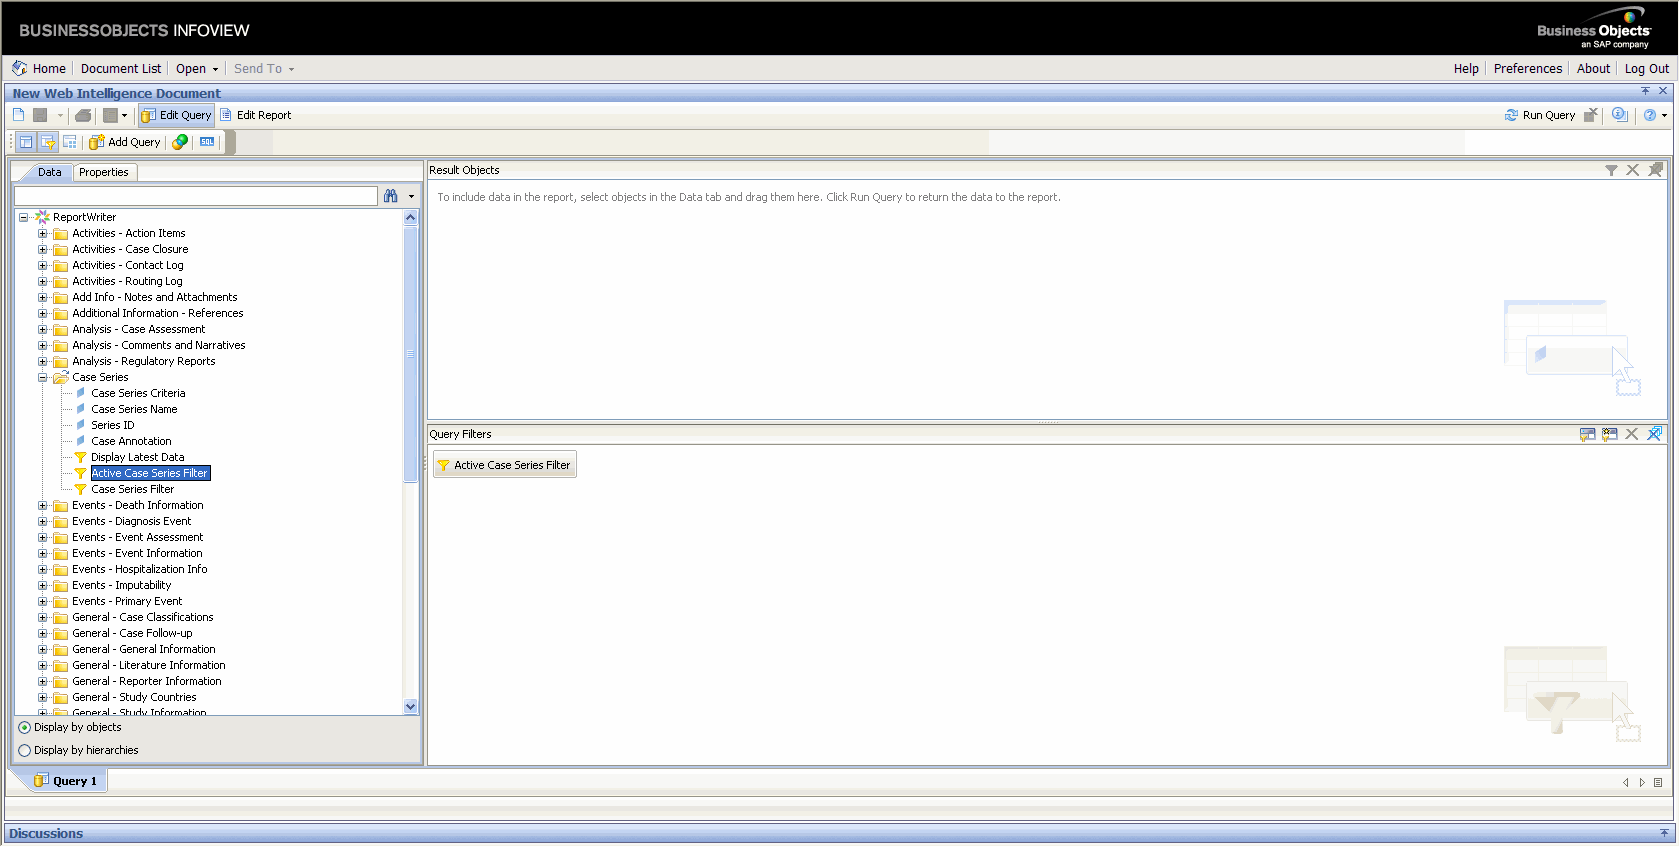
Select the Filter.
Drag and drop the filter into the Query Filters panel. The selected filter appears in the right frame.
Select the datamart fields to include in your report.
In the left frame, expand the dimensions under Report Writer. The dimensions are displayed.

Select the fields (dimensions), as appropriate.
|
WARNING: If your report consists of fields from the Event and Product tables, it will only display data for those cases where event assessment has been done. This is because event assessment is the only way of defining relationship between an event and a product. |
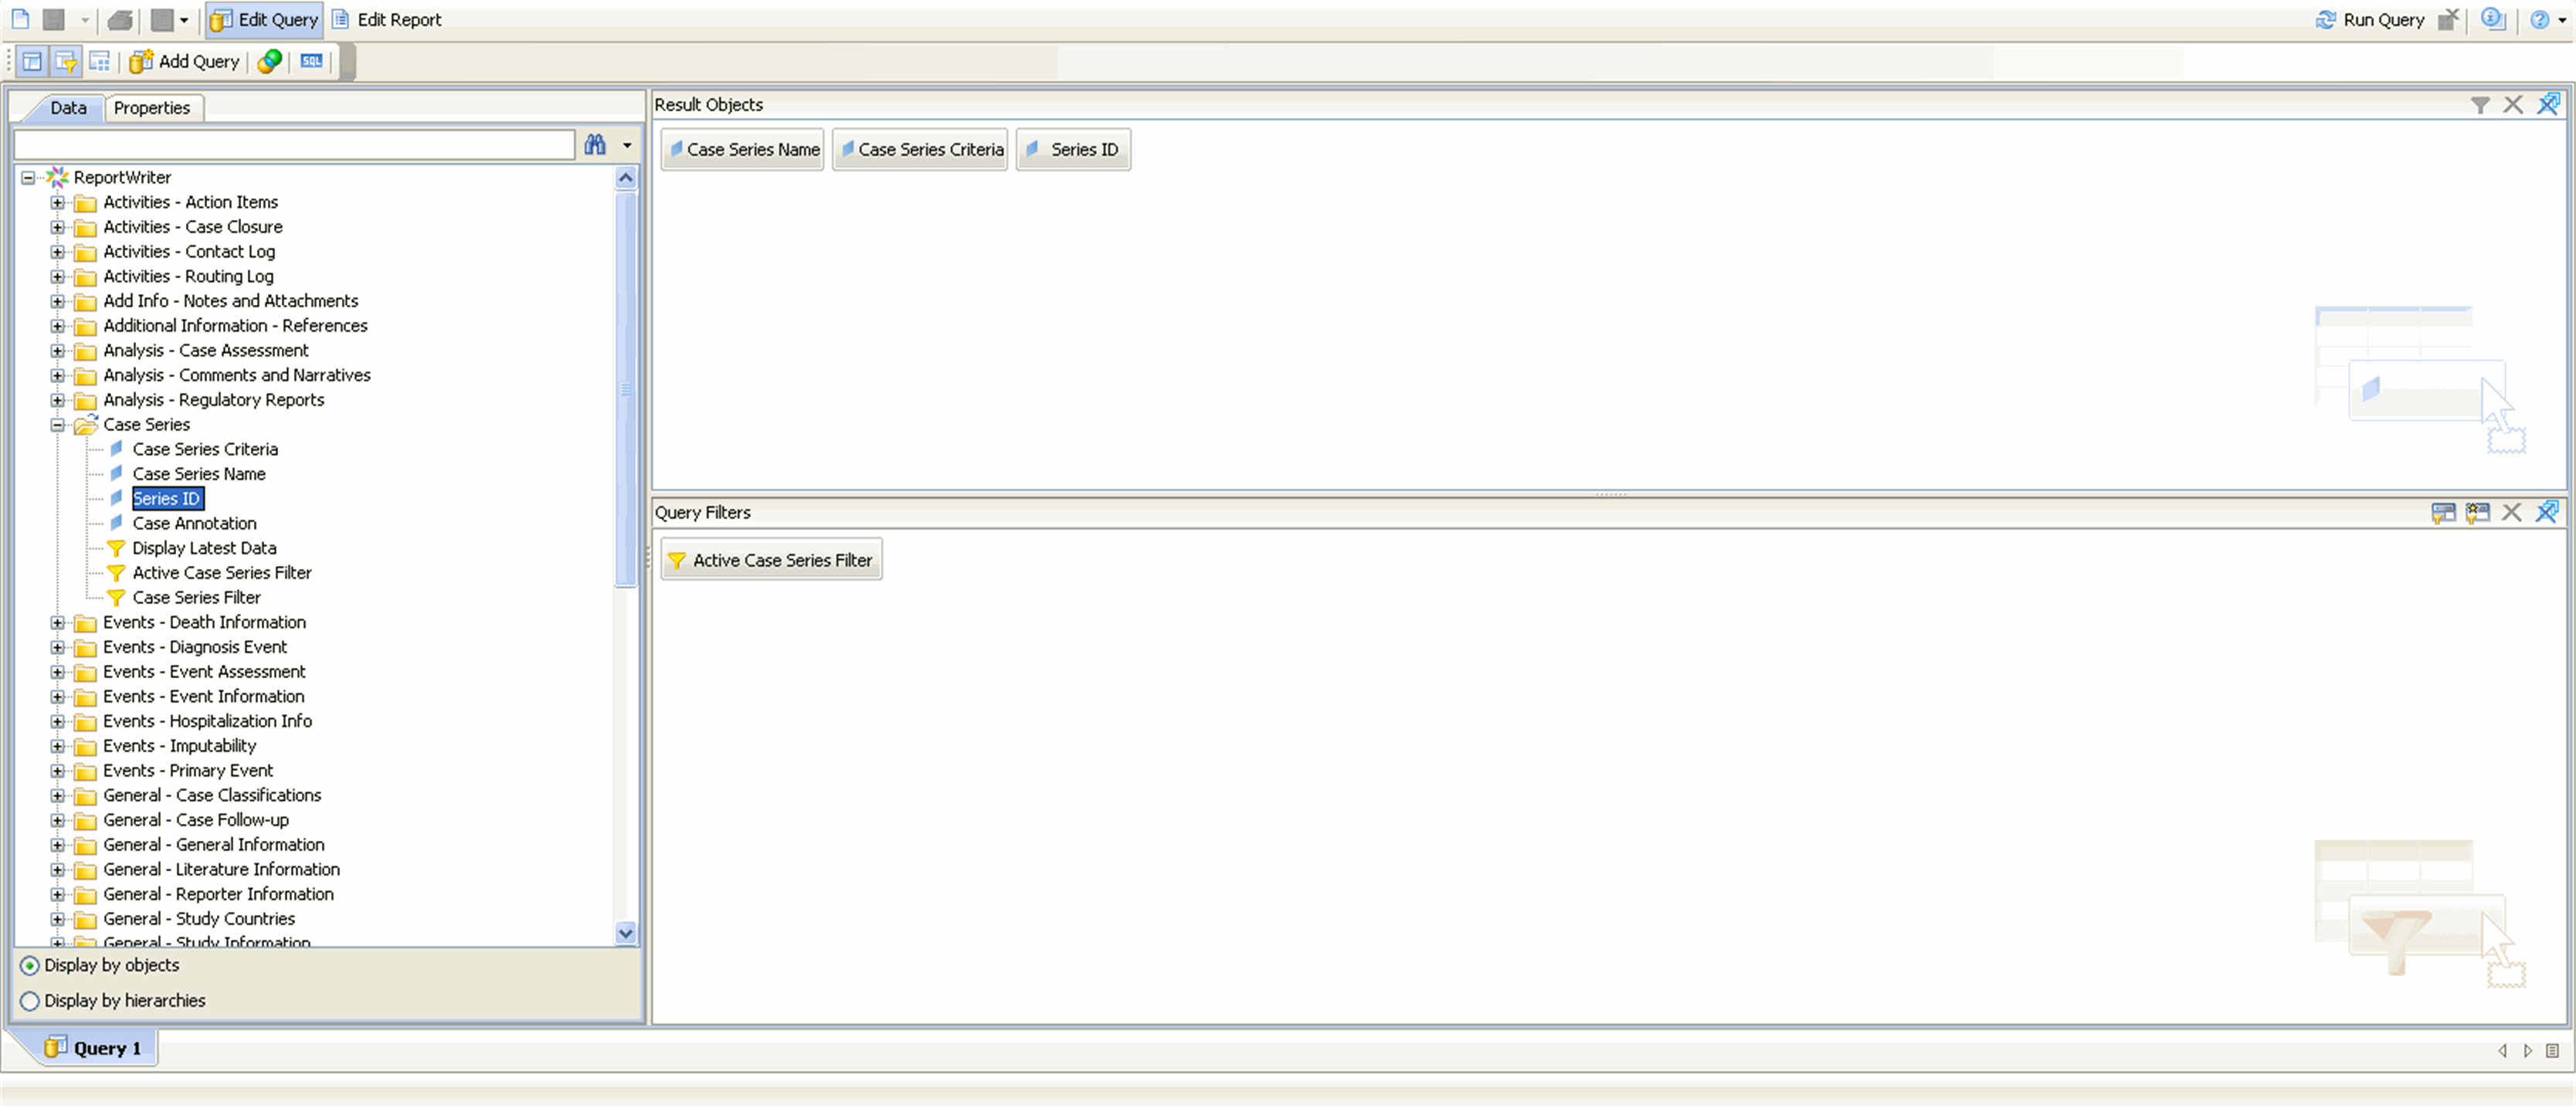
Drag and drop fields from the Report Writer panel into the Result Objects panel.
|
Tip: To select multiple fields, hold down the CTRL key and select the fields. Then drag the field entities to the report output area (in the right panel).If you wish to delete a column from the report output, select the column, right click to access the Remove button from the context menu. You can revert any action you perform in the Java Report Panel by clicking the Undo toolbar button, respectively. |
Execute the query. Click the Run Query toolbar button in the BOXI web browser to execute the query.
The Report Writer queries the datamart, automatically executes the query for every field you selected, and displays the data for the selected fields in the report output area within the right frame. The fields you selected are displayed as columns in the report output. The Report section appears.
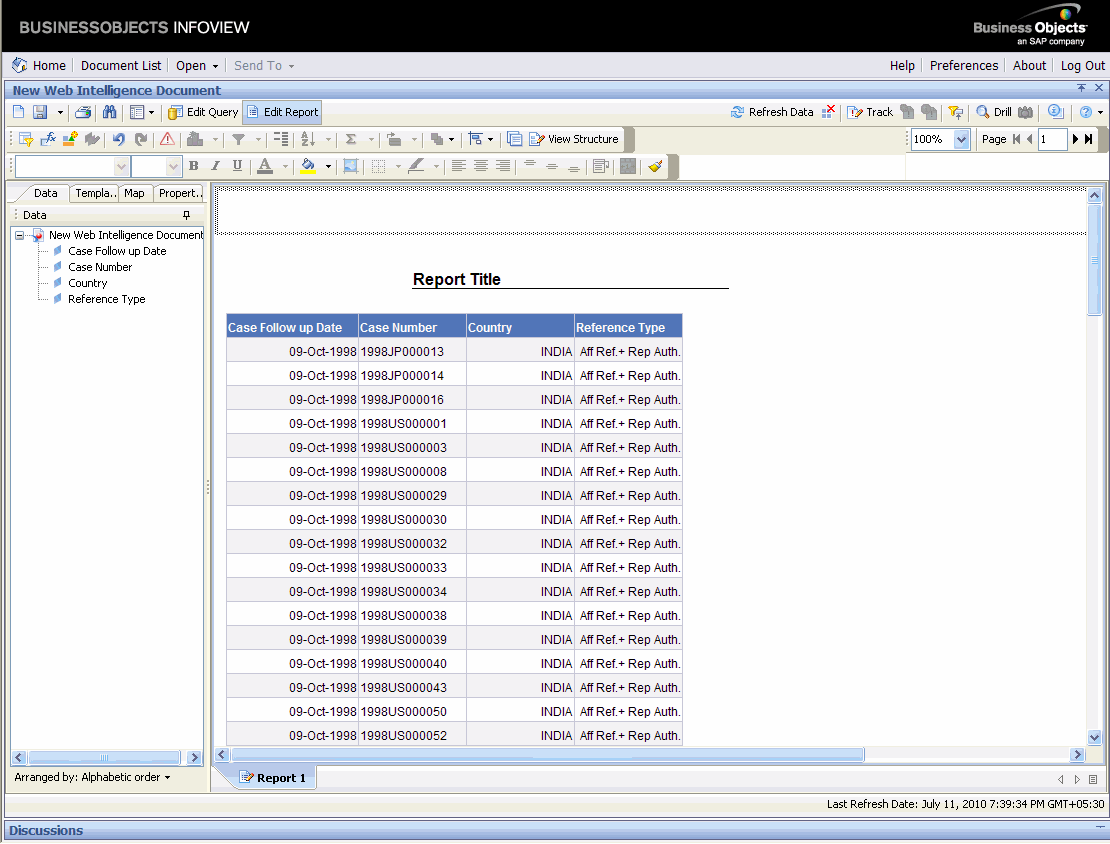
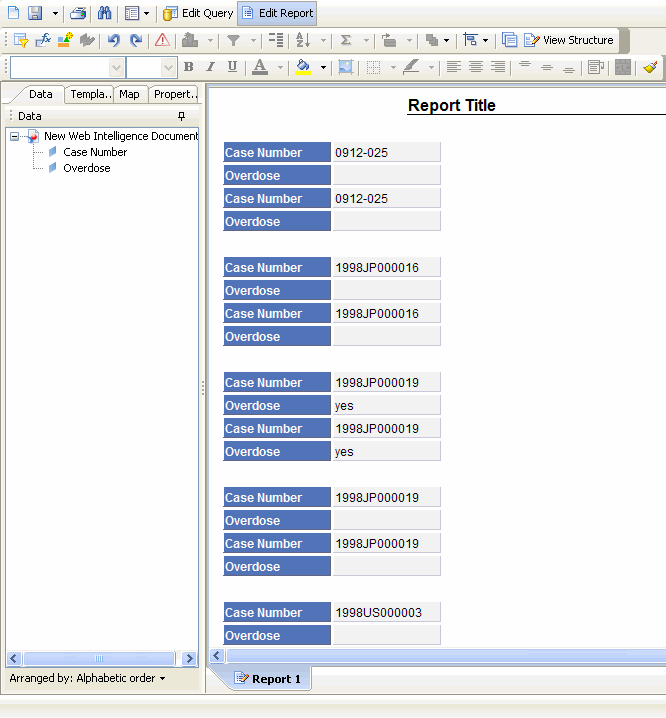
The example in the illustration captures the cases (limited to the active case series) listed by their case numbers and the associated overdose information (as yes, no or unknown).
Use the following procedure to generate a report for displaying all the Case Series Criteria and Case Series Name.
Drag and drop the Case Series Criteria and Case Series Name objects from the Case Series class into the Results pane.
Click the Run Query toolbar button in the BOXI web browser to execute the query.
The Report Writer queries the datamart, to get all the Case Series Criteria and Case Series Name.
|
Note: The system does not display Temporary Case Series Criteria or Case Series names. |
Use the following procedure to use case series criteria and the case series name with other objects.
In the left frame, expand the class folders under Report Writer. The dimensions for the class category are displayed.

Scroll down the list of views so that the Case Series folder is visible.
Expand the Case Series folder. The built-in Active Case Series Filter is displayed.
Drag and drop the Active Case Series Filter into the Query Filters panel. The selected filter appears in the right frame.
Drag and drop the Case Series Criteria and Case Series Name in the Results pane with other objects on which you want to create the report.
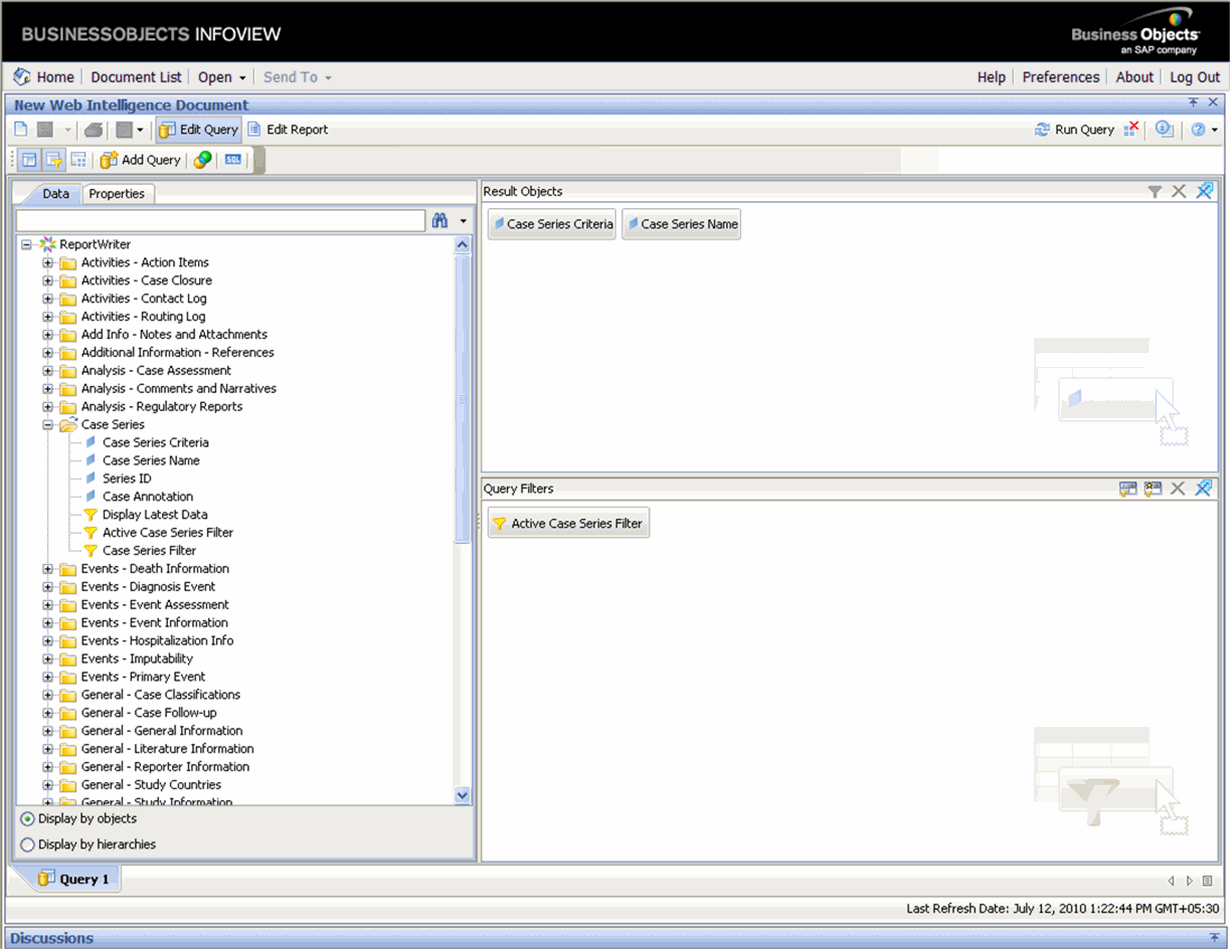
Click Run Query to run the query.
|
Note: Always use Active Case Series Filter while using Case Series Criteria and Case Series Name with other objects.To view the Active Case Series, select Query Results > Case Series > Active in Argus Insight. If you want to make another Case Series active, select Query Results > Case Series > Library in Argus Insight. In the Case Series Library page that appears, check the Case Series you want to make active and click Make Active. |
|
Tip: If you wish to rename the report, click on the existing report title to select it. If the report title is not visible in the formula toolbar, then click the Formula Toolbar icon to view the toolbar. Edit the Report name as required and click Enter. The new report title is displayed in the Report Section. |
After selecting the required datamart fields and generating the output, use use the various Java Report Panel options to edit the report, change the report layout, and save the report.
You can access Business Objects® XI™ Java Report Panel's report editing options by selecting the Edit Query menu option. The report querying options let you control the data that appears in your report as well as how it is formatted, calculated, and sorted. None of the edit operations you perform are stored in the database.
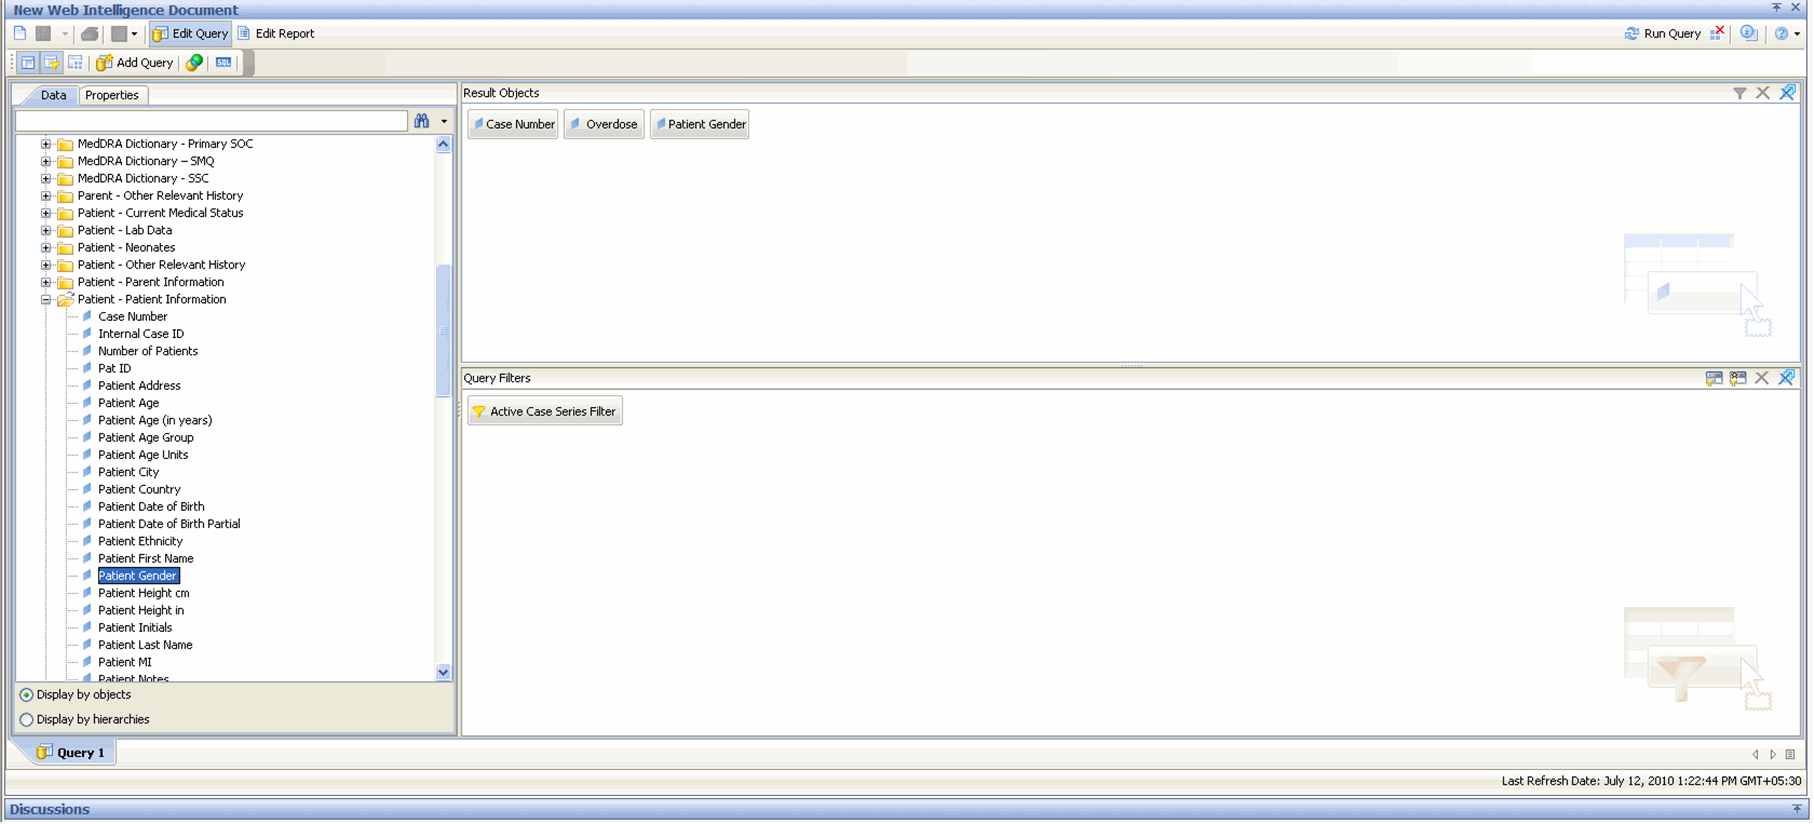
You can use the filtering option to select data fields with specific filtering criterion for your report.
In the toolbar menu, click Edit Query to view the Data (objects) and the Result Objects panes.
In the left frame, expand the dimensions under Report Writer.The dimensions are displayed.

From the Data (objects) panel, drag and drop the data fields into the Result Objects panel. The objects are placed in the Result Objects panel.
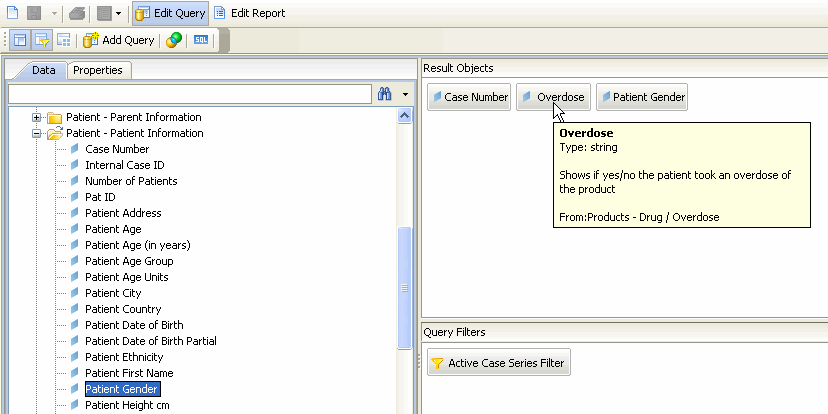
From the Data (objects) panel, drag and drop the filter criterion into the Query Filters panel.The selected filter appears in the right frame.
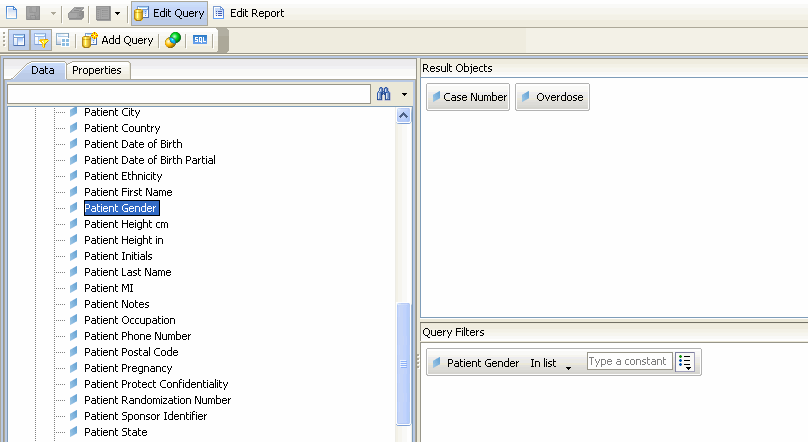
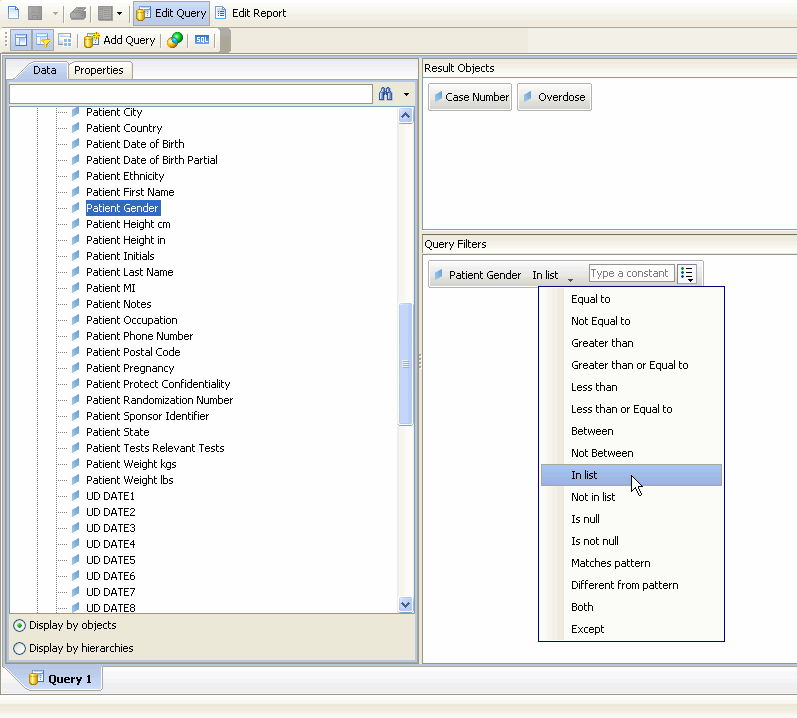
Select the operator type from a drop-down list by clicking the drop-down icon. The operator selected in the illustration is the In list operator. Using this operator, the filter is limited to any one or all of the values defined in the list.
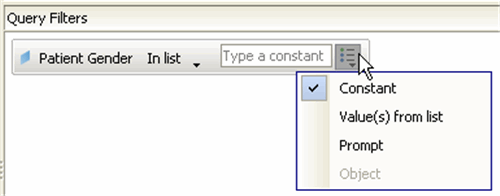
To select the value(s) associated with the operator, click the icon next to the text field, as shown below. The value is defined using the Value(s) from list option
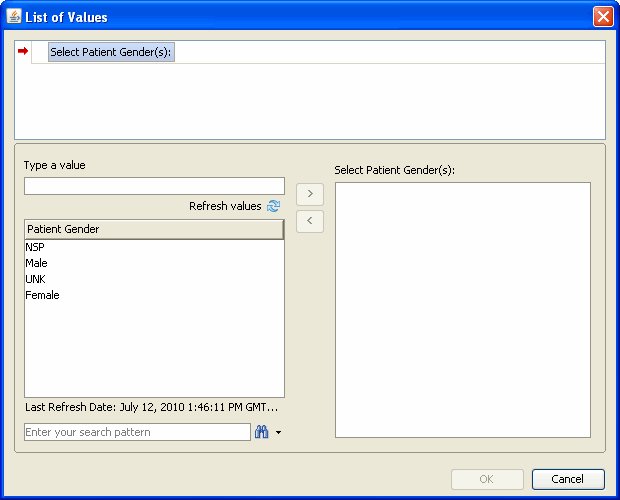
Define the value by selecting the term/word to be used as a filtering criterion. Click OK to confirm the action.
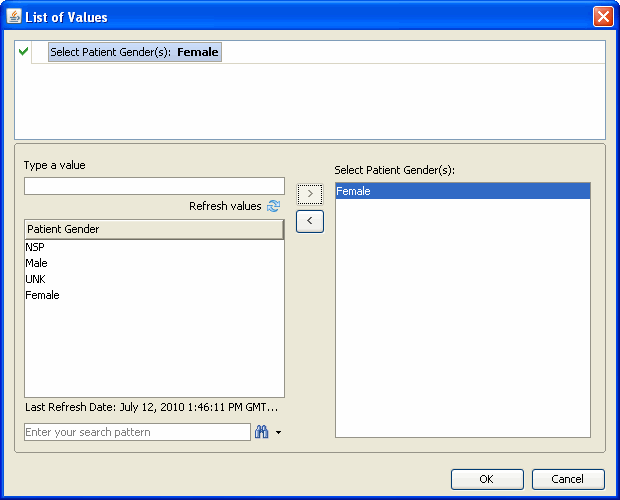
The Query Filters panel refreshes automatically to display the complete filtering criterion.
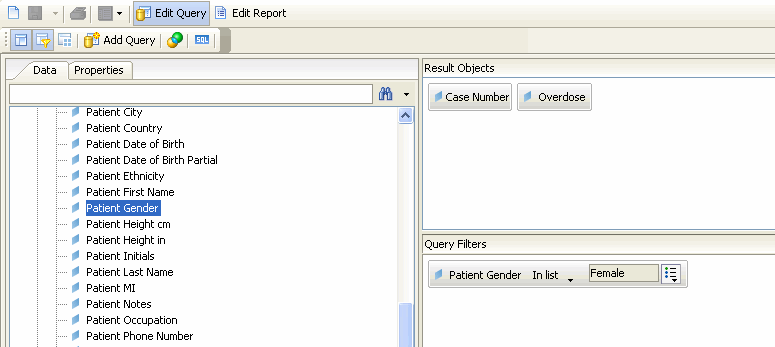
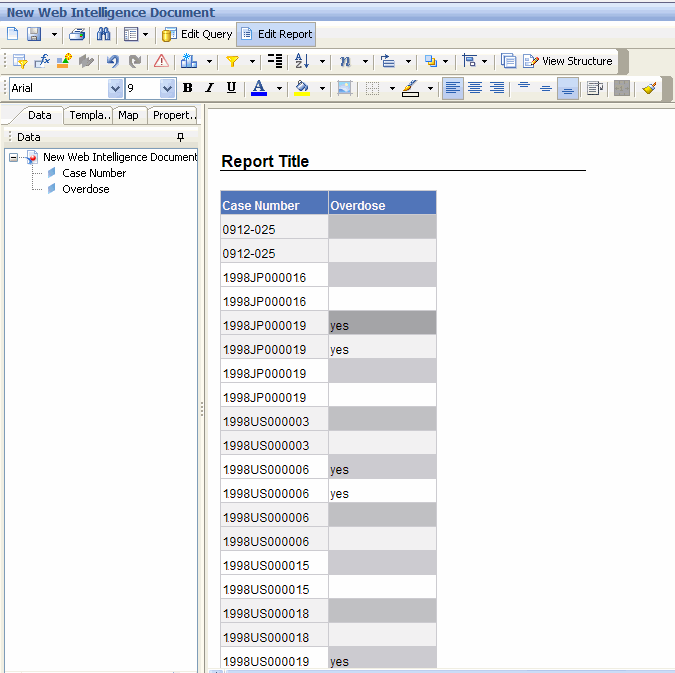
Click the Run Query toolbar option in the BOXI web browser, to execute the query. The Report section appears in the right frame. The example in the illustration captures the cases that have been filtered and limited to female patients. For each female patient, the case number and the associated overdose information (as yes, no or unknown) is displayed.
To modify or remove a filter, click the Edit Query tab. From the Result Objects panel, drag and drop the data fields (as the filtering criterion) into the Data (objects) panel
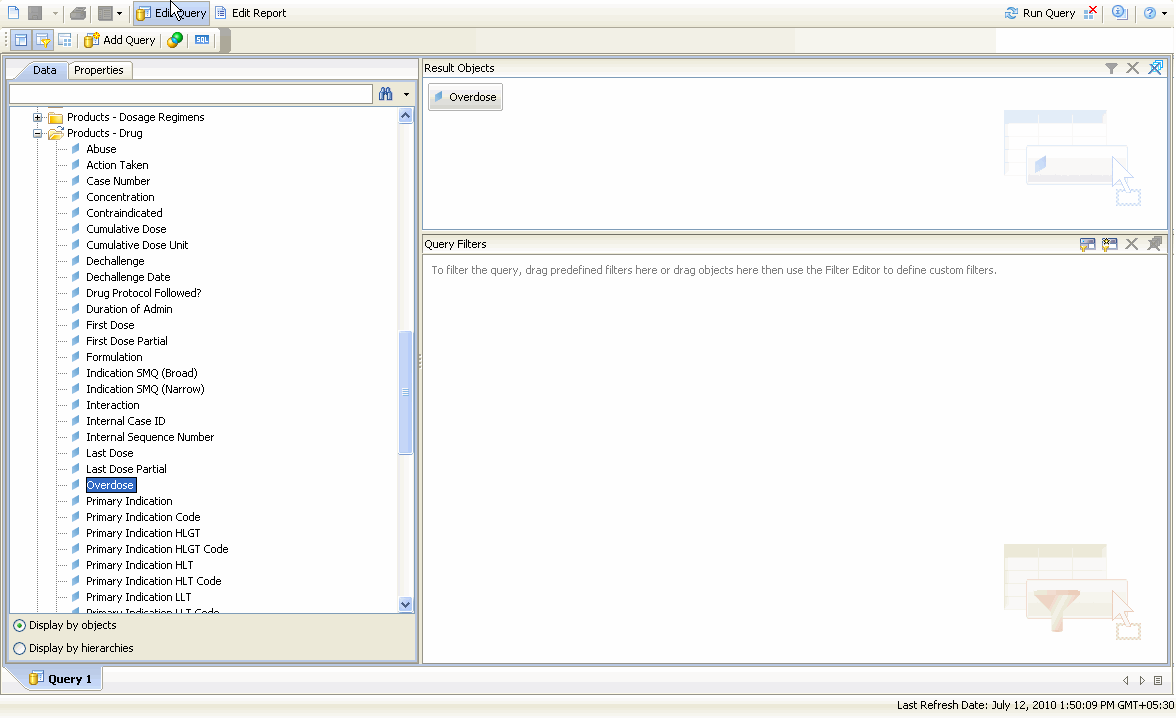
Repeat steps 1 to 5 to add new dimensions as filtering criterion and execute the query.
You can use the sorting option to change the order in which data appears in your report. Use the following procedure to sort data in your report.
In the Report section, select (or click) the column values that you wish to sort for the report output. The selected column is highlighted.

Right-click on the selected column within the data-cell.The context menu for Sort appears.
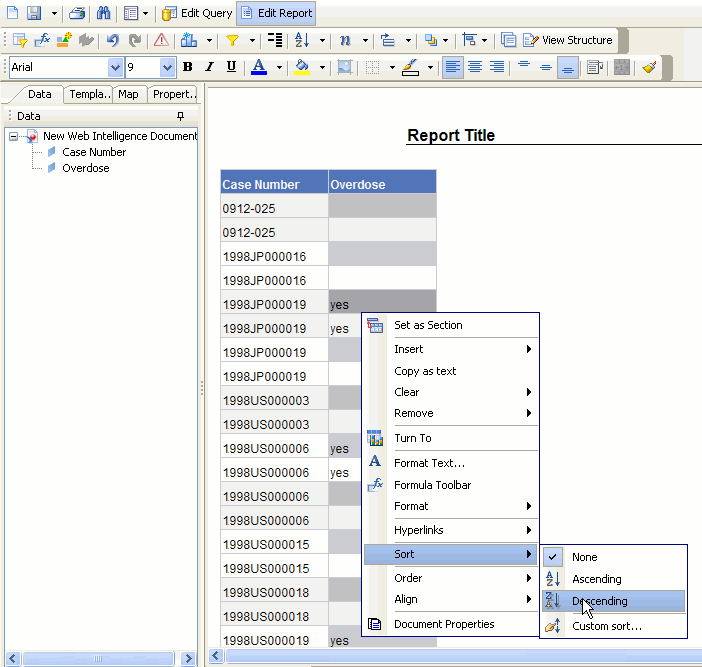
Select the required sorting option by using the Sort option provided in the context menu.The system refreshes the report and displays the sorted output.
You can use the predefined summary options to calculate the total, count, maximum, minimum, average and percentage of the values in columns of your reports. The summary options available to you depend on the type of data in the column you wish to summarize. For example, you can only use the Count option if your column contains text data whereas you can use total, maximum, minimum, or average options if the column contains numeric data.
In the Report Title section, click on the column that you wish to summarize.The selected column is highlighted.
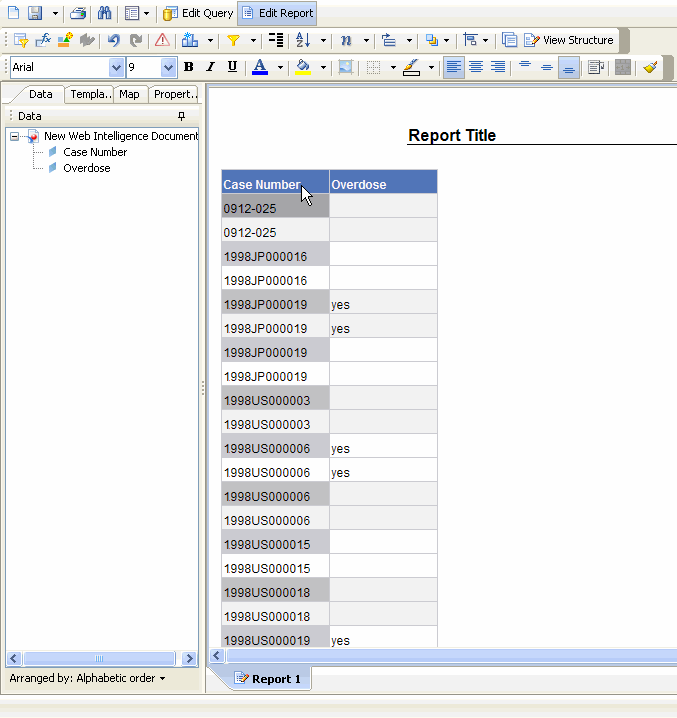
Select Insert Sum from the menu options in the top frame.The Insert Sum appears as a drop down context menu in the top frame.
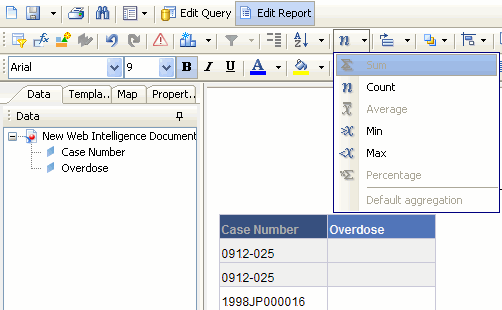
From the Insert Sum drop down context menu, select the required summary option. The options available depend on the type of values the select column contains.
The report output displays the column summary at the bottom of the report.
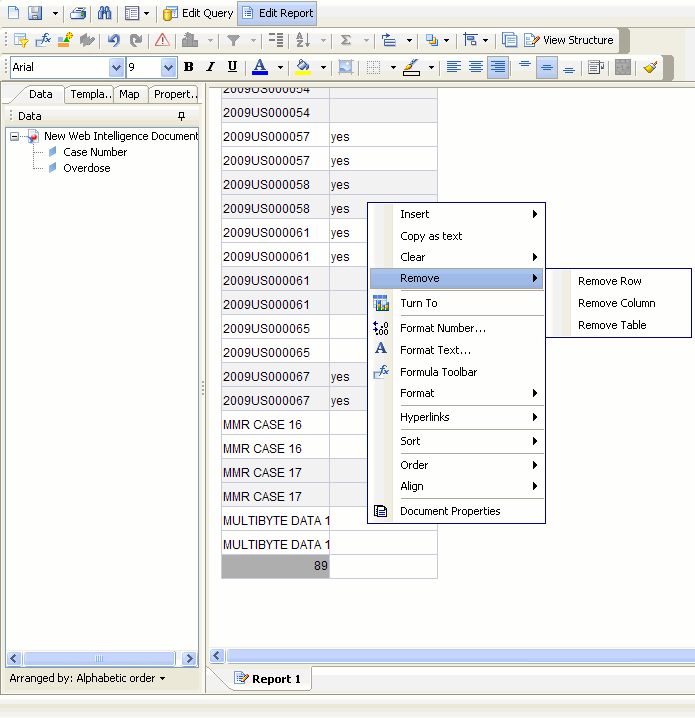
To remove summary information, select the relevant column and right click to view the context menu. Click Remove to clear the contents of the cell
You can use predefined formats to change the appearance of numbers, dates, and times in your report. Formatting does not change the underlying data. The following table describes the various formatting options available.
| Format | Description |
|---|---|
| Default | The default format is the format of the report item before any formatting is applied in Java Report Panel. Use default to remove formatting. |
| Number | Use the number format to change the number of decimal places, to specify whether to use a thousands separator, to choose different symbols to represent negative numbers, and to scale large numbers. |
| Currency | You can choose from many world currencies. Use either the currency symbol or the international code. For example the currency symbol for the euro is € and the international code is EUR.
You can also change the number of decimal places, specify whether to use a thousands separator, choose different symbols to represent negative numbers, and to scale large numbers. |
| Date and Time | You can choose from a list of date and time formats, including the 12 or 24 hour clock. |
| Boolean | You can choose from the true/false values. |
Use the following procedure to format data.
In the report output area, click within the column that you wish to format. The selected column is highlighted.
Right-click on the highlighted column and select Format from the drop-down menu.
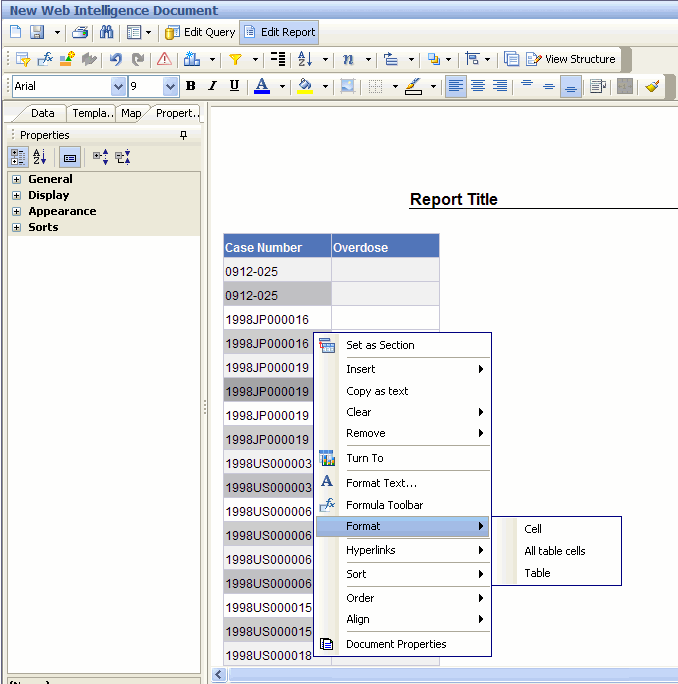
Set the data format properties from the Properties pane (displayed on the left), as appropriate.
Click OK. The report output is refreshed and displays the formatted data.
You can access Business Objects® XI™ Java Report Panel's report layout options by selecting the Turn To context menu option. The layout options let you change the appearance of your reports without changing the underlying data. For example, you can convert your report into a chart or group the report into crosstab column headers. You can also group your report by a specific column, swap rows and columns, or create sections within your report.
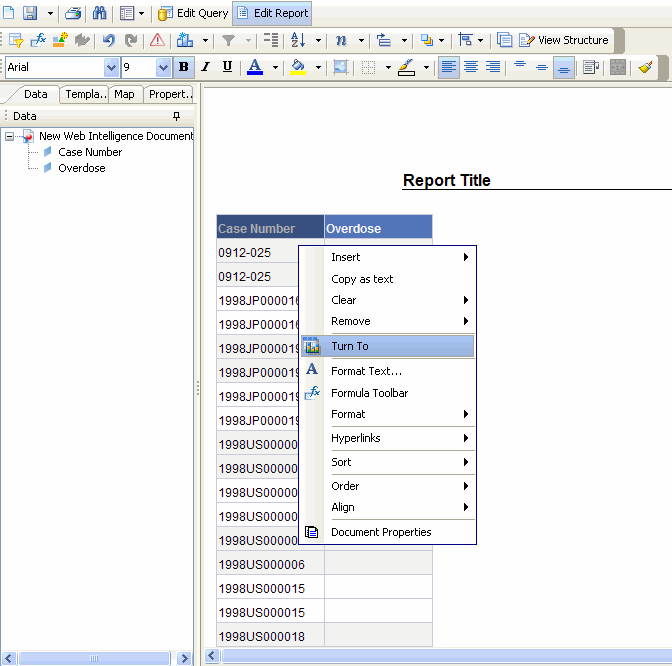
The sections explain how to use the various report layout options. This topic describes the basic layout operations in the Java Report Panel. For detailed information, refer to the documentation supplied with the BOXI products.
Use the Turn to > Table option to tabulate data. Use the following procedure to create a table from a report.
While your report is displayed, select the Table tab from the Turn To context menu option. The Turn to > Table options appear in the report output section in the right frame.
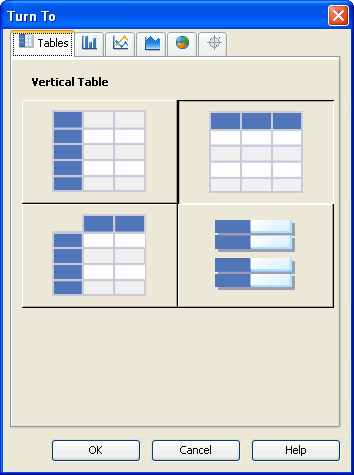
Select the required table format. For example, vertical, horizontal, crosstab or form.
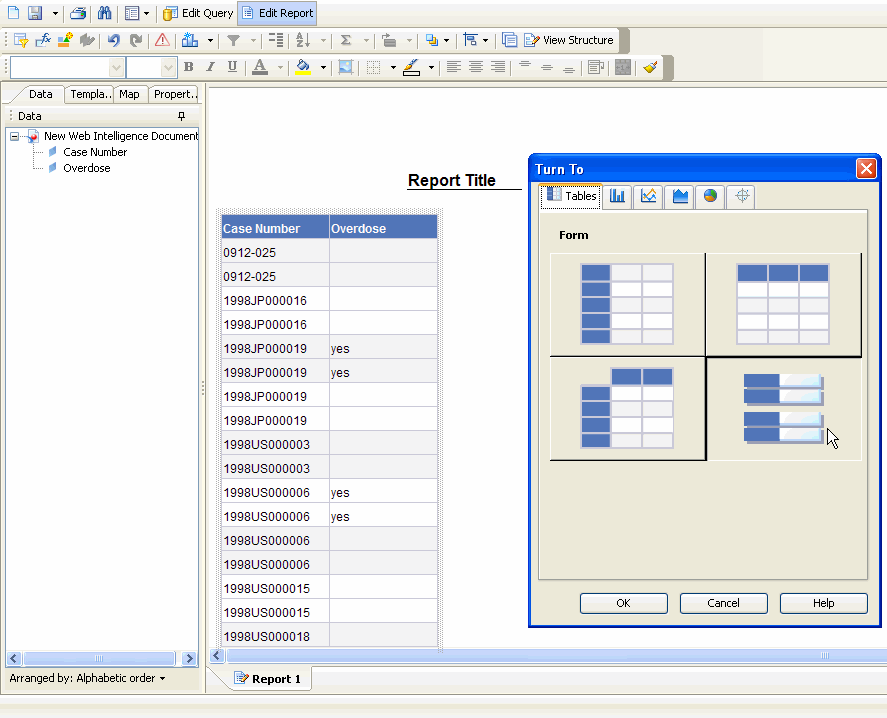
Click OK. The report output refreshes. The table is displayed in the selected format
Use the Turn to > Bar option to display data as a bar-chart. Use the following procedure to create a bar chart from a report.
While your report is displayed, select the Bar tab from the Turn To context menu option.The Turn to > Bar options appear in the report output section in the right frame.
Select the required bar format.
Click OK. The report output refreshes to display the selected format.
Use the Turn to > Line option to display data as a line-chart. Use the following procedure to create a line chart from a report.
While your report is displayed, select the Line tab from the Turn To context menu option.The Turn to > Line options appear in the report output section in the right frame.
Select the required line format.
Click OK. The report output refreshes to display the selected format.
Use the Turn to > Area option to display data as a area-chart. Use the following procedure to create an area chart from a report.
While your report is displayed, select the Line tab from the Turn To context menu option.The Turn to > Area options appear in the report output section in the right frame
Select the required area format.
Click OK. The report output refreshes to display the selected format.
Use the Turn to > Pie option to display data as a pie-chart. Use the following procedure to create a pie chart from a report.
While your report is displayed, select the Pie tab from the Turn To context menu option. The Turn to > Pie options appear in the report output section in the right frame
Select the required pie format.
Click OK. The report output refreshes to display the selected format.
Use the Turn to > Radar option to display data as a radar-chart. Use the following procedure to create a radar chart from a report.
While your report is displayed, select the Radar tab from the Turn To context menu option. The Turn to > Radar options appear in the report output section in the right frame.
Select the required radar format.
Click OK. The report output refreshes to display the selected format.
Use the Save menu option to save the reports you create by using Report Writer. You can save your reports in either Personal or Public folders. The reports you save are not a snapshot of the data displayed in the report output. Instead, the system stores the specific set of instructions (datamart fields you select) for extracting data from the datamart when you run the report. For example, if you run a report that you saved a week ago, the data in the report reflects any changes in the datamart as a result of the ETL process.
The following sections explain how to save reports and access saved reports.
Use the following procedure to save a report.
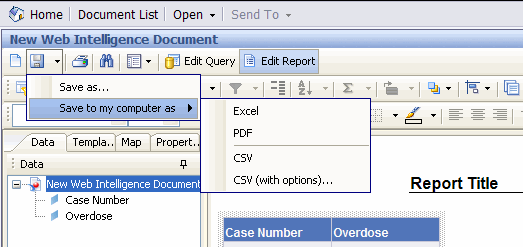
Click the Save icon in the left frame.The options for saving the report appear.

|
Tip: You can save the report in the Excel, PDF, CSV, and CSV (with options) formats. |
Click Save As to save the report on your system. The Save Document dialog box appears.
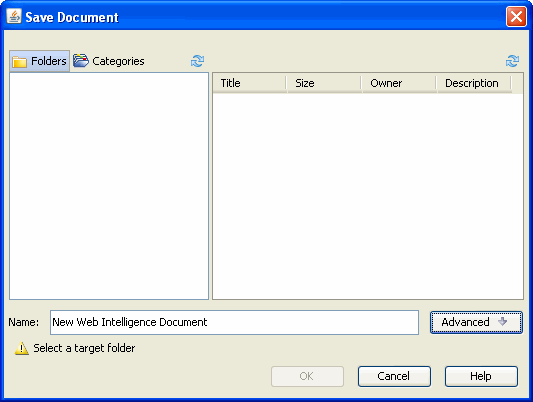
Enter the report name in the Title text box.
Enter the report description in the Description text area.
Select a Location folder to specify the location where the report needs to be saved:
Select the Public Folders > Report Writer folder if you want all users to be able access the report.
Select the My Folders > Favourites folder if you wish to save the report as a personal document.
Click OK to save the report in the location you specified.
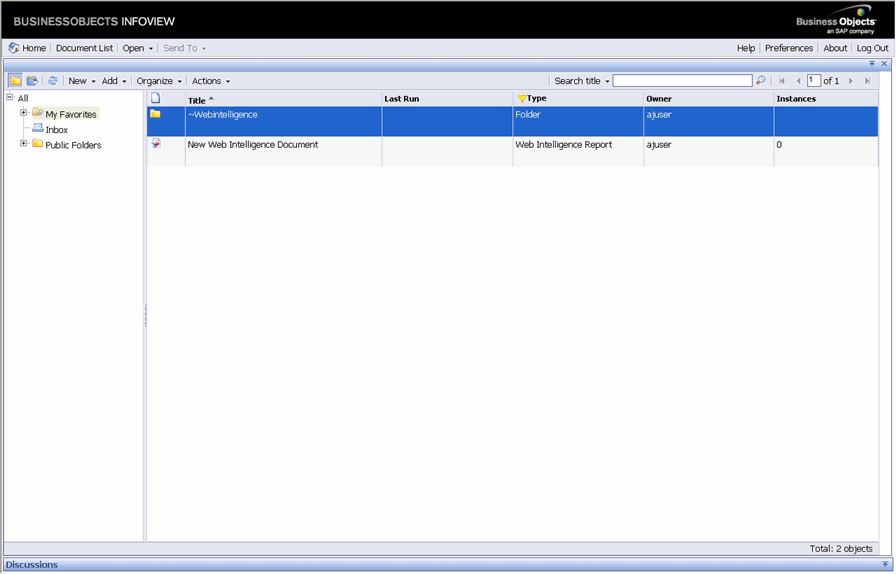
The reports you save in the My Favourites folder can be accessed from Case Series Reports > Report Writer > New > BO Infoview Home page > My Favorites. You can access the saved reports from the following screen.
|
Note: The Case Series Reports > Report Writer > Library menu is not available in Argus Insight anymore. |
Right-click a report and select Modify to edit a saved report. The report opens in the BOXI Web intelligence interface. After you edit the report, you can save it by another name by using the Save As option in the Save menu.
If a user selects an SMQ, all the cases based on that SMQ are displayed. The following section explains how to use SMQs in report writer.
Use the following procedure to use SMQs in report writer.
Go to Case Series Reports > Report Writer > New. The Business Objects (BO) Infoview window opens. Enter your login credentials.

The Business Objects (BO) Infoview window opens. Enter your login credentials.
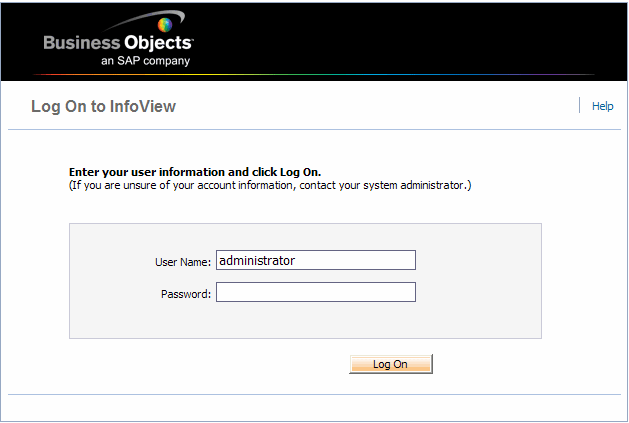
Click Log On. The Home page opens.
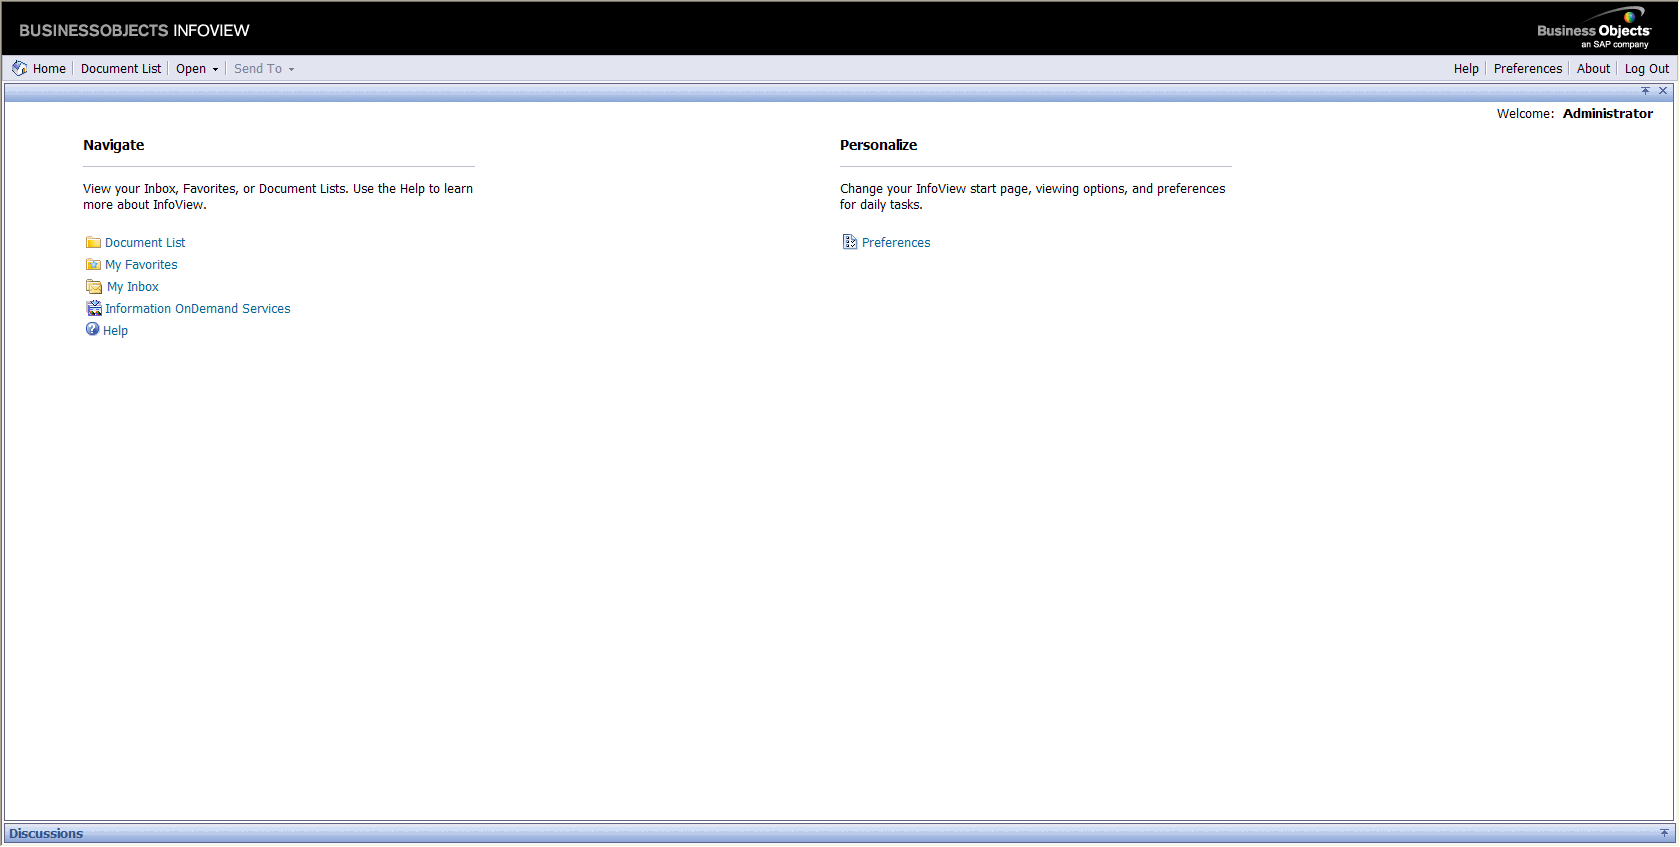
Click Document List. The following screen apeears.
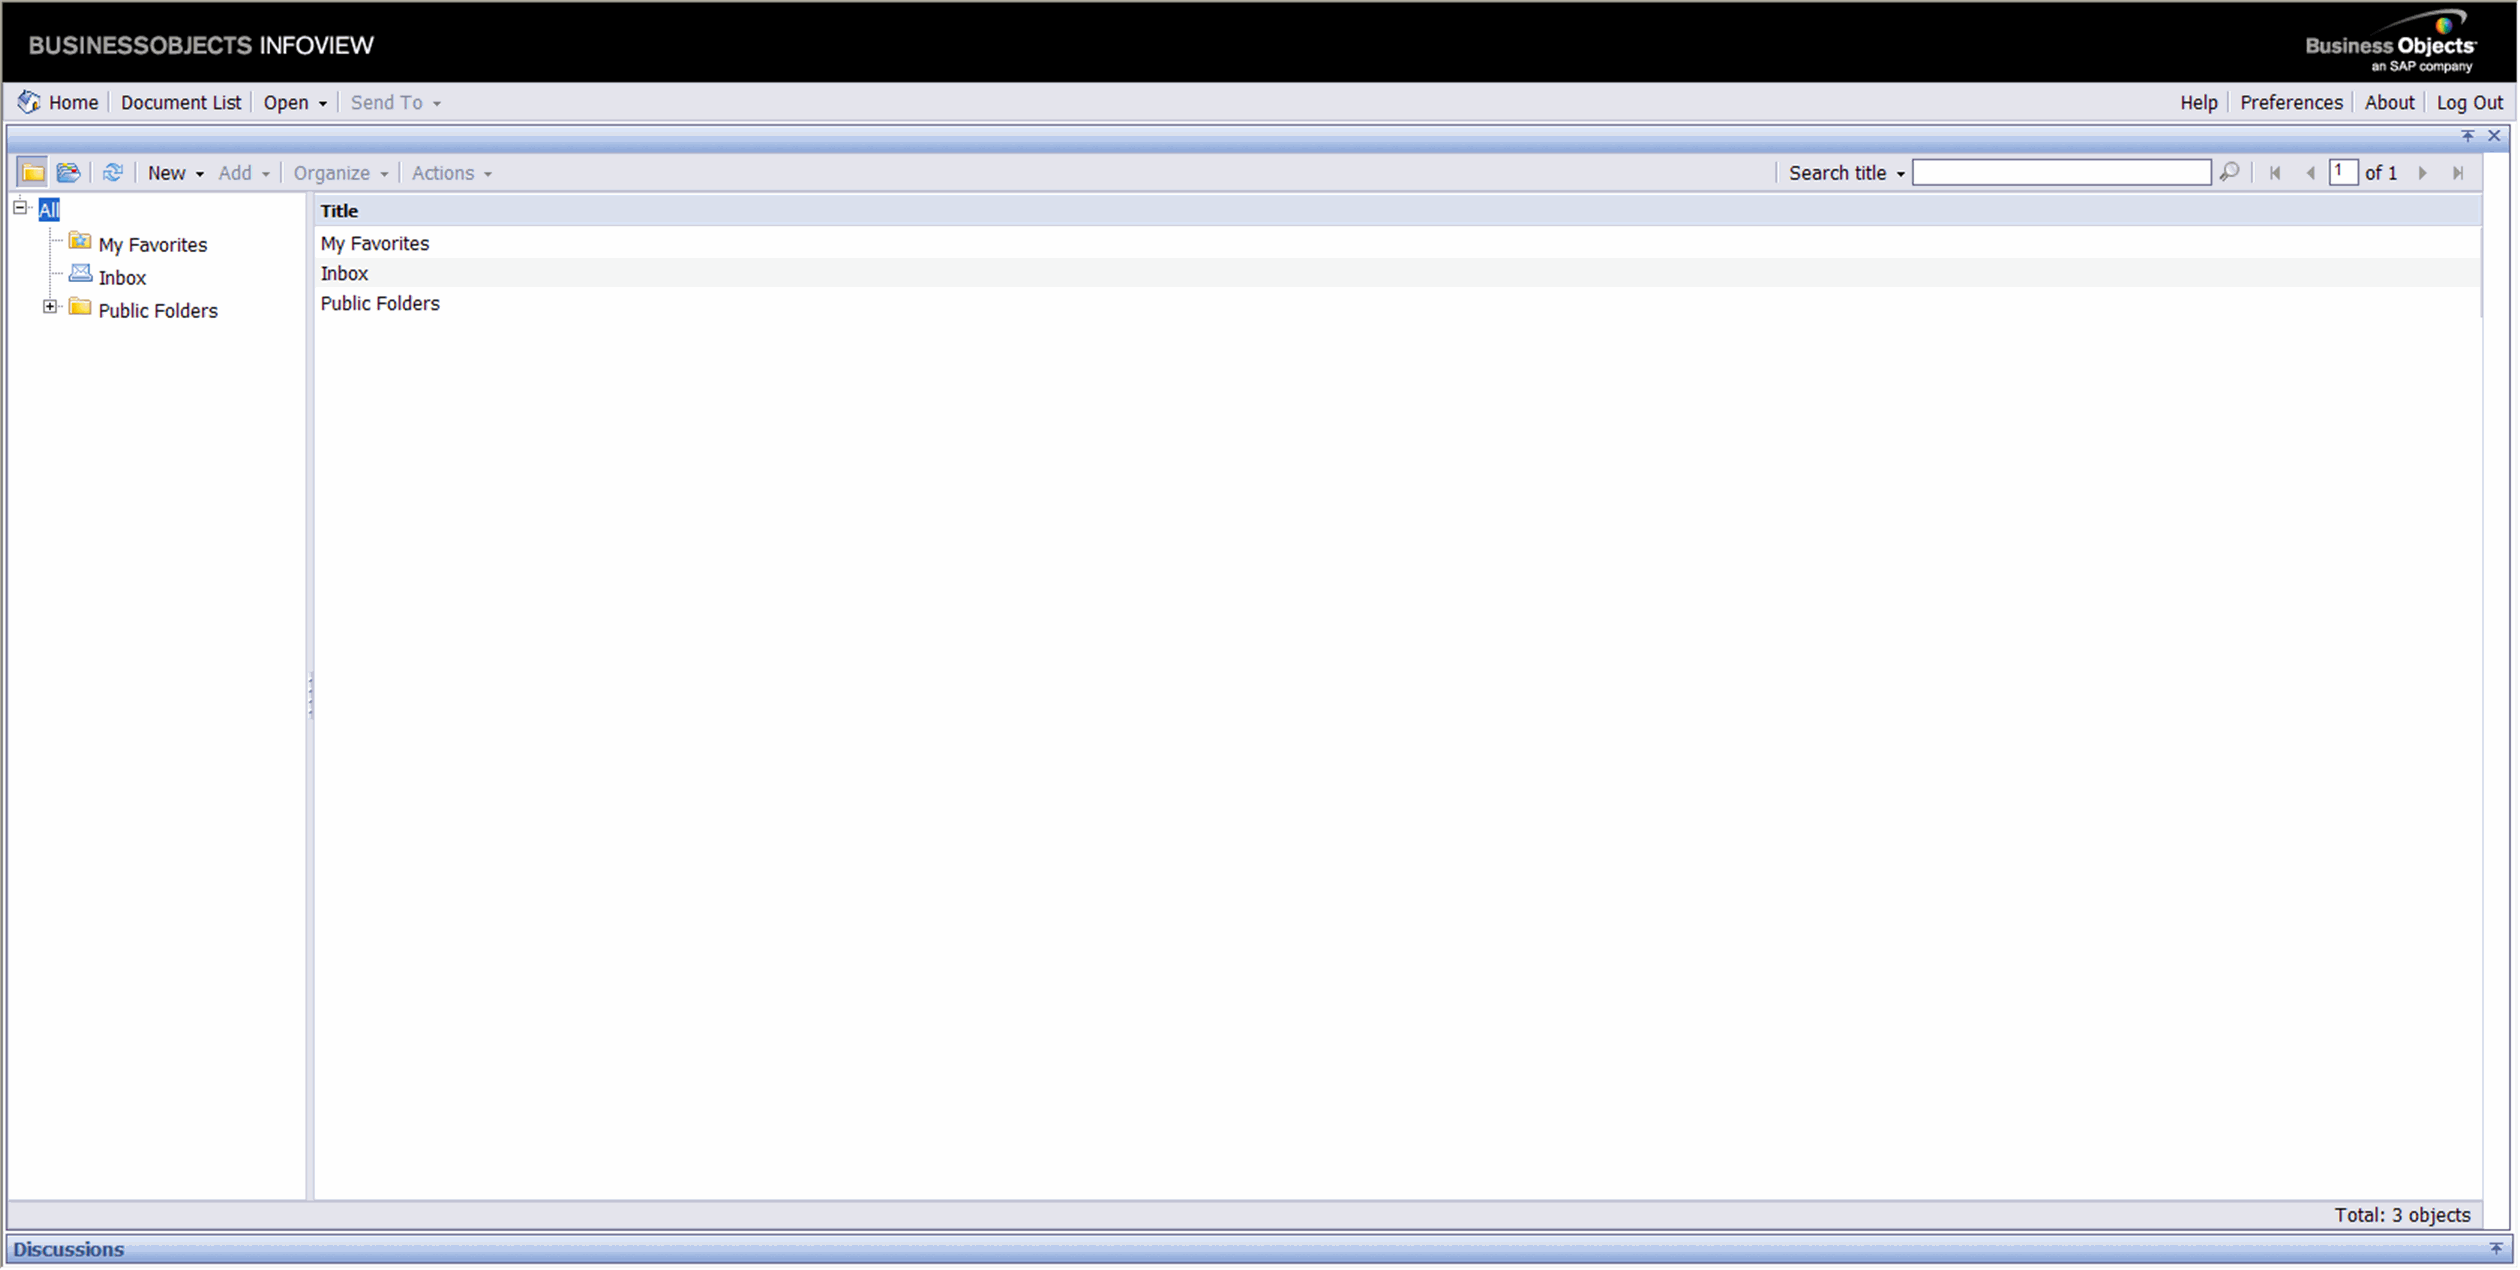
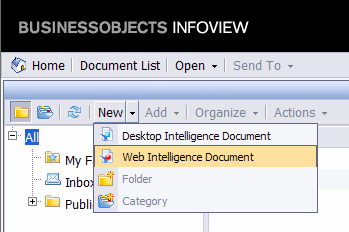
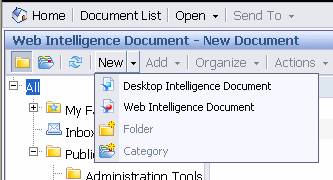
Go to New > Web Intelligence Document, as shown below.
The following screen appears.
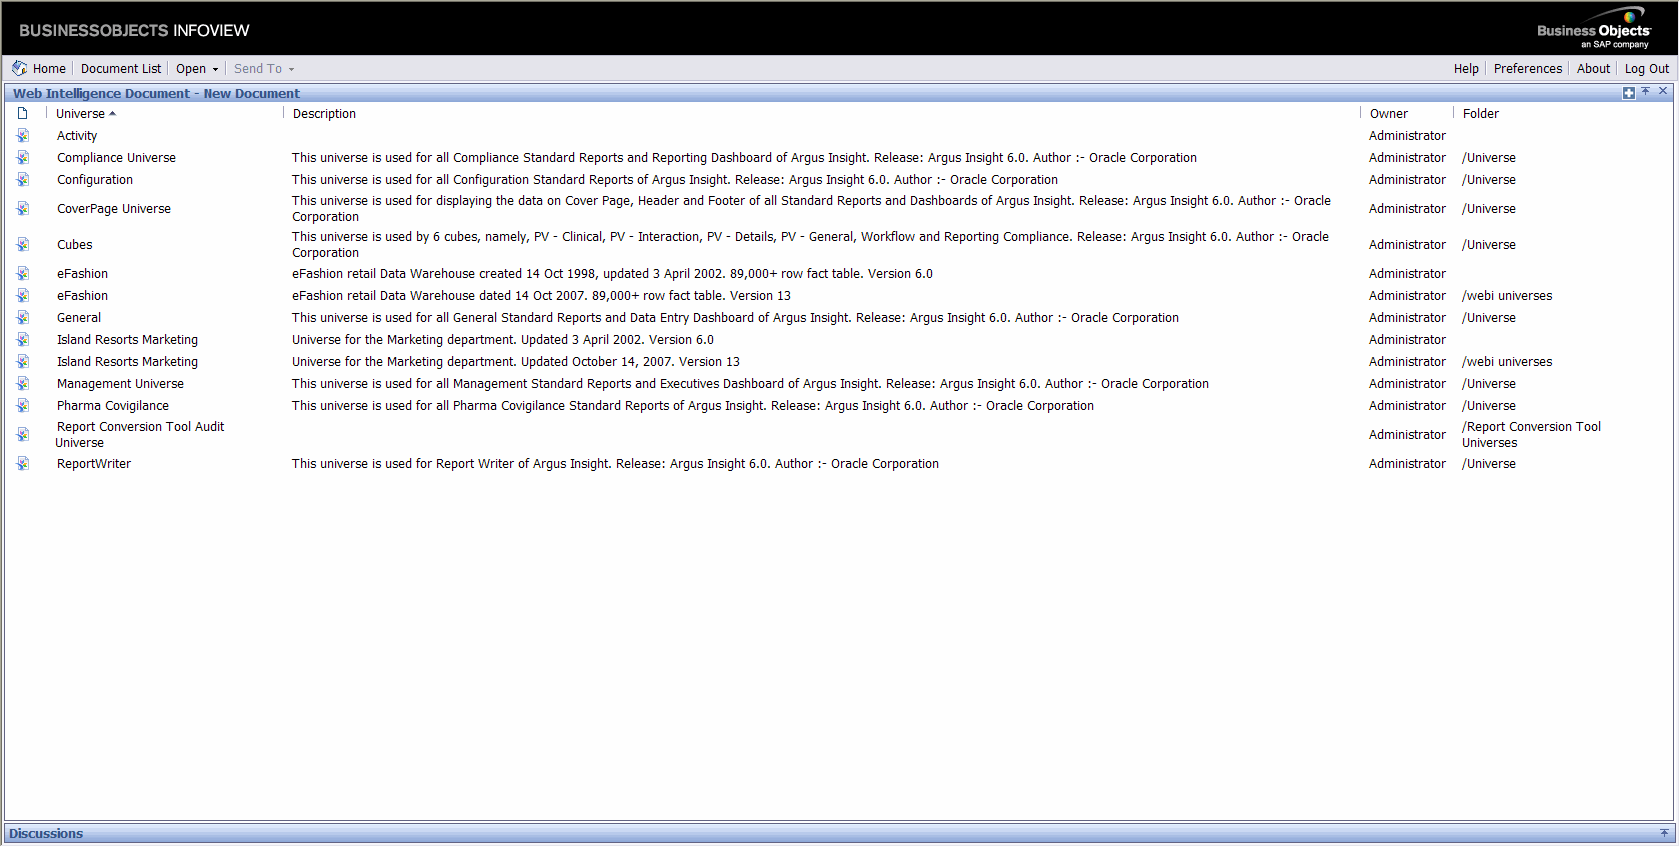
Click Report Writer. The following screen appears.

Under the Data tab, in Events - Event Information, either double-click Event SMQ (Broad) or drag-and-drop it to the Results Object pane, and click Run Query.
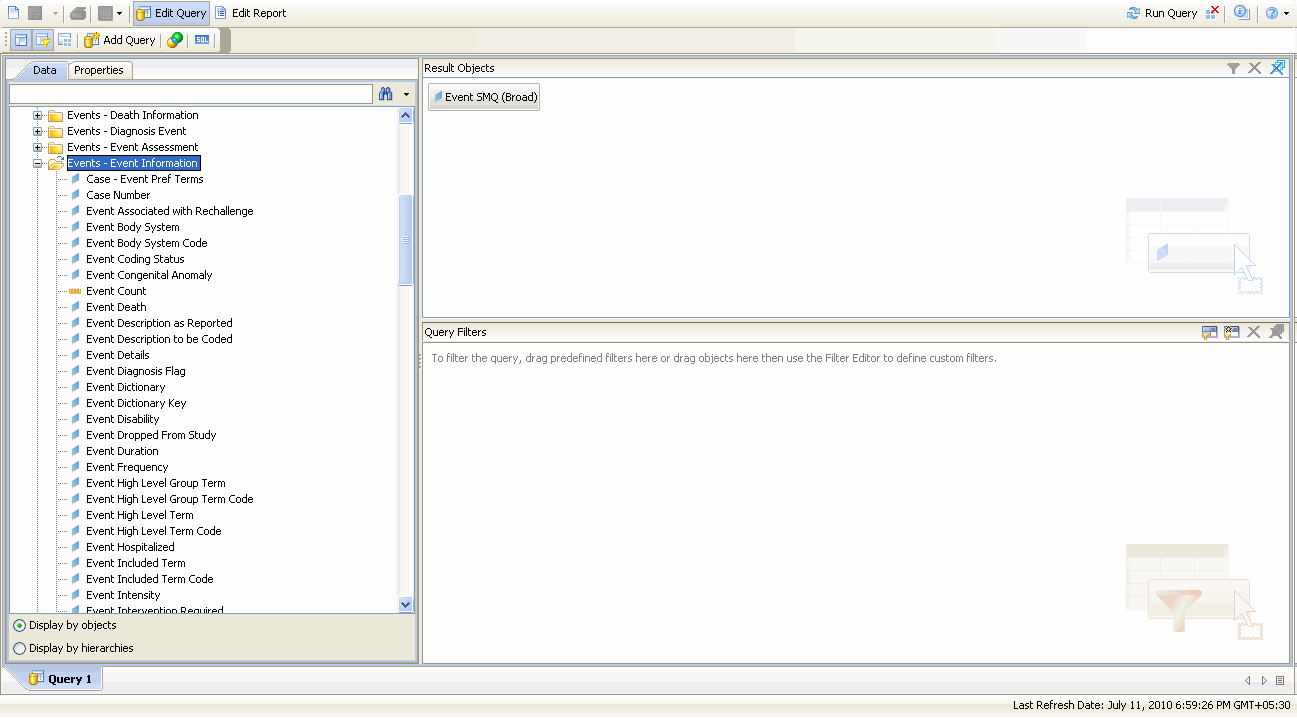
Click Edit Query to revert to the previous page. Perform a similar operation as shown in the above step for Event SMQ (Narrow).
Under the Data tab, in Events - Event Information, either double-click Case Number or drag-and-drop it to the Results Object pane, and click Run Query. This displays all the case numbers that correspond to the selected SMQ.
The term Case Annotation means the addition of notes to a case. An annotated case makes for better understanding about the case, due to the presence of notes added to describe anything relevant and important about the case.
Users can annotate cases within a case series as shown in the first row of the Notes column below.

The Annotate option for a case allows you to add a Note field for the respective case. This note is saved with the case series, and gets copied to a new case series if the case series where it was created is also copied.
While entering the notes, ensure that you do not exceed 200 characters. The note is then added through a context menu.
The created note remains with a case if the case series has been subsetted. Once entered, a note is saved for the case series. This means that you do not need to explicitly save a case series to save the note entered in it.
This note is applicable for the case in only the same case series where it was saved. It is not applicable even for the same case, if the case is in a different case series. This note also gets exported to Microsoft Excel when the Export to Excel functionality is used.
As shown in the following image, notes of a case series are retained when the case series merges with another case series. The text in the header "Notes from this series will be preserved in the merged case series" also displays the same.

A note can be frozen along with a frozen case series. Therefore, you cannot edit, add, or delete a note in a frozen case series. Similarly, if a user can access a case series, its corresponding notes can also be accessed and vice versa.
To use notes in Advanced Conditions, go to Case Series > Cases > Case Annotations. This field is a free hand text type field and supports single select only.
This Note is not available in Argus Safety and does not impact the case series there.
Use the following procedure to use case annotations in report writer.
Click Report Writer. The following screen appears.

Either double-click Event SMQ (Broad) or drag-and-drop it to the Results Object pane, and click Run Query. This displays all the results that match the selected SMQ.
AdHoc Reports is a repository where all the customized reports are saved. Argus Insight allows you to generate reports by using BO Infoview.
The biggest advantage of using BO Infoview is that it saves a lot of time, because the user does need to login each time. Additionally, the reports can also be shared among different users.
This section describes how to use BO Infoview and save the customized reports under the AdHoc Reports menu.
Use the following procedure to create a report through BO Infoview
In Argus Insight, go to Case Series Reports > Report Writer > New.

The BO Infoview Home page appears. Click Document List in the following screen.
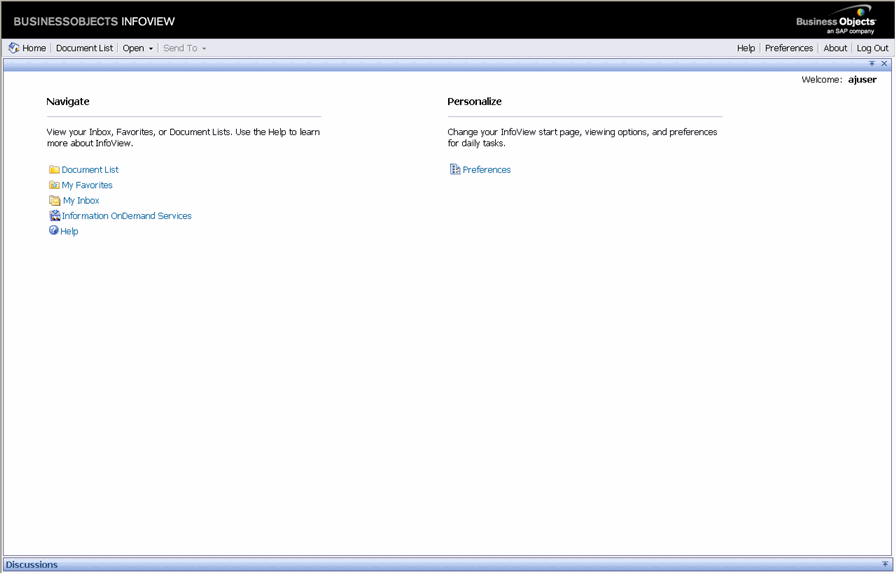
The following screen appears. Click the down arrow under New and select the type of document to be created.
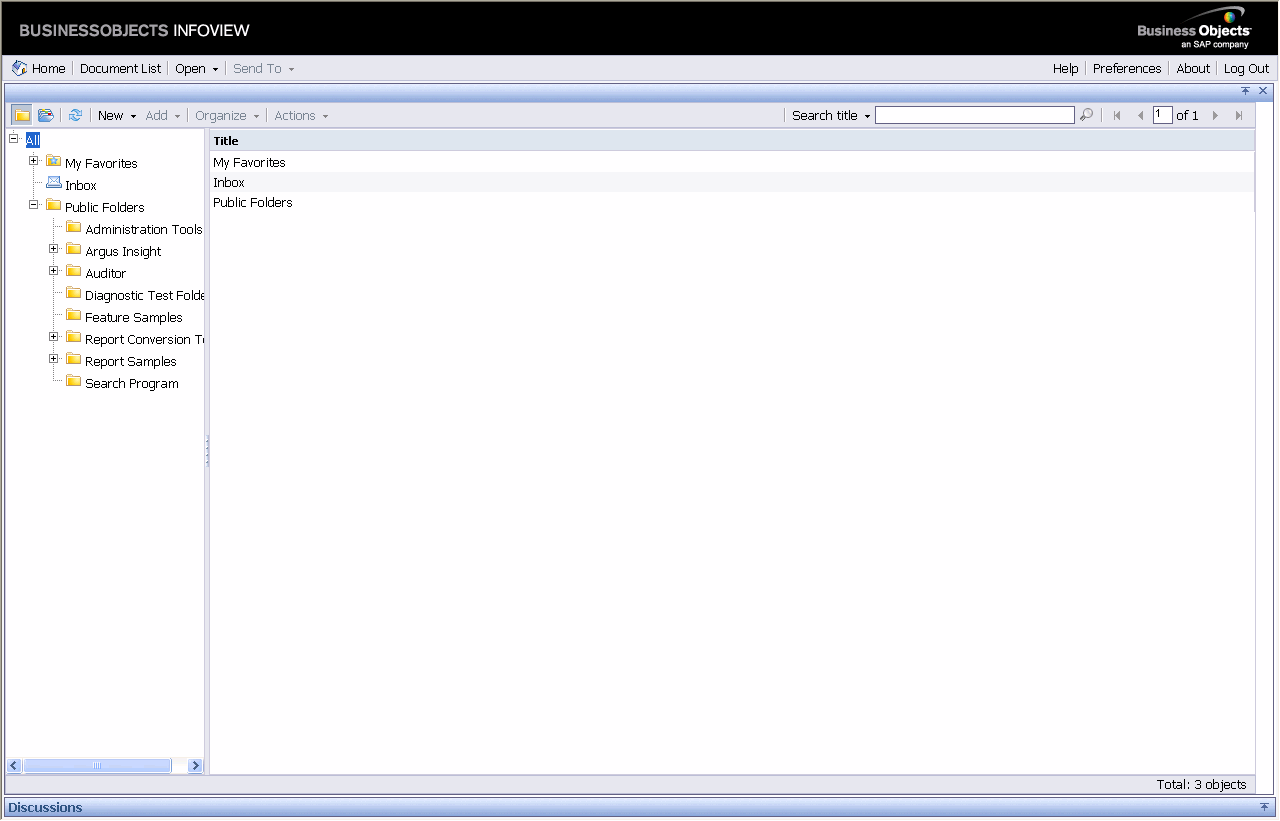
Click the down arrow under New and select the type of document to be created.
Copy or save the selected item to the folder structure corresponding to the Argus Insight menu.
|
Note: It is essential to use BO Infoview to access the saved ad-hoc reports, created by using BO Infoview. This is because such reports cannot be accessed through Argus Insight anymore. |