Example XRAY/RDBS debug session
In this session the target is named target-i386, the workstation is named workstation1 and all host tools are available. Several actors and drivers have been added to the system, and they have been compiled for system debugging.
Make sure you have enabled the system debugging during system generation (see "Compiling for Debugging"), then run DebugServer (see "Starting the DebugServer") and connect a console to target-i386. Run RDBS in the following manner:
% rdbs target-i386 |
Run XRAY (by using the "Sample XRAY Start-up Script", for example), then go to the Managers window and select the Connect tab.
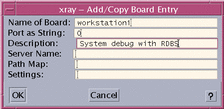
Select the Boards->Add or Copy board entry to register your target for system debug. XRAY opens the Add/Copy Board Entry pop-up dialog:

Enter the host name where RDBS is running in the Name of Board field. Enter the slot number used by RDBS (0 by default) in the Port as String field. Leave the other fields blank.
Note -
On Windows NT, XRAY uses native Windows pathnames and it not aware of the Cygwin UNIX emulation layer used by the ChorusOS host tools. As a result, pathname translations must be specified so that XRAY can translate the Unix-like pathnames returned by the DebugServer, or embedded in object modules, into native Windows NT pathnames. Typical pathname translations are /c/=C:\ and /d/=D:\. They must reflect the results of the Cygwin mount command.
After the dialog box is validated, the new board appears in the window. Connect to the RDBS server by double-clicking on it with the left mouse button.
This will connect you to RDBS, and through it to the DebugServer and the target. You can now view the system as it runs.
Enter the following in the command-line area of the Code window to see a list of actors running on the target:
Conn> stat actors |
Select the Process tab in the Managers window. The Available Processes list will show a single entry representing the system as process number 1. Double-clicking on it will stop the system and initiate a debugging session.
XRAY will present you with the list of actors for which symbols should be loaded. By default, all actors are selected and you can press the OK button. XRAY will find the executable files automatically. For some of them, it may not have the path and it will prompt for the pathname of the missing executable file. If the actor's binary file is statically linked, you must indicate the path where it is located. If the actor's binary file is relocatable, then your only option is to select Cancel, because system debugging does not support the debugging of actors loaded from relocatable binaries.
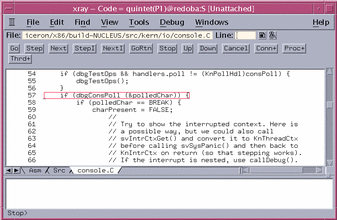
After all selected actors have been loaded, XRAY will show where the system has been stopped in the Code window. The name of the thread which was executing last, also known as the current thread, will be displayed in the title bar. Thread execution can now be controlled.

Think of a function you want to debug, myFunc() for example, and perform this command:
% scope myFunc |
XRAY displays the source code of the function in the Code window. You can place a breakpoint in it for the current thread by double-clicking with the left button on the selected line number. This will set a per-thread breakpoint, for the current thread.
If you do not know whether the current thread will execute this function, place a global breakpoint by opening a local menu with the right mouse button and selecting Set Break All Threads. Press the Go button to resume running the function.
Once the breakpoint has been reached, examine the values of variables by double-clicking on them with the right mouse button.
If the breakpoint is not reached, and the system continues to run, you can stop it asynchronously using the Stop button. The Code window will show the stop location.
Note -
Due to the way in which the stop operation has been implemented, this will always be the same location inside the clock interrupt handler, except if the system was blocked in a console input, or performing console output.
You can find the interrupted location by examining the stack with the Up button.
The chls tool
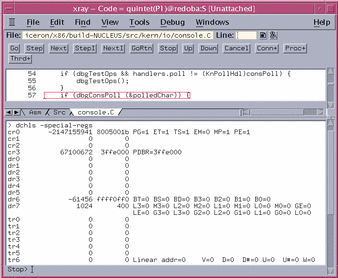
The chls tool is available from the XRAY command window with the dchls command. You can use this command to display values which are not directly visible in the XRAY windows. For example, to look at the processor specific registers, type the following command:
Stop> dchls -special-regs |

- © 2010, Oracle Corporation and/or its affiliates
