Starting Insight for System Debugging
Before starting Insight for system debugging, ensure that the debug agent is running on the target system and that the debug server is connected to it.
The name of the Insight executable differs according to the target platform and takes the form target-type-chorusos-gdb. Thus, depending on the platform, type one of the following to start Insight:
-
$ sparc-chorusos-gdb
-
$ powerpc-chorusos-gdb
-
$ i386-chorusos-gdb
Note -
By default, the Insight GUI is started when you start GDB.
To Connect to the Target
-
Select File -> Target Settings.
-
Select ChorusOS System Debug from the Target list.
-
In the Target name field, type the target name, as registered in the debug server.
-
In the Chserver host field, type the name of the host on which the debug server is running.
If the chserver uses the default slot, type chserver_host_name.
If the chserver does not use the default slot, type chserver_host_name:slot-id.
-
Click OK to save the target settings.
-
Select Run -> Connect to target.
Once you have connected to the target successfully, the symbols for
all components of your system image are automatically loaded. The connection
is complete when the message Successfully connected
is displayed.
Note -
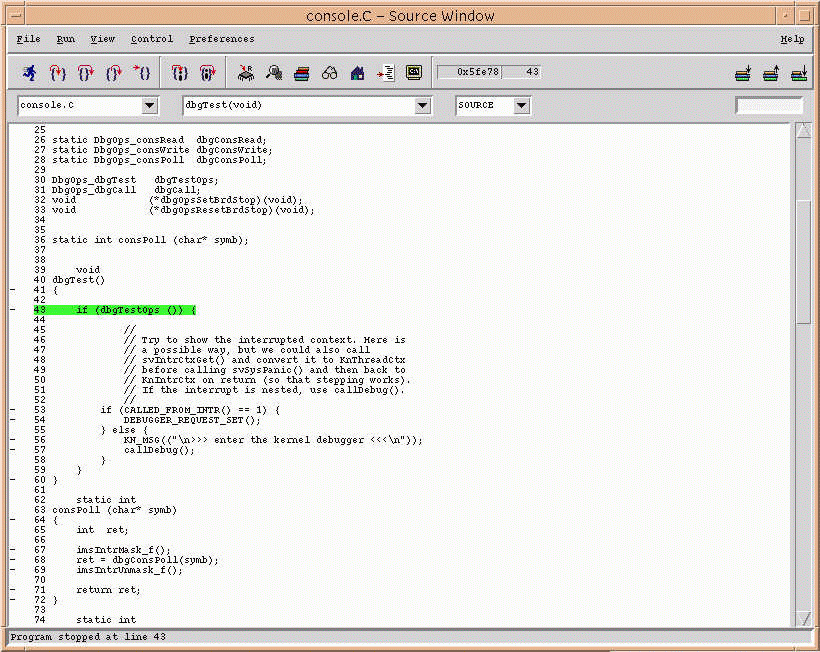
If you recompiled the microkernel from source after enabling symbolic debugging, the target stops executing and the line of code on which it stops is displayed in the Source Window when a successful connection is made.
Figure 3-2 Application Source Window

Using the Run button or selecting Run -> Run will reboot your ChorusOS target. You can also reboot your target using the Run command in the View -> Console window.
Selecting Run -> Connect to target before setting your target causes the Target Selection window to be displayed automatically.
- © 2010, Oracle Corporation and/or its affiliates
