Performance Profiling in Sun WorkShop
The Sampling Collector, available from the Debugging window, gathers performance data during the execution of an application and saves it to an experiment file. The Sampling Analyzer, a separate tool available from the Sun WorkShop main window, displays collected performance data and, if paging is causing a bottleneck, can create a file to instruct the linker to remap functions in memory.
The UNIX prof and gprof performance-profiling tools generate only user CPU information. With the Sampling Collector and Sampling Analyzer, you can get information about I/O time, system time, text and data page fault times, program sizes, and execution statistics, in addition to user CPU information.
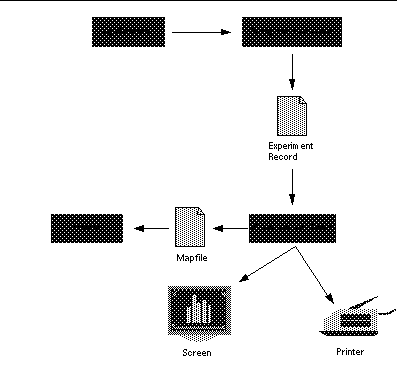
Figure 6-1 illustrates the basic performance-tuning architecture in Sun WorkShop.
Figure 6-1 Performance-Tuning Architecture

The Sampling Collector gathers performance data from the application and writes it to an experiment record. The Sampling Analyzer displays that experiment data online and can print the data to either a file or a printer. Additionally, the Sampling Analyzer can create a mapfile for the linker, and you can then recompile the application.
The following sections describe the basic steps involved in collecting and analyzing performance data. For more detailed information on any of the steps, see Analyzing Program Performance With Sun WorkShop, and "Analyzing Performance Data" and "Collecting Performance Data" in the online help for Sun WorkShop.
- © 2010, Oracle Corporation and/or its affiliates
