Setting Breakpoints
Set breakpoints to force the debugger to stop execution. You can set simple breakpoints to stop at a line of code, or in a procedure or function.
Set advanced breakpoints to break in C++ classes, track changes in data, break on a condition, break on special events, or create your own custom breakpoints.
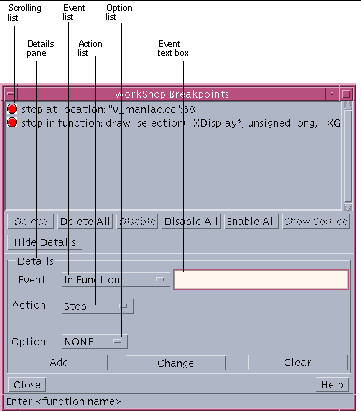
You can set and clear breakpoints in the editor window (see Figure 5-2) or the Breakpoints window (see Figure 5-4). In the editor window, you can set or clear a breakpoint at a line of code or in a function. In the Breakpoints window, you can set more complex breakpoints, such as a breakpoint when a signal occurs.
Setting Breakpoints in the Editor Window
To set a location breakpoint:
-
Click the line where you want the breakpoint.
-
Click the Stop At button.
The line is highlighted in red to indicate the breakpoint is set. If the line selected is not an executable line of source code, the debugger sets the breakpoint at the next line after the specified line that is executable.
To set a function breakpoint:
-
Select the name of the function where you want the breakpoint.
-
Click the Stop In button.
A message in the message area tells you that the breakpoint is set.
To remove a breakpoint, do the following:
-
Move the pointer to the line containing the breakpoint you want to remove.
-
Click the Clear At button to remove all breakpoints on the line.
Setting Breakpoints in the Breakpoints Window
To open the Breakpoints window, shown in Figure 5-4, choose Windows > Breakpoints or Execute > Set Breakpoints in the Debugging window.
To set a location breakpoint:
-
If the Details pane is not in view, click the Add/Change Breakpoint button.
-
Choose At Location from the Event list and type the file name and the line number in the text box, such as Foo.cc:21.
-
If it is not already set, choose Stop from the Action list.
-
Click Add.
The line is highlighted in red to indicate the breakpoint is set. If the line selected is not an executable line of source code, the debugger sets the breakpoint at the next line after the specified line that is executable.
To set a function breakpoint:
-
If the Details pane is not in view, click the Add/Change Breakpoint button.
-
Choose In Function from the Event list and type the function or procedure name in the text box.
-
If it is not already set, choose Stop from the Action list.
-
Click Add.
The breakpoint is added to the list of currently active breakpoints.
To remove a breakpoint, do one of the following:
-
Select a breakpoint in the scrolling list and click Delete.
-
Click Delete All to remove all breakpoints.
Disable and re-enable breakpoints as you move through your program.
Figure 5-4 Breakpoints Window

|
Scrolling list |
Shows the breakpoints and tracepoints assigned in your program. A breakpoint or tracepoint can be in one of three states: -- Enabled, indicated by a red stop sign -- Disabled, indicated by a gray, crossed-out stop sign -- Executed, indicated by an arrow |
|
Delete button |
Deletes the breakpoint or tracepoint from the source code and removes it from the scrolling list. |
|
Delete All button |
Deletes all breakpoints and tracepoints from the source code and removes them from the scrolling list. |
|
Enable button |
Enables the selected breakpoint or tracepoint and changes its glyph to a red stop sign. |
|
Disable button |
Disables the selected breakpoint or tracepoint and changes its glyph to a gray, crossed-out stop sign. |
|
Disable All button |
Disables all breakpoints or tracepoints listed and changes their glyphs to gray, crossed-out stop signs. |
|
Enable All button |
Enables all disabled breakpoints or tracepoints listed and changes their glyphs to red stop signs. |
|
Show Source button |
Shows the source line of the selected breakpoint or tracepoint in the editor window. |
|
Add/Change Breakpoints button |
Expands the Breakpoints window. Click to display options for adding or changing a breakpoint in your program. This button toggles to Hide Details. |
|
Details pane |
Lets you specify the details of a breakpoint. |
|
Event list |
Allows you to set where and when you want to pause program execution. |
|
Event text box |
Lets you specify the file name, line number, function name, class name, and so forth, of an event. |
|
Action list |
Lets you set breakpoint actions such as stopping and tracing. |
|
Option list |
Lets you place additional restrictions on a breakpoint or tracepoint. |
|
Add button |
Adds a breakpoint or tracepoint with the specified action, event, and option to the source code. In the editor window, a stop sign glyph appears to the left of the source line where the breakpoint or tracepoint appears, and the line is highlighted in red. The breakpoint or tracepoint also appears in the Breakpoints scrolling list. |
|
Change button |
Updates the event, action, and option of the selected breakpoint or tracepoint. |
|
Clear button |
Removes all entries from the Event, Action, and Option text boxes. |
|
Close button |
Closes the Breakpoints window. |
|
Help button |
Displays online help for the Breakpoints window. |
- © 2010, Oracle Corporation and/or its affiliates
