Displaying and Moving Through the Call Stack
The call stack is the list of procedures and functions currently active in a program. Prism provides you with methods for examining the contents of the call stack.
See " Where Graph" for a discussion of displaying the call stack in MP Prism.
Displaying the Call Stack
-
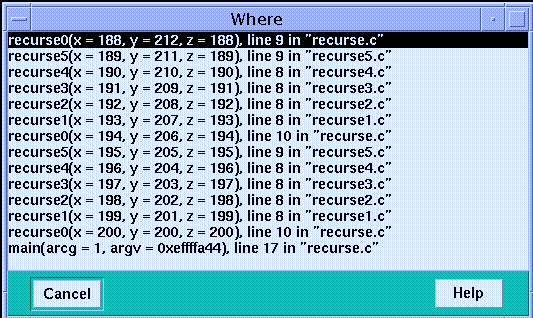
From the menu bar - Choose the Where selection from the Debug menu. The Where window is displayed; see Figure 4-4. The window contains the call stack; it is updated automatically when execution stops or when you issue commands that change the stack.
Figure 4-4 Where Window

-
From the command window - Issue the where command on the command line. If you include a number, it specifies how many active procedures are to be displayed; otherwise, all active procedures are displayed in the history region.
Values of arguments in displayed procedures are shown in the default radix, which is decimal unless you change it via the set $radix command; see " Changing the Default Radix".
Moving Through the Call Stack
Moving up through the call stack means heading toward the main procedure. Moving down through the call stack means heading toward the current stopping point in the program.
Moving through the call stack changes the current function and repositions the source window at this function. It also affects the scope that Prism uses for interpreting the names of variables you specify in expressions and commands.
Prism provides these methods for moving through the call stack:
-
From the menu bar - Choose Up or Down from the Debug menu. Up moves up one level in the call stack; Down moves down one level. These selections are available by default in the tear-off region.
-
From the command window - Issue the up command on the command line to move up one level. If you specify an integer as an argument, you move up that number of levels. Issue the down command to move down one level; specifying an integer moves down that number of levels.
-
From the Where window - If the Where window is displayed, clicking on a function in it changes the stack level to make that function current.
Scope in MP Prism
In MP Prism, the scope of the current process determines the scope for resolving the names of variables. See " The Current Process" for a discussion of the current process.
If a command applies to a pset other than the current set, Prism uses the scope of that set's current process.
It is possible that other members of the pset will have different scopes from that of the current process, or that its scope level will not even exist in these processes. In these cases, you receive an error message when you try to issue a command (for example, print or display) that requires a consistent scope. To solve the problem, you can do one of the following:
-
Restrict your pset so that it contains only members with the same scope.
-
If the current process's scope level does not exist in other processes in the set, you can use the up command to move up its call stack to a point where it has a scope level that does exist in the other processes.
-
If different processes in the set have different scopes, you can issue the up and down commands as needed to ensure that they all have the same scope.
Commands such as pset and process that affect scope print the current function when you issue them.
Where Graph
In scalar Prism, choosing Where from the Debug menu displays the call stack for the program; see " Displaying and Moving Through the Call Stack". A message-passing program, however, can have multiple call stacks, one for each process. To show the relationships among these call stacks, MP Prism provides a Where graph; this window displays a snapshot of the dynamic call graph of the program. Information is displayed for all processes that are not running.
To display the Where graph:
-
From the menu bar - Choose Where from the Debug menu.
-
From the command line - Issue the command
where on dedicated
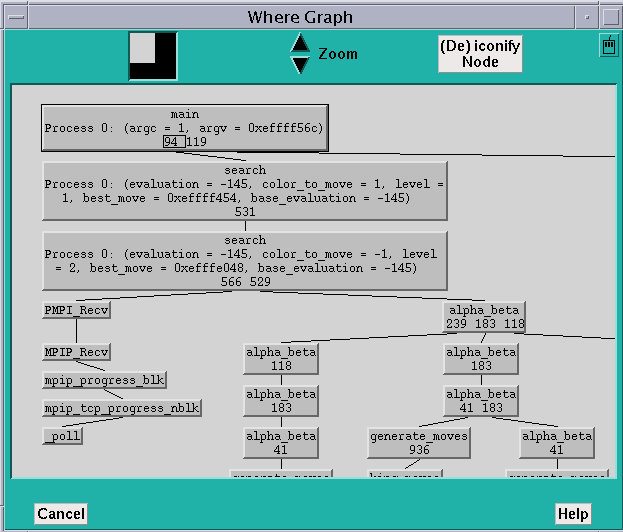
A window like the one shown in Figure 4-5 is displayed.
Figure 4-5 Where Graph

The Where graph centers on the current process of the current pset--that is, the processes related to it are lined up in a single column. In Figure 4-1, process 0 is the current process. If you change the current process, the Where graph rearranges itself. The default zoom level of the Where graph shows the arguments for the current process.
At the bottom of each box are line numbers indicating where processes branch.
Shift-click in each function's box to display a pop-up window showing the numbers of the processes with this function in their call stack, along with their arguments.
Panning and Zooming in the Where Graph
As Figure 4-6 shows, the Where graph can get quite large, so MP Prism provides methods for panning through it and zooming in and out.
The white box in the navigator rectangle at the top of the window shows the position of the display area relative to the entire Where graph. You can either drag the box or click at a spot in the navigator. The box moves to that spot, and the window shows the Where graph in this area of the total display.
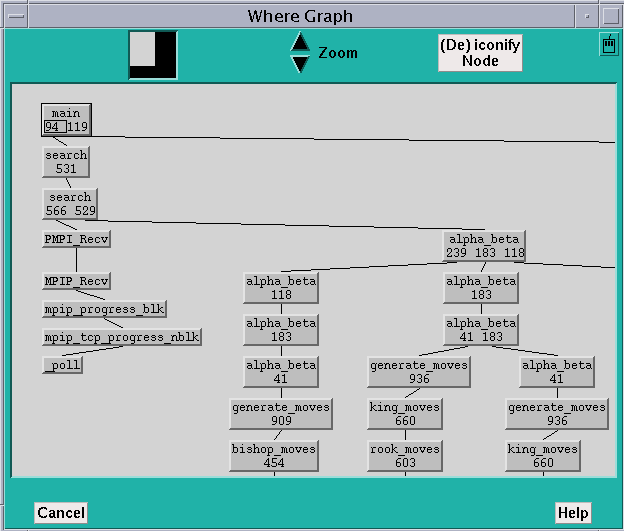
To display more of the Where graph at the same time, click on the Zoom down arrow to the right of the navigator. This reduces the size of the boxes representing the functions and removes information. Figure 4-6 shows the Where graph of Figure 4-5, zoomed out one level. Note that the information about the current process's arguments is gone.
Figure 4-6 Where Graph, Zoomed Out One Level

Zooming out one more level removes the line numbers, and one more level after that removes the function names, leaving only boxes connected by lines. You can still shift-click on a box to display information about it.
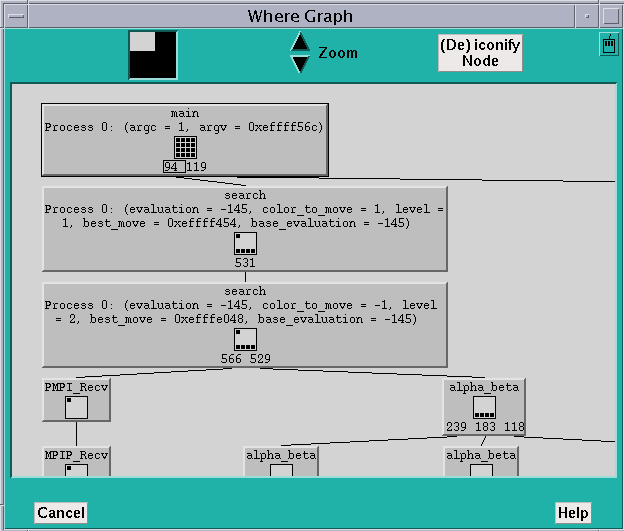
Clicking on the Zoom up arrow increases the size of the function boxes and includes more information in them. Figure 4-7 shows the Where graph of Figure 4-5, zoomed in. In this case, the Where graph shows, for each function, the processes that have that function in their call stack. As in the Psets window, the processes are represented as bitmaps of cells, numbered starting at the upper left, increasing from left to right and then jumping to the next row.
Figure 4-7 Where Graph, Zoomed In

Zooming in another level shows all arguments for all processes.
Shrinking Selected Portions of the Where Graph
You can shrink selected portions of the Where graph. This is useful if you want to see the overall structure of the graph, but in addition want to focus on certain functions.
Middle-click on a function to iconify it and all of its children. Middle-click on an iconified function to re-expand it and its children to the current zoom level.
Alternatively, you can click on the (De)iconify Node button next to the Zoom arrows at the top of the Where graph. This changes the mouse pointer to a target. You can then left-click on a function to iconify it and its children. If it is already iconified, left-clicking on it will re-expand it and its children. To cancel the operation, left-click anywhere outside of the boxes surrounding the functions.
Moving Through the Where Graph
When you first display the Where graph, the main function is highlighted. You can left-click on a function to highlight it. Or, you can move through the Where graph via the keyboard:
-
Use the up arrow key to move to the parent of the highlighted function.
-
If line numbers are visible in the highlighted function, by default the leftmost number is selected by having a box drawn around it. Use the left and right arrows to select other line numbers in the function. You can then use the down arrow key to highlight the function called at the selected line.
Making a Function the Current Pset
Pressing the spacebar while in the Where graph does the following:
-
It displays the highlighted function in the source window.
-
It creates a new current pset, with the same name as the function, and containing the processes with this function in their call stack. The current process of this current set is the lowest-numbered process in the set.
Issuing the where Command in MP Prism
Issuing the where command by default displays (in the history region) the call stack consecutively for each process in the current set (or in the pset you specify via the pset qualifier).
Issuing the command
where on dedicated
displays the Where graph, as described above.
Issuing the command
where on snapshot
puts the history-region output into a window; it does not create a Where graph.
- © 2010, Oracle Corporation and/or its affiliates
