Chapter 6 Obtaining MPI Performance Data
Prism lets you collect and examine performance data on your Sun MPI program. Collecting and analyzing performance data can help you discover and tune problem areas in your program.
See the following sections:
Overview of MPI Performance Analysis
It is not always important to optimize all of your code. Rather, certain parts will account for most of the run time and only those parts need be optimized. Thus, it is important to be able to identify time-consuming parts of your code, evaluate their performance, and characterize those parts so that tuning can be effective. Prism helps you to determine how efficiently the various parts of your Sun MPI program run and where your program's performance can be improved. It does this by providing data on MPI communication events, and on pairs of such events, called intervals.
Prism generates this information when running Sun MPI programs with a specially modified version of the Sun MPI 4.0 library. The modified library includes macro codes that act as selectively controllable tracepoints (probes). The probes employ Trace Normal Form (TNF), an extensible system for instrumenting program code. Each API-level routine in the library has been instrumented with a start probe and an end probe.
Note -
You can also add TNF probes directly to your code if your programs are written in C or C++. TNF does not support the direct insertion of probes into Fortran code. For information about creating TNF probes, see the Solaris man page TNF_PROBE (3X).
You can use Prism's TNF analysis features to identify situations in which the synchronization in your MPI program is poor. For example, a receiver may wait for data from its corresponding sender--leaving processes idle. You can use Prism's MPI performance analysis features to identify which routines are responsible for performance differences. Then you can use what you've learned about your program to adjust your algorithm and improve your program's performance.
For further information about the TNF-instrumented Sun MPI library, see Appendix C of the Sun MPI 4.0 Programming and Reference Guide.
For a general discussion of profiling methodology, emphasizing the use of timers, as well as discusions of profiling utilities not discussed in the current chapter, see Appendix C, General Profiling Methodology, Timers, And Other Profiling Utilities.
Prism works with both 64-bit or 32-bit binaries on Solaris 7. However, it cannot do performance analysis of 32-bit binaries unless you use the -32 option when you start Prism on Solaris 7 with the 32-bit program. For further information see "Use the -32 Option to Load 32-Bit Binaries For Performance Analysis on Solaris 7".
Getting Started
To start using Prism's TNF performance analysis, you can load your Sun MPI program into Prism and issue these three commands:
-
Select Collection, from Prism's Performance analysis menu, or issue the tnfcollection on command from Prism's command line. For example:
(prism all) tnfcollection on
-
Select the Run command from Prism's Execute menu or issue the run command from Prism's command line. For example:
(prism all) run
-
Select Display TNF Data from Prism's Performance analysis menu, or issue the tnfview command from Prism's command line. For example:
(prism all) tnfview
The details that describe Prism's performance analysis, and how you can gain greater control of those details, are described in the rest of this chapter.
Requirements of MPI Performance Analysis
You can use Prism's MPI performance analysis features on your Sun MPI program with a minimum number of requirements:
-
Environment - Prism's performance analysis features use the values of two environment variables, LD_LIBRARY_PATH and PRISM_TNFDIR.
-
Commands - To collect and analyze probe trace data, you need only use Prism's TNF commands.
-
Probes - To specify the precise probes to use in your analysis, you need only identify the individual probes by name, by wildcard, or by group.
The following sections describe these three categories.
Note -
You do not need to compile your program with the -g argument to use the TNF performance analysis features of Prism.
Environment Variables
Prism uses the values of two environment variables for performance analysis, PRISM_TNFDIR and LD_LIBRARY_PATH.
PRISM_TNFDIR
Prism uses space in a target directory (by default, /usr/tmp) to store the temporary data generated by the TNF probes. Prism's performance analysis generates large volumes of data, particularly for long-running programs or programs with high process counts. As a result, performance analysis can fail if insufficient disk space is available in the target directory. By default, Prism sets aside 128 Kbytes of storage in the target directory for TNF data. If 128 Kbytes is insufficient for your needs, you can increase the amount of the storage available by using the size parameter of the tnffile command.
If your trace buffer files are too small, once the buffer fills up your data will begin to overwrite older data in the trace buffer. If your trace buffer files exceed the size of your target directory, the data collection process will fail at that stage, before creating the final data file required by tnfview. When you have limited space available in your trace buffer directory, you can shorten the collection time using the tnfcollection command as an event action specifier (for further information about using the tnfcollection command as an event action specifier, see " Actions in Events") or you can limit the types of events collected using the tnfenable command (for further information about using the tnfenable command to selectively control which probes are enabled, see "Enabling Probes Selectively").
You can also define another location for the trace buffer files by setting an environment variable, PRISM_TNFDIR, to the location you choose. For example,
% setenv PRISM_TNFDIR /home/user/tnfdata/tmp
Note -
If you set PRISM_TNFDIR to an NFS-mounted directory, your performance analysis data will be affected by the extra time required for writing the data to non-local directories.
LD_LIBRARY_PATH
Prism uses the value of the LD_LIBRARY_PATH environment variable to identify the directory containing the TNF-instrumented Sun MPI library.
Note -
The LD_LIBRARY_PATH environment variable must be set before issuing Prism's run command.
You can set this environment variable before launching Prism or from the Prism command line. The tnfcollection on comand sets LD_LIBRARY_PATH automatically.
You can change the value of this variable using the Prism's setenv command on Prism's command line. For example:
(prism all) setenv LD_LIBRARY_PATH directory
Settting LD_LIBRARY_PATH For 32-Bit Programs
The standard location for this library for 32-bit programs, running on either Solaris 2.6 or Solaris 7 environments, is /opt/SUNWhpc/lib/tnf. For example, using the C shell:
% setenv LD_LIBRARY_PATH /opt/SUNWhpc/lib/tnf
Settting LD_LIBRARY_PATH For 64-Bit Programs
The standard location for this library for 64-bit programs, on the Solaris 7 environment, is /opt/SUNWhpc/lib/tnf/sparcv9. For example, using the C shell:
% setenv LD_LIBRARY_PATH/opt/SUNWhpc/lib/tnf/sparcv9
MPI Performance Analysis Commands
Prism supplies several commands that allow you to control MPI performance analysis. Only two commands are essential, as long as you accept the default behavior of the commands. The two essential commands are tnfcollection on and tnfview, described later in this chapter. If you chose to exercise greater control over the behavior of the process of MPI performance analysis, you can exercise that control with the additional performance analysis commands.
The Prism MPI performance analysis commands are listed in Table 6-1.
Table 6-1 Performance Analysis Commands|
Commands |
Description |
|---|---|
|
Creates the final target file (and optionally sets the trace buffer's size) for TNF probe data. |
|
|
Enables selected TNF probes. |
|
|
Redirects TNF probe data to stderr. (This command requires that the Prism run command has been executed.) |
|
|
Disables selected TNF probes. (This command requires that the Prism run command has been executed.) |
|
|
Turns on | off the TNF collection process. |
|
|
Displays selected probes and their enabled state. (This command requires that the Prism run command has been executed.) |
|
|
Displays for analysis the probe data contained in the TNF target file. |
For detailed information about the syntax of Prism TNF commands, see the examples in this chapter and the Prism 6.0 Reference Manual.
TNF Probes
Several of the Prism TNF commands (tnflist, tnfdebug, tnfenable, and tnfdisable) take arguments specifying probes by name, by wildcard, and by group name.
The Sun MPI 4.0 Programming and Reference Guide contains a complete list of the names of the probes in the TNF-instrumented Sun MPI library. The list includes the fields defined for each probe.
You can specify probes using arguments that include shell pattern matching wildcards, such as the asterisk (*). These wildcards take the form described in the fnmatch(5) man page.
You can also specify probes by group name. The TNF probe groups defined in the TNF-instrumented version of the Sun MPI library are listed in Table 6-2.
Table 6-2 Sun MPI Library TNF Probe Groups|
Probe Group |
Description |
|---|---|
|
mpi_api |
All API-level MPI functions |
|
mpi_pt2pt |
Functions that initiate point-to-point communications |
|
mpi_blkp2p |
All blocking point-to-point calls |
|
mpi_nblkp2p |
All nonblocking point-to-point calls |
|
mpi_coll |
Collective routines |
|
mpi_procmgmt |
Functions that deal with spawning and connecting to jobs |
|
mpi_comm |
Functions that create and manipulate communicators |
|
mpi_datatypes |
Functions that manipulate types or data in respect to types |
|
mpi_request |
Functions that create or operate on requests |
|
mpi_topo |
Functions that create and manipulate topology layouts |
If you choose to insert TNF probes into your own code, you must define your own probe group identifiers. Group identifiers are required in order to use the group name as an argument to the tnfenable, tnfdisable, tnfdebug, and tnflist commands. To add group identifiers to any probes that you create, use the keys argument to the TNF_PROBE macro. For information about the TNF_PROBE macro, see the TNF_PROBE(3X) man page.
Note -
Neither the names of probes that you define nor the names of probe groups that you define should start with mpi_.
Collecting Performance Data
Prism's MPI performance analysis involves several steps. The tnfcollection and tnfview commands shorten the sequence of steps by taking several automatic default values. If you chose not to accept the default behavior of the tnfcollection and tnfview commands, you can override the default behavior by issuing the individual performance analysis commands with values of your own choice. For a complete list of the performance analysis commands, see Table 6-1.
To Run Prism's MPI Performance Analysis
-
Issue the tnfcollection on command, or select Collection from the Performance menu:
-
Adds /opt/SUNWhpc/lib/tnf to your LD_LIBRARY_PATH.
-
Establishes a default file name for the TNF data.
-
Sets the minimum size for data collection buffers (128 Kbytes).
-
Enables all probes.
-
Turns on TNF data collection.
Note -If you prefer to control the naming of TNF data files, you can define your own TNF data file name with the tnffile command before issuing the Prism run command. Using tnffile, you can specify the name of the final trace data file and the size of the trace data collection buffers. The file name substitutes for the automatically generated file name created by the tnfcollection on command. The size argument allows you to specify the size of the data collection buffers used by each process of your program. However, if you specify a file name that already exists, Prism issues an error message "file already exists" and ignores the tnffile command.
-
-
Issue Prism's run command
Prism automatically creates the file name for the TNF trace data. Prism creates the file, then displays the file name in a message in the Prism command window. For example:
TNF data will be saved in file /home/mycomm/tests/prism0308.0.tnf
At the conclusion of the run, Prism collects the information from each process and merges the data in the named TNF data file.
-
Issue the tnfview command after the program completes to display the current TNF data file
You can also launch the TNF viewer by selecting Display TNF Data from the Prism Performance menu.
Note -You can repeat steps two and three as often as you wish. Each time that you run your program, Prism creates another TNF data file.
Naming TNF Data Files and Controlling Data Collection Buffer Size
If you use the filename argument of the tnffile command to specify the name of the TNF data file, such as myfile.tnf. Prism will remember that file name. If you then issue the tnfview command without specifying a file name argument, Prism will supply the file named in the prior use of the tnffile command during the same session.
The second argument to the tnffile command, the size argument, allows you to control how large the trace data collection buffers will be for each process in your Sun MPI program. The default size is 128 Kbytes. For further information about the size of trace data files, see "Controlling Buffer Size".
Specifying Which TNF Probes to Enable
During program execution, only the enabled TNF probes contribute trace data to the performance analysis process. By default, programs start with TNF probes disabled. Once enabled (by issuing the tnfenable command, for example), probes remain enabled until you explicitly turn them off, exit the loaded program, or exit Prism.
For example, to enable all probes in the TNF-instrumented Sun MPI library:
(prism all) tnfenable mpi_api
You could also enable all of the same probes with:
(prism all) tnfenable *
Turning on the Collection Process in Subsets of Your Code
You can use the tnfcollection command as an event action specifier, focusing the effect of TNF data collection on the places in your program that matter most. For example, set breakpoints before and after an interesting part of your program:
(prism all) tnfenable mpi_api
(prism all) stop at foo {tnfcollection on}
(prism all) stop at bar {tnfcollection off}
Prism collects TNF trace data only where you tell it to. For more information about event action specifiers, see " Actions in Events".
Using a .prisminit File to Start the Collection of Performance Data
If you use a specific directory to run TNF performance analysis, you can set up a .prisminit file in that directory containing a typical set of TNF-related startup commands. For example, you could create a .prisminit file containing these lines:
tnfcollection on
run
wait
tnfview
For further information about .prisminit files, see " Initializing Prism".
Displaying Performance Data
The tnfview program supplies several different ways to view TNF probe data. You start tnfview by selecting Display TNF Data from the Prism Performance menu, or by issuing the tnfview command from the Prism command line. For example,
(prism all) tnfview myfile.tnf
You do not need to specify a file name as an argument to the tnfview command unless you want to select an alternative TNF data file, created earlier or in another session. Prism will remember the TNF data file name created most recently during the current session.
The main window of tnfview displays a timeline view of the TNF probe trace data. The secondary window, the Graph window, displays several graphical views of datasets that you can create from the probe trace data. The three views provided by the Graph window are:
-
Scatter plot view
-
Table view
-
Histogram view
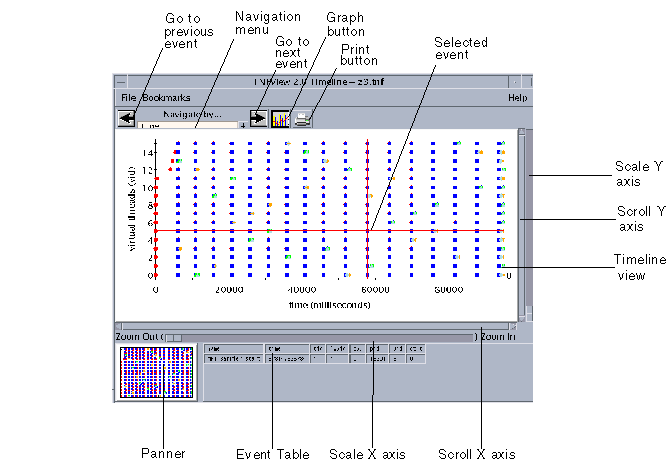
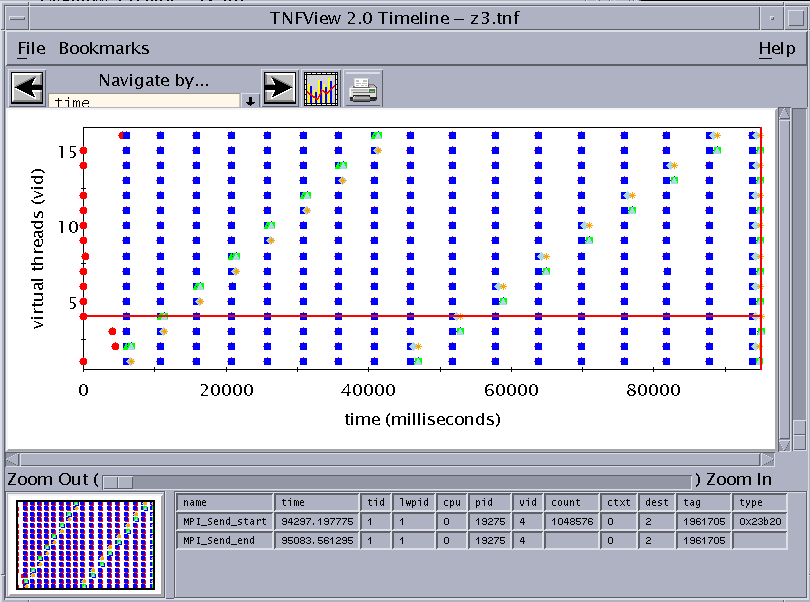
Figure 6-1 shows the main window of the TNF Viewer with a 16-process MPI program loaded. It is within this window that you examine the sequences of events, displayed as colored shapes, that make up your program's execution. This window requires you to operate primarily with a mouse.
Figure 6-1 Timeline View
Using the tnfview Timeline Window
The main tnfview screen displays the timeline of events generated by your program. Events of different types are represented by different colored shapes. Clicking on a single event selects it. Shift-clicking selects additional events.
The main window of tnfview has several control and display areas (in addition to the timeline graph):
-
Event Table - Selecting an event causes the event's data fields to be displayed in the tnfview Event Table below the timeline graph. Shift-click additional events to add events to the Event Table.
-
Navigation Menu - After you have selected an event, you can browse through the other events in the timeline, moving to the next or previous event in the same navigation category.
|
Menu Category |
Definition |
|---|---|
|
current probe |
Probe name. |
|
current tid |
Solaris thread ID. |
|
current lwpid |
Solaris lightweight process ID. |
|
cpu |
Always zero for user-level traces. |
|
current pid |
Solaris process ID. |
|
current vid |
Virtual thread ID - A logical thread ID assigned when trace files from different nodes are merged. |
|
time |
Strict time sequence, by millisecond. |
-
The navigation categories are shown in Table 6-3.
Note -For single-threaded multi-process programs, the virtual thread ID is the same as the MPI rank of each process.
-
Next, Previous Buttons - Displays each subsequent event's data field values in the tnfview Event Table (or adds the current event's data field values to the events already listed in the tnfview Event Table if one or more events are already listed). Simply clicking on an event empties the Event Table of prior entries, so that the Event Table contains only the data fields of the most recently selected event.
-
Scale Sliders - Adjusts the scale of either the X or Y axis (or both) of the timeline, zooming in or out. Note that the timeline Y axis is scaled by virtual ID, which is equivalent to processor rank in MPI programs.
-
Panner Window - Controls the selection of the area displayed in the timeline graph. Dragging the middle mouse button, you can select a subset of the timeline in the panner window, creating a selection frame. You can drag that frame to another location in the timeline using the left mouse button.
-
Graph Button - Opens the Graph window, in which you can create, modify, display, and analyze datasets based on events and event pairs (intervals).
-
Print Button - Opens the Print dialog box, in which you specify the printer; prints the timeline view
Opening TNF Trace Files
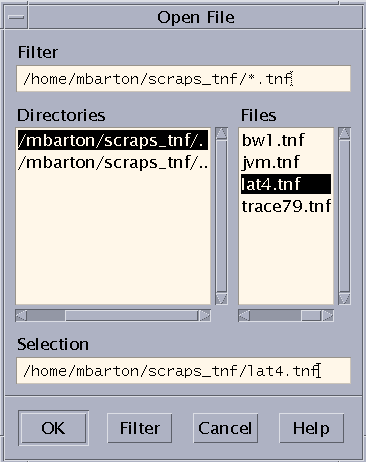
The Open Tracefile selection on the File menu opens the Open File dialog box. Use this dialog box to select a trace file for performance analysis.
Figure 6-2 Open File Dialog Box
Bookmarking Events
You can set a bookmark. in the Timeline window on any selected event. Such bookmarks enable you to return to a specific view in the Timeline window. Bookmarks remain only for the duration of the current session. Once a bookmark has been set, you can select it from the Bookmark menu. Selecting a bookmark will return you to the event, restoring the contents of the Event Table and the zoom and scroll factors that were in effect when the bookmark was set.
Navigating and Controlling the tnfview Timeline Window
The tnfview Timeline Window uses a set of mouse commands for each region of its window. The tnfview mouse commands for each region are shown in Table 6-4 through Table 6-7.
Table 6-4 Timeline Graph Mouse Commands|
Command |
Description |
|---|---|
|
Left Click |
Select an event and clear previous selections |
|
Shift-Left Click |
Select an additional event and add it to the set of selected events |
|
Middle Drag |
Select area for zoom |
|
Middle Click |
Center view around point |
|
Scroll Bars |
Scroll view of graph at current zoom factor |
|
Scale Bars |
Adjust zoom factor of each axis independently |
Table 6-5 Panner Graph Mouse Commands
|
Command |
Description |
|---|---|
|
Left Drag |
Drag view rectangle |
|
Middle Drag |
Select area of timeline for viewing |
Table 6-6 Navigation Control Mouse Commands
|
Command |
Description |
|---|---|
|
Left Arrow Button |
Select previous event |
|
Right Arrow Button |
Select next event |
|
Pull-down Menu |
Select navigation criteria |
Table 6-7 Event Table Mouse Commands
|
Command |
Description |
|---|---|
|
Left Click |
Select an event |
|
Up/Down Arrows (Keyboard) |
Select next/previous event in table |
Exiting tnfview
From the File menu, choose Exit to exit tnfview.
Exiting tnfview eliminates data generated during the current tnfview session. The tnfview program does not save generated datasets, bookmarks (described in "Bookmarking Events"), or any settings chosen during the session. Your original trace file remains unchanged.
Using the tnfview Graph Window
Clicking on the Graph button of the Timeline window opens the tnfview Graph window with the Plot tab selected. Once you have created and selected a dataset from the events or intervals in your trace file, tnfview displays a scatter plot of that dataset.
You can display, in addition to scatter plot graphs, tables and histograms of the dataset. You can also modify parameters (axis values) of each graph.
Figure 6-3 Scatter Plot View
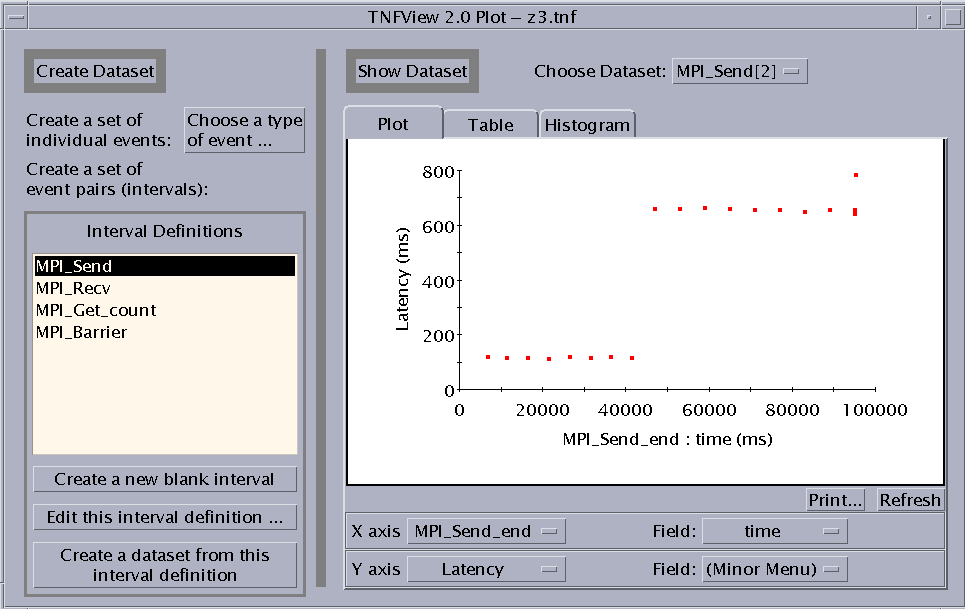
To create a dataset, use the features on the left panel of the Graph window. You can:
-
Create a dataset from a single probe.
-
Create a new (blank) interval.
-
Edit the currently selected interval definition.
-
Create a dataset from the currently selected interval definition.
Creating an Event Dataset
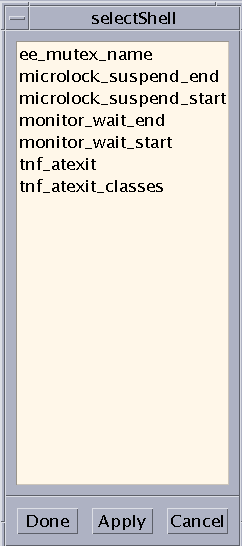
Click the "Choose a type of event" button to open the Event Selection window (see Failed Cross Reference Format). The window displays a list of the event types (probes) defined in the current tracefile. Selecting a set of events, such as the set of all MPI_Send_start events, then clicking on Done causes the Graph window to automatically display a scatter plot of the dataset of all MPI_Send_start events. The Graph window also supplies a histogram (opened using the Histogram tab) of the event set. The table shows only interval latencies. Nothing is displayed for single events in the table.
Figure 6-4 Event Selection Window
Creating a New Interval
You create new intervals by clicking the "Create a new blank interval" button in the Graph window. You can then proceed to edit the new interval's definition. By pairing events in intervals, you can create the tools to measure the parts of your MPI code that you are most interested in analyzing.
Editing Interval Definitions
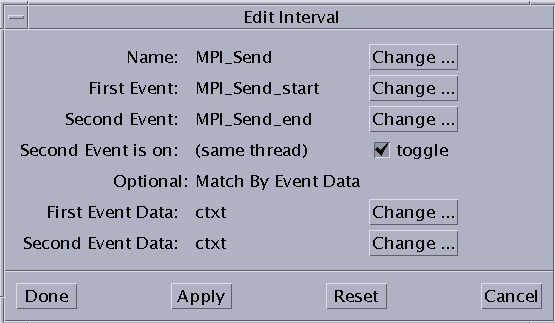
If you select an interval and click the "Edit this interval definition" button, the Interval Editor window opens (see Failed Cross Reference Format). You can change the displayed events and data by selecting items from the lists shown by clicking the adjoining Change buttons.
-
Name - The interval name.
-
First Event - The event that triggers data collection for this interval (when the interval has been enabled).
-
Second Event - The event that stops data collection for this interval (when the interval has been enabled).
-
Second Event is on: (same thread) - Toggle whether events can be on different threads.
-
Optional: Match by Event Data
-
First Event Data - The element of the first event to be matched.
-
Second Event Data - The element of the second event to be matched.
Note -The tnfview interval editor does not permit you to specify the MPI rank (VID) of events in the composition of intervals.
-
Figure 6-5 Interval Editor
Collecting an Interval Dataset
If you select an interval from the Interval Definitions list, then click the "Create a dataset from this interval definition" button, a new entry will appear on the "Choose Dataset" menu. You can then display and manipulate the dataset.
Selecting a Dataset to Plot
If you select an event or interval from the list under "Choose Dataset," the graph displays a scatter plot, table (for intervals only), or histogram, depending on which tab of the Show Dataset pane is currently selected. The "Choose Dataset" menu distinguishes single-event datasets from double-event (interval) datasets by displaying [1] after the names of single event datasets, and [2] after the names of interval datasets. For example, if MPI_Finalize_start is a single event dataset, and MPI_Send is an interval dataset, the "Choose Dataset" menu displays them:
MPI_Finalize_start[1]
MPI_Send[2]
Adjusting the Scatter Plot Graph Axes
You can select alternative values for the X and Y axes on the graph. For example, Latency, the default value for the Y axis in the scatter plot graph, is the difference in time between the first event in an interval and the second event. You can replace Latency with other values, such as Time Order, or specific fields in either event of the selected interval. Define the axis values by choosing from the lists in either the X axis or Y axis rows below the scatter plot graph. The values in those lists are:
-
Latency
-
Time Order
-
Event 1 - Specify the event field
-
Event 2 - Specify the event field
The data fields of the event become available for selection in the second list of the same row. This allows you to use a data value of a selected event as an axis of the graph.
Updating the Graph
To update a scatter plot graph or histogram after changing an axis parameter, press the Refresh button.
Selecting a Point in the Scatter Plot
Each point in the scatter plot corresponds to a data point in the displayed dataset.
Clicking on any data point in the scatter plot causes the timeline graph to select the corresponding event or interval, displaying the detailed data of that event or interval in the Timeline window's event table.
For datasets with one event, one event will be shown in the Timeline window. If the dataset comes from an interval definition, then each dot in the scatter plot represents two events, and two events will be shown in the Timeline window.
For example, clicking on the furthest outlying data point in the scatter plot graph shown in Failed Cross Reference Format navigates the Timeline window to the corresponding event or interval, as shown in Failed Cross Reference Format.
Figure 6-6 Navigating the Timeline View to the Data Point Selected in the Scatter Plot View
Then, zooming in to the data points closest to the selected data point displays a finer grain view of the dataset. (To center the timeline display on the selected data point, click it with the middle mouse button.) Failed Cross Reference Format shows an example.
Figure 6-7 Zooming In for a Finer Grain View of the Dataset
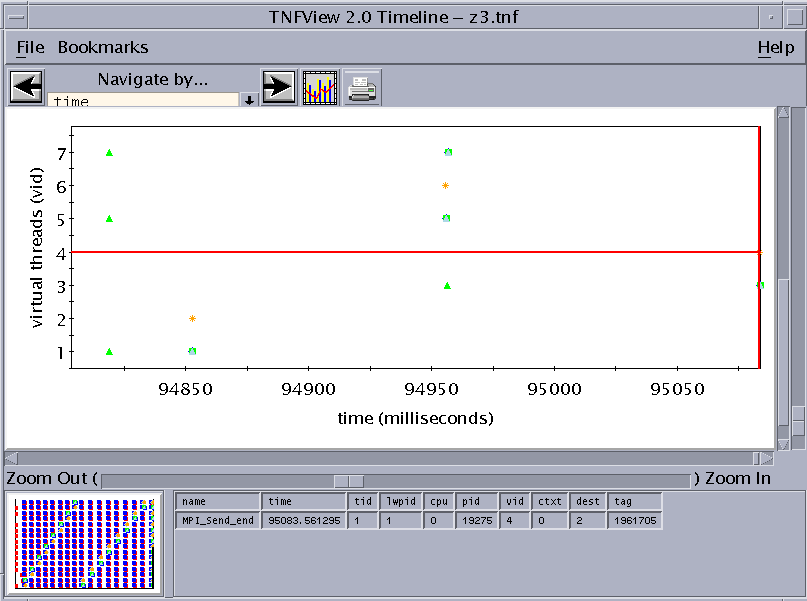
Note the selected area in the panner graph, indicating the area of the previous graph covered by the zoom.
Opening the Table View
Clicking the Table tab on the Graph view window opens a tabular presentation of the selected dataset. See Failed Cross Reference Format for an example:
Figure 6-8 Table View
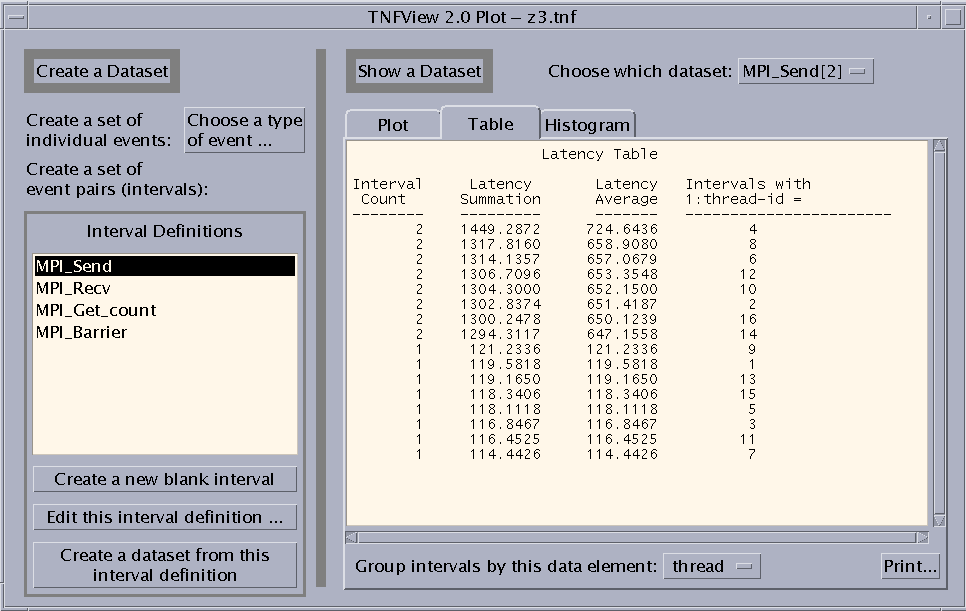
The Table view displays four columns:
-
Interval Count - Number of intervals
-
Latency Summation - Time in milliseconds
-
Latency Average - Time in milliseconds
-
Intervals with data_element - You can choose the value for this column using the list that is revealed when you click the button next to the "Group intervals by this data element" label.
Opening the Histogram View
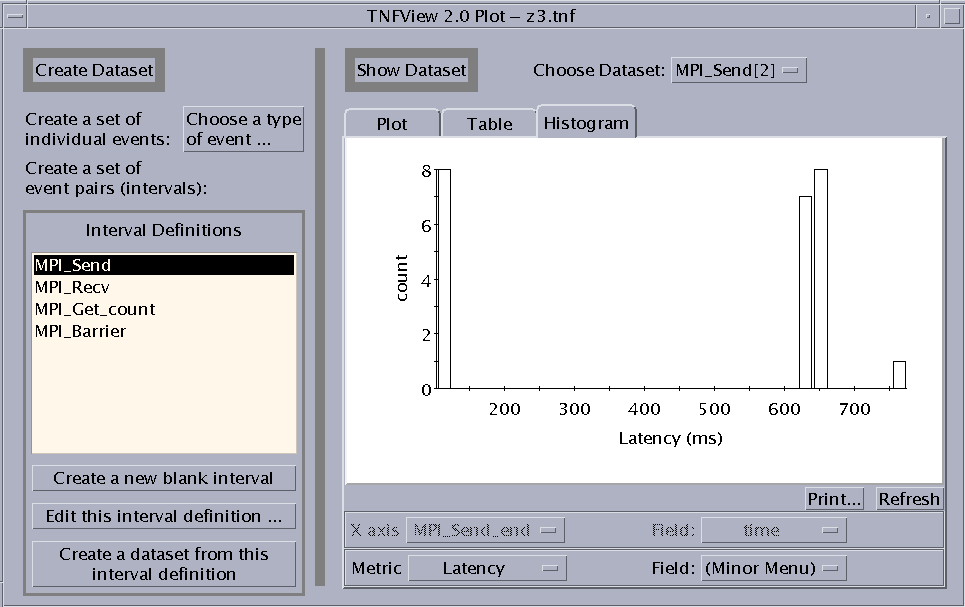
Clicking the Histogram tab on the Graph view window opens a histogram presentation of the selected dataset. For example:
Figure 6-9 Histogram View
Clicking on a Bucket in the Histogram
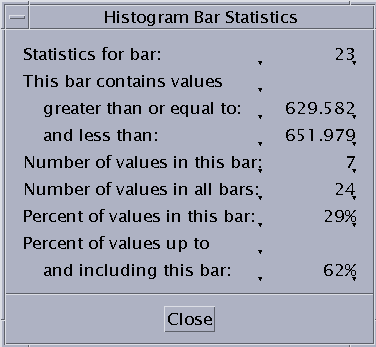
Click the left mouse button on a bar in the histogram graph to display three sets of values for the data points represented by that bar. These values are:
-
Statistics for bar - Displays the number of the bar, counting from zero to 29.
-
This bar contains values ... - Displays the range of the data in the bar.
-
Any value in this bucket must be greater than or equal to the first value.
-
Any value in this bucket must be less than the second value.
-
-
Number of values in this bar - Displays the number of values within the bar.
-
Number of values in all bars - Displays the number of values within the entire dataset.
-
Percent of values in this bar - Displays the values within the bar as a percentage of the entire dataset.
-
Percent of values up to and including this bar - Displays a cumulative percentage. The value is the total of the selected bucket and all buckets to the left of it as a percentage of the complete data set.
These values are displayed in a Histogram Bar Statistics dialog box, as shown in Failed Cross Reference Format.
Figure 6-10 Histogram Bar Statistics Dialog Box
Specifying the Metric of the Histogram
You can select alternative values for the histogram metric. For example, you could choose Latency (the default), Time Order, or specific fields in either event of the selected interval. Define the axis values by choosing from the list located below the histogram graph. The values in those lists are:
-
Latency
-
Time Order
-
Event 1 - Specify the event field
-
Event 2 - Specify the event field
The data fields of the event become available for selection in the second list of the same row. This allows you to use a data value of a selected event as a metric of the histogram graph.
Performance Analysis Tips
The following sections offer cautions and suggestions about using TNF probes to analyze the performance of your Sun MPI programs.
Reusing Performance Data Files
You can reuse TNF trace files. A few considerations:
-
TNF output files can be saved and viewed, but not updated.
-
You can redisplay TNF trace files. You should take the normal precautions to name your trace files in order to avoid confusing versions of trace data gathered in different sessions.
-
To display data from multiple TNF files, open multiple instances of tnfview.
Enabling Probes Selectively
Enable probes based on the characteristics of your source code. For example, if you are interested in the performance of a specific function in your code, and the routines that precede and follow that function are collective routines, enable the collective probes.
When examining a trace file from an MPI program in tnfview, look for events in the Timeline view where synchronization is poor, or where processes are idle. Look for places where sends, receives, or waits spend too much time idle. Create intervals of the start and end probes of blocking sends, receives, and waits, then generate a histogram and look for the taller columns.
In many, if not all programs, enabling only probes on point-to-point routines and collectives will provide enough information to initiate performance analysis.
Controlling Buffer Size
When collecting TNF data, Prism creates a trace file for every process. Using the optional size argument, You can specify the maximum size (in kilobytes) of the output trace files used by each process. The default size is 128Kbytes. The output trace files are limited in size--once a file has been filled, more recent trace events overwrite the oldest ones. The following tnffile command example requests a trace file of 8192 Kbytes (8 Mbytes):
(prism all) tnffile myfile.tnf 8192
Since the TNF trace data buffer is limited in size, beware of allowing the trace data from the probes you are interested in to be overwritten by trace data from subsequent probes. For example, data from interesting events may be lost if those events occurred just prior to an area of your code that generates a lot of probe data. To reduce the chance that your probe data buffers are overwhelmed by especially busy sections of your code, use the tnfcollection command as an event action specifier (as described in "Collecting Performance Data") to focus attention on the most interesting routines.
You can also set the optional tnffile size argument to as large a value as your /usr/tmp allows. By enlarging the size of the trace data buffers with this command, you can reduce some of the probability that interesting data will get overwritten.
Anticipating Timing Problems
You may change the timing characteristics of your program by adding probes (even when those probes are disabled). This can be especially significant when your code includes loops that contain MPI calls.
Changing which probes you have enabled or disabled also changes the timing of your program. Perturbations can be especially significant when probing MPI routines that have very fine-grained communications.
The operating overhead incurred when collecting, processing, and viewing performance analysis trace data has effects on both storage and time.
The volume of trace data can exceed the storage capacity of the target directory. It may be important to monitor the capacity of /usr/tmp (or an alternative directory, if you have specified one) to avoid encountering capacity limits.
The activity of generating probe records slows performance by a predictable amount. Assuming that you run TNF-instrumented code, compiled by version 4.2 compilers, on a 167 mHz SPARC, the operating overhead introduced by TNF probes is shown below:,
Table 6-8 Operating Overhead Introduced by TNF Probes| Probe Status | SPARC Instructions | Time (in nanoseconds) |
|---|---|---|
| Disabled | 5 | 12 |
| Enabled | 24 | 27 |
Miscellaneous Suggestions
Highly cyclical code is a good example of code that can benefit from TNF performance analysis, such as in a program that alternates between broadcasts and gathers. For example, look for evidence of bad load balancing, such as barrier:compute cycles where the compute phase in one rank is far shorter than others, spending more time in barrier than the other ranks.
You can create intervals based on library routines that enable you to measure the timing of your own code, not just the timing of the library routines themselves. Create intervals that combine an *_End event that precedes the routines you want to measure with a corresponding *_Start event following those routines (the reverse of normal order).
You can use Prism's TNF performance analysis features with or without using the -g compiler option. For further information about the effects of using the -g option, see " Compiling and Linking Your Program". For information on combining the -g option with optimizations, see "Combining Debug and Optimization Options".
Note -
Ragged edges can appear in your data. Since message passing activity in different processes can vary, the earliest time when a trace file contains interesting data can vary from process to process
Controlling the Scale of TNF Data Collection
During the collection phase of Prism's TNF performance analysis, Prism creates as many trace collection data files as there are processes in your Sun MPI program. When your program has completed, Prism merges these files in a final data file. You can view this merged file in Prism's TNF data browser, tnfview.
However, the scale of data collection can overwhelm disk storage resources. The following sections are intended to help you to understand how this can happen, and how to control the scale of data collection.
Collecting Trace Data
Prism creates one trace collection data file per process in your Sun MPI program. Sun HPC 3.0 ClusterTools supports Sun MPI programs with as many as 1024 processes on LSF, or as many as 256 processes on the Cluster Runtime Environment (CRE).
You can specify the size of the trace data collection files with the size argument of the tnffile command. The trace data collection files are allocated a fixed size, not a variable size limit. For example, to increase the size from the default value of 128 Kbytes to two megabytes,
(prism all) tnffile myfile.tnf 2048
Trace data collection files operate as circular buffers. As the file fills up with trace data records, older records are overwritten. Once the data collection process has been completed and the data has been merged in the final trace file, Prism will issue a warning message reporting that older records in the trace buffer have been overwritten, if that is the case. For example:
Maximum file size reached - some
events have been lost.
It is difficult to predict the precise number of records that will fit in a given buffer size. Some probes report extra data--probe records vary in length. However, the average event generates a record roughly 16 bytes in length.
Tips for Controlling the Scale of Data Collection
-
Change (lessen) the number of probes that you enable.
-
Change (shorten) the duration of the time during which collection is active.
Merging Trace Data Files
The file size of the final, merged trace data file is approximately equal to the number of processes times the buffer size. However, the final trace data file will be smaller if the individual trace data buffers are not full.
The loading of the final, merged, trace data file into tnfview can take a length of time proportionate to the size of the data file.
Managing Disk Space Requirements
Prism uses /usr/tmp for storing trace data files by default because that directory resides locally on each machine. For that reason, the processes that generate trace records are not slowed by writing their TNF probe records across a network connection.
You can use another directory for trace data collection files. To direct Prism to create trace data files in your chosen directory, set the PRISM_TNFDIR or TMPDIR environment variables to the directory you choose. For example,
% setenv PRISM_TNFDIR directory
Additional Information
For further information about TNF tracing with Prism, see the Prism 6.0 Reference Manual and tnfview online help. For information about Sun MPI, see the Sun MPI 4.0 Programming and Reference Guide.
For background information about TNF tracing, see the Solaris 2.6 Programming Utilities Guide, and the man pages prex(1), tnfdump(1), tnfxtract(1), TNF_DECLARE_RECORD(3X), TNF_PROBE(3X), libtnfctl(3X), tnf_process_disable(3X), tracing(3X), tnf_kernel_probes(4), and attributes(5).
For a general discussion of profiling methodology, emphasizing the use of timers, as well as discusions of profiling utilities not discussed in the current chapter (such as prex, and tnfdump), see Appendix C, General Profiling Methodology, Timers, And Other Profiling Utilities .
- © 2010, Oracle Corporation and/or its affiliates
