Chapter 7 Applying Prism's MPI Performance Analysis
First Case Study - Point-to-Point Message Passing
The benchmark code considered in this case study is a popular HPC benchmark in computational fluid dynamics (CFD).
Data Collection.
In our CFD example, we first run the benchmark using these environment variable settings
% setenv MPI_SPIN 1
% setenv MPI_PROCBIND 1
These settings are appropriate for achieving good performance for a dedicated Sun MPI job. See the Sun MPI 4.0 Programming and Reference Guide for more information about using Sun MPI environment variables for high performance. These environment variables are specific to Sun MPI programs. They have no direct effect on Prism.
Note -
No special compilation or linking is required to use Prism's MPI performance analysis.
The benchmark was run under Prism on a single, shared-memory node using 25 processes with the command:
% prism -n 25 a.out
The -n argument to Prism must be specified even if only one process is used. The run took 146 seconds to complete.
To Collect Performance Data:
-
Click on Collection (from the Performance menu).
-
Click on Run (from the Execute menu).
-
Click on Display TNF Data (from the Performance menu).
The tnfview timeline window will appear. The horizontal axis shows time, in milliseconds. The vertical axis shows MPI process rank. For single-threaded multi-process programs, the virtual thread ID is the same as the MPI rank of each process.
Figure 7-1 The Timeline View of TNF Probes.
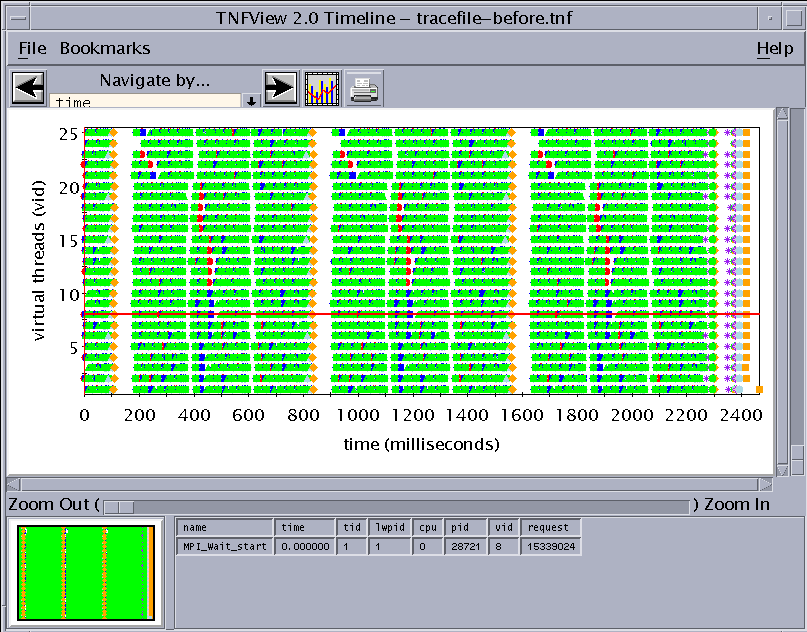
TNF trace data files are wraparound trace buffers of prescribed size. For that reason, if a lot of data is recorded, new events will overwrite older ones. For example, Figure 7-1 shows 3 iterations over roughly 2 seconds. Meanwhile, the benchmark has 200 iterations and took roughly 146 seconds, indicating that only 1/70 of the events are being represented. This is sufficient for our purposes since the last iterations are representative of the whole run. For further information about buffer wraparound, see "Coping With Buffer Wraparound".
Message-Passing Activity At a Glance.
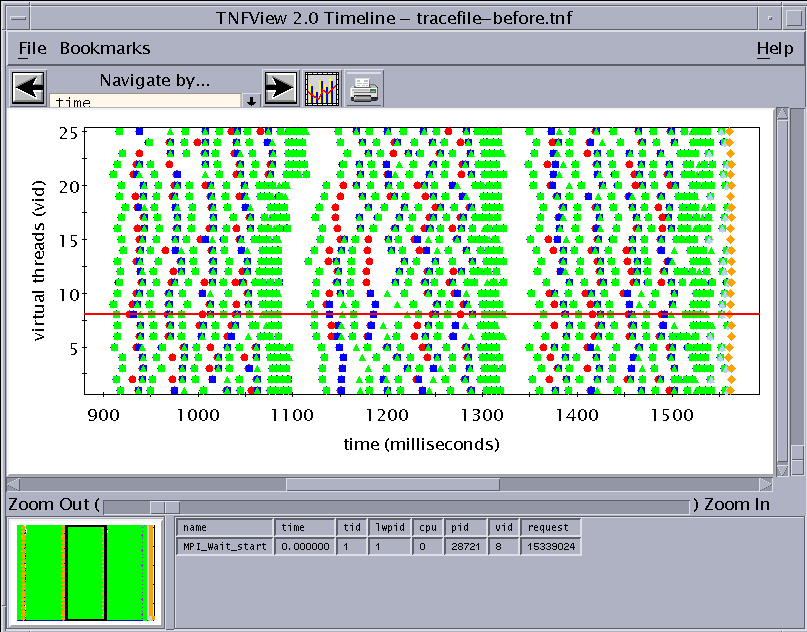
In Figure 7-1, we see three iterations, each taking roughly 700 ms. By holding down the middle mouse button while dragging over one such iteration, you can produce the expanded view shown in Figure 7-2. More detail becomes evident. There are three important phases in each iteration, which correspond to the different axes in this three-dimensional computation. Some degree of synchronization among MPI processes is evident. Though the effect is subtle for this run, it appears that consecutive blocks of 5 processes each are synchronized at the end of phase 1 (at about 1100 ms), while every fifth process is synchronized at the end of phase 2 (at about 1300 ms). This is indicative of the benchmark running on an underlying 5x5 process grid.
Figure 7-2 Expanded View of One Iteration.
Summary Statistics of MPI Usage.
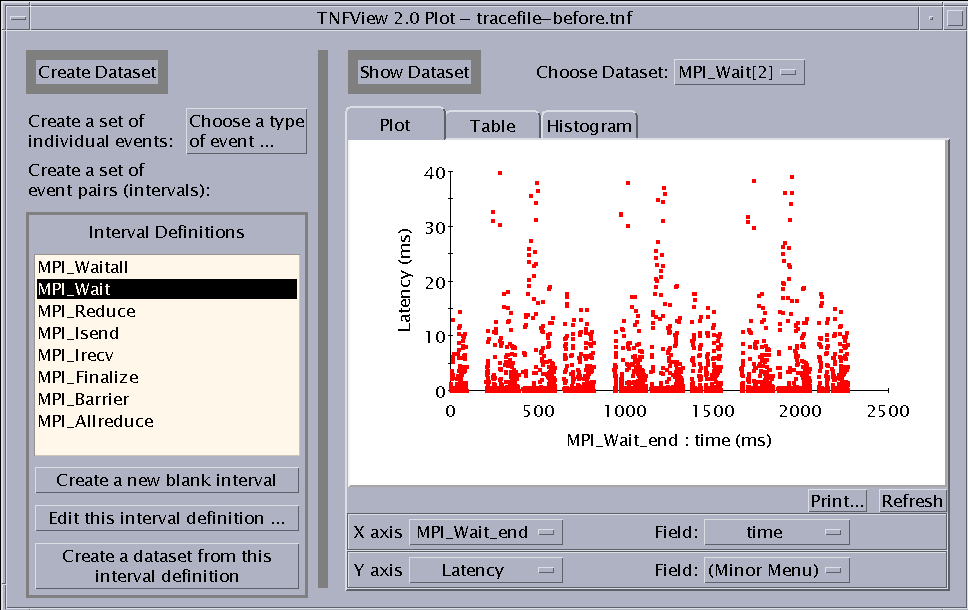
We now change views by clicking on the graph button at the top of tnfview's main window. A new window pops up and in the Interval Definitions panel you can see which MPI APIs were called by the benchmark, provided their probes were enabled. To study usage of a particular MPI routine, click on the routine's name in the list under "Interval Definitions" and then click on "Create a dataset from this interval definition" . The window will resemble Figure 7-3. While each point in Figure 7-1 or Figure 7-2 represented an event, such as the entry to or exit from an MPI routine, each point in Figure 7-3 is an interval -- the period of time between two events that is spent inside the MPI routine. The scatter plot graph shows three 700-ms iterations with three distinct phases per iteration. The vertical axis shows that MPI_Wait calls are taking as long as 40 ms, but generally much less.
Figure 7-3 Graph Window Showing a Scatter Plot of Interval Data.
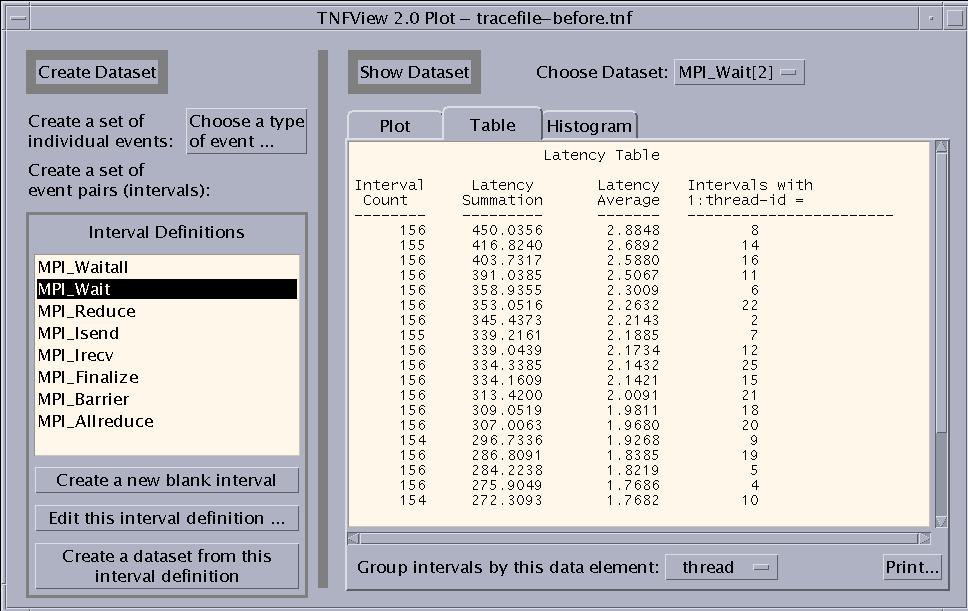
Next, click on the Table tab to produce a summary similar to that depicted in Figure 7-4. Again, times are reported in milliseconds. The first column (Interval Count) indicates how many occurrences of the interval are reported, the second column (Latency Summation) reports the total time spent in the interval, the third column gives the average time per interval, and the fourth column lists the data element used to group the intervals. In the case of Figure 7-4, some threads (MPI processes) spent as long as 450 ms in MPI_Wait calls. Since only about 2.3 seconds of profiling data is represented, this represents roughly 20% of the run time. By repeatedly clicking on other intervals (MPI calls) in the list under "Interval Definitions" and then on "Create a dataset from the selected interval definition", you can examine times spent in other MPI calls and verify that MPI_Wait is, in fact, the predominant MPI call for this benchmark.
Figure 7-4 Graph Window Showing a Summary Table of Interval Data.
The graph window summary can be used to judge, overall, which MPI calls are costing the most time.
The tables may be organized in different ways. For example, we may pull down Group intervals by this data element: and select 2:bytes. That is, we want to group MPI_Wait calls by the number of bytes received, as reported by event 2 (MPI_Wait_end).
We learn that much of the MPI_Wait time is spent waiting for receives of roughly 40 Kbytes, but more time is spent waiting for sends to complete. (In the current release, this fourth column is often reported in hexadecimal format.)
Finding Hotspots.
Clicking on the Plot tab, we return to the view seen in Figure 7-3. Again, most of the MPI_Wait calls are seen to take relatively little time, but some calls stretch out as long as 40 ms, or so. The pattern of these timings is basically the same from one iteration to the next. Clicking on any one of the high-latency points in the scatter plot shifts the timeline view onto the interval in question, as in Figure 7-5. We may investigate events that surround the hotspot by pulling down the Navigate by... field and choosing current tid to restrict navigation to a particular thread id (MPI process). We can navigate backward or forward and add events to the Event Table. It happens that the most time-consuming pattern is:
MPI_Isend
MPI_Irecv
(no MPI activity)
MPI_Wait (on the MPI_Isend)
MPI_Wait (on the MPI_Irecv)
Notably, the program spends the most time in the MPI_Wait calls, generally in the first of the pair.
Figure 7-5 Timeline View Centered About a High-Latency MPI_Wait Call.

Figure 7-5 shows the start and end events defining the interval, as well as other neighboring events in the Event Table at the bottom of the tnfview window.
Fixing the Problem.
When tuning Sun MPI environment variables, one factor involves increasing buffers for improved performance. Our case study involved single messages of up to roughly 40 Kbytes going over a local connection. Thus, we increase shared-memory buffers by a large margin, following the given prescriptions and adding
% setenv MPI_SHM_CPOOLSIZE 102400
% setenv MPI_SHM_CYCLESTART 102400
% setenv MPI_SHM_RENDVSIZE 102400
% setenv MPI_SHM_NUMPOSTBOX 50
to our list of run-time environment variables. For further information about Sun MPI environment variables, see the Sun MPI 4.0 Programming and Reference Guide.
Rerunning the program under Prism, the benchmark time dropped from 146 seconds to 137 seconds. This 6% overall improvement has been effected by slicing off a portion of the roughly 20% of run time that was spent in MPI_Wait calls. In particular, the time spent on MPI_Wait calls that terminate MPI_Isend calls has practically vanished.
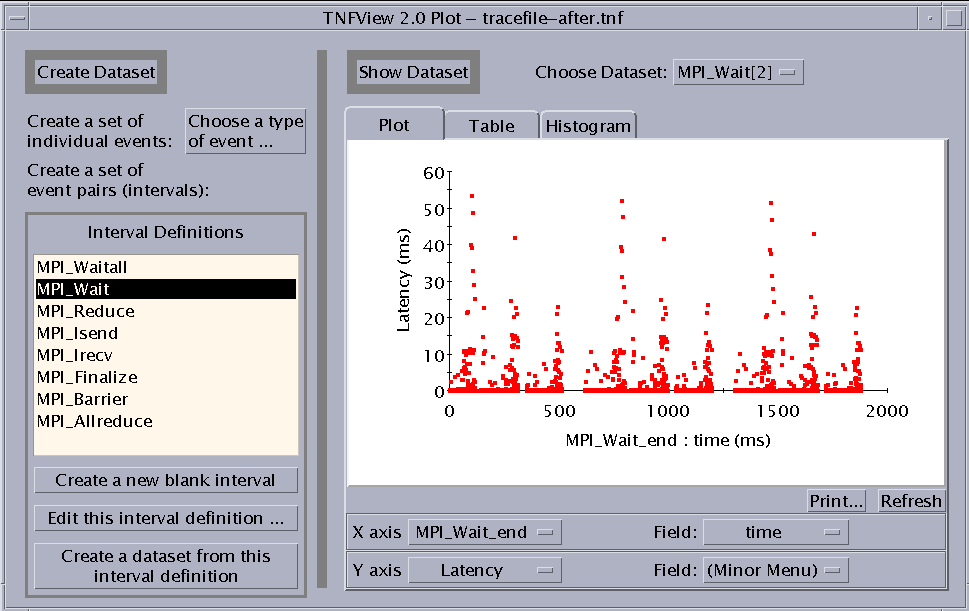
One notable signature of our changes is found by examining the scatter plot of MPI_Wait times. The new data, shown in Figure 7-6 and akin to Figure 7-3, indicate that MPI_Wait times are considerably reduced. There are still occasional long waits, but they are reproducible from iteration to iteration and result from waits on receives for data that the senders simply have not yet sent. These indicate critical paths that are inherent to the application and have little to do with how fast MPI is moving data.
Figure 7-6 Scatter Plot of MPI_Wait Times. Times are much lower than in Figure 7-3 due to MPI tuning.
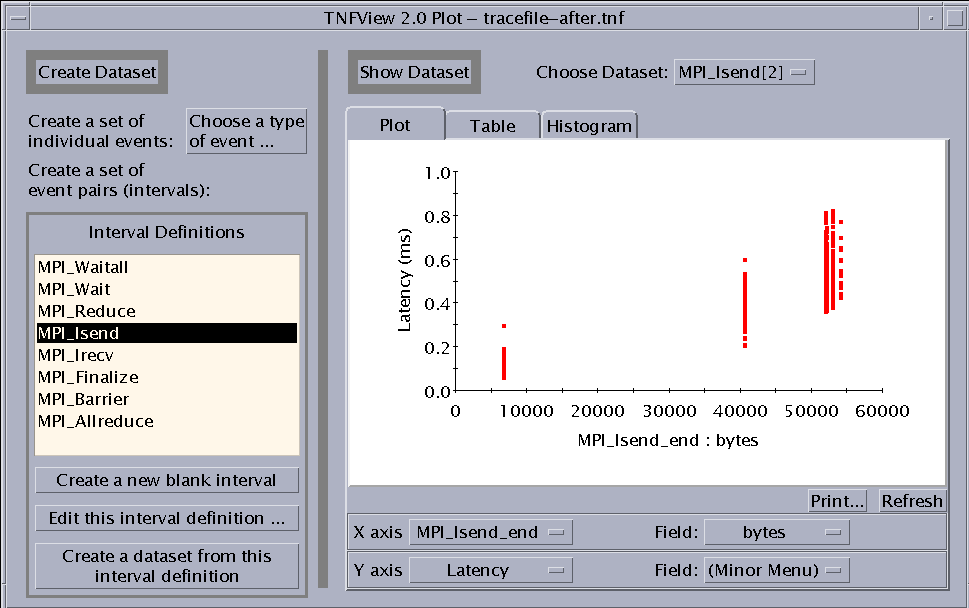
Another notable figure is the scatter plot for MPI_Isend times, shown in Figure 7-7. In this case, for the X axis, we have chosen the Field: to be bytes and then used the Refresh button to refresh the plot. The figure indicates that MPI_Isend performance grows roughly linearly with the message size at a rate of about 100 Mbyte/second, a reasonable rate for on-node data transfer.
Figure 7-7 Scatter Plot of MPI_Isend Times, Plotted Against Message Size.
Second Case Study - Collective Operations
Our first case study centered about point-to-point communications. Now, let us turn our attention to one based on collective operations. We examine another popular benchmark, which sorts sets of keys. The benchmark was run under Prism on a single, shared-memory node using 16 processes. Once again, we begin by setting Sun MPI environment variables
% setenv MPI_SPIN 1
% setenv MPI_PROCBIND 1
since we are interested in the performance of this benchmark as a dedicated job.
Synchronizing Skewed Processes: Timeline View
The message-passing part of the code involves a bucket sort, implemented with an MPI_Allreduce, an MPI_Alltoall, and an MPI_Alltoallv, though no such knowledge is required for effective profiling with Prism. Instead, running the code under Prism, we quickly see that the most time-consuming MPI calls are MPI_Alltoallv and MPI_Allreduce. (See "Summary Statistics of MPI Usage. ".) Navigating a small section of the timeline window (see Figure 7-5), we see that there is actually a tight succession of MPI_Allreduce, MPI_Alltoall, and MPI_Alltoallv calls. One such iteration is shown in Figure 7-8 (We have shaded and labeled time-consuming sections.)
Figure 7-8 One Iteration of the Sort Benchmark.
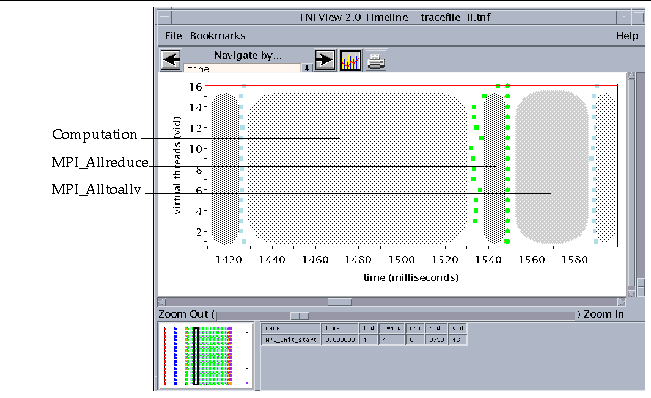
The reason MPI_Allreduce costs much time may already be apparent from this timeline view. The start edge of the MPI_Allreduce region is ragged, while the end edge is flat.
Synchronizing Skewed Processes: Scatter Plot View
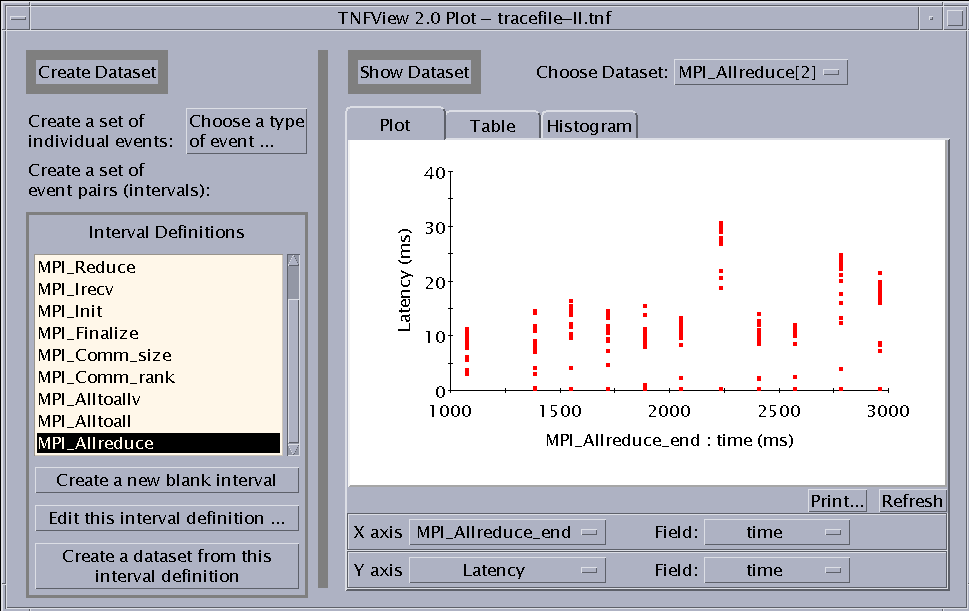
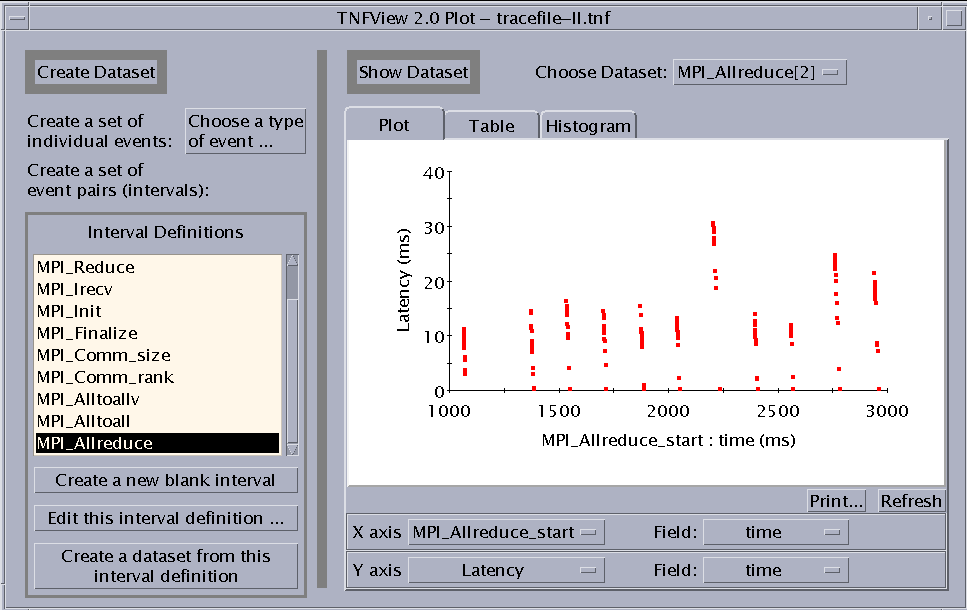
We can see even more data in one glance by going to a scatter plot. In Figure 7-9, time spent in MPI_Allreduce (its latency) is plotted against the finishing time for each call to this MPI routine. There is one warm-up iteration, followed by a brief gap, and then ten more iterations, evenly spaced. In each iteration, an MPI process might spend as long as 10 to 30 ms in the MPI_Allreduce call, but other processes might spend vanishingly little time in the reduce. The issue is not that the operation is all that time consuming, but simply that it is a synchronizing operation, and so early arrivers have to spend a some time waiting for latecomers.
Figure 7-9 Scatter Plot of MPI_Allreduce Latencies (x axis: MPI_Allreduce_end).
We see another view of the same behavior by selecting the time for the MPI_Allreduce_start event, rather than for the MPI_Allreduce_end event, for the X axis. Clicking on Refresh produces the view seen in Figure 7-10. This curious view is much like Figure 7-9, but now the lines of points are slanted up to the left instead of standing straight up. The slopes indicate that high latency is exactly correlated to early entry into the synchronizing call. For example, a 30-ms latency corresponds to an early entrance into the MPI_Allreduce call by 30 ms. This is simply another indication of what we saw in Figure 7-9. That is, processes enter the call at different times, but they all exit almost immediately once the last process has arrived. At that point, all processes are fairly well synchronized.
Figure 7-10 Scatter Plot of MPI_Allreduce Latencies (x axis: MPI_Allreduce_start) Showing Process Skew.
The next MPI call is to MPI_Alltoall, but from our Prism profile we discover that it occurs among well-synchronized processes (thanks to the preceding MPI_Allreduce operation) and uses very small messages (64 bytes). It consumes very little time.
Interpreting Performance Using Histograms
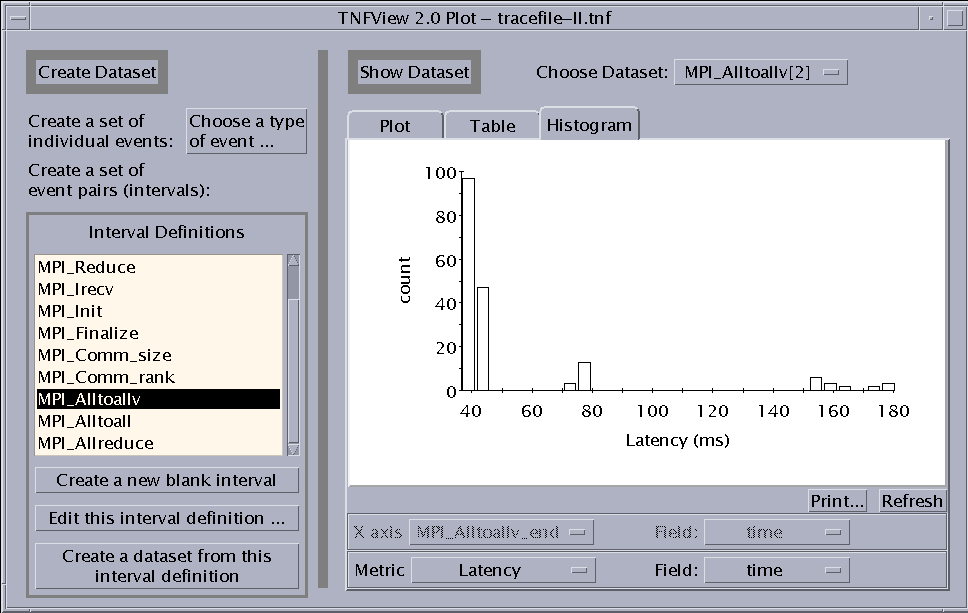
The chief MPI call is this case study is the MPI_Alltoallv operation. The processes are still well synchronized, as we saw in Figure 7-8, but we learn from the Table display that there are on average 2 Mbyte of data being sent or received per process. Clicking on the Histogram tab, we get the view seen in Figure 7-11. There are a few, high-latency outliers, which a scatter plot would indicate take place during the first warm-up iteration. Most of the calls, however, take roughly 40 ms. The effective bandwidth for this operation is therefore
(2 Mbyte / process)
* 16 processes / 40 ms = 800 Mbyte/second
Basically, each datum undergoes two copies (one to shared memory and one from shared memory) and each copy entails two memory operations (a load and a store), so this figure represents a memory bandwidth of 4 * 800 Mbyte/s = 3.2 Gbyte/s. This benchmark was run on an HPC 6000 server, whose backplane is rated at 2.6 Gbyte/s. Our calculation is approximate, but it nevertheless indicates that we are seeing saturation of the SMP backplane and we cannot expect to do much better with our MPI_Alltoallv operation.
Figure 7-11 Histogram of MPI_Alltoallv Latencies.
Prism/TNF case study summary
Our case studies illustrated many points:
-
Prism profiling can be very simple, requiring no special compilation or linking and only two extra mouse clicks, one for data collection and one for data display, to bring up the basic timeline window.
-
Prism profiling of MPI jobs provides a quick overview of what MPI calls are made and it allows a developer to discern visually various patterns of messages, including outer-most iterations, different phases within each iteration, periods during which groups of processes advance in lockstep, and so on.
-
The Table format presents summary statistics that allow a developer to understand which MPI routines, message sizes, or other characteristics account for an appreciable fraction of the run time.
-
Often, a great deal of the time spent in MPI routines is spent not in moving data, but in waiting on partner processes. This is especially true for collective operations, and Prism provides users with multiple views of this behavior.
-
Prism provides scatter-plot displays which show times spent in individual MPI routines. By clicking on high-latency points, one can quickly find the needles in the haystack that account for much of the MPI time.
-
Prism allows a developer to navigate through a timeline to understand what message-passing events surround a performance hotspot - that is, what conditions prevail when performance is slow.
Performance Analysis Tips
While Prism profiling support offers programmers many diagnostic tools, a trained eye is still helpful. Your experience will grow with time. In addition to the lessons of the case study, other features to watch for are:
-
Deadlock - If the code truly deadlocks, then Prism's other features may used to examine the state that causes the program to jam. In particular, click on Interrupt (from the Execute menu) and then Where (from the Debug menu) to see where the program is deadlocked. (The program should be compiled with -g so that debugging information will be available to Prism.
Chapter 2, Using Prism has helpful information describing compilation with both -g and optimization flags turned on.) Prism also has a message-queue visualizer that may be used to study all outstanding messages at the time of deadlock.
-
Many outstanding messages - Performance may be degraded if a program overloads MPI buffers, either by having many outstanding messages or a few large ones.
-
Sends and receives out of order - Performance can be degraded if sends are not matched by receives, again stressing buffering capabilities. Receives may be out of order or may have collective operations interspersed.
-
Blocks of processes may be highly synchronized - Visual inspection of timelines can reveal blocks of processes marching in lockstep for long periods at a time. This suggests that they are synchronized by a high volume of message passing among them. If such a job is launched on a multinode cluster, processes within a block should be colocated on a node. Figure 7-2 shows a subtle example of this.
Coping With Buffer Wraparound
Prism's MPI performance analysis can collect a lot of data. TNF probe data collection employs buffer wraparound, so that once a buffer file is filled the newer events will overwrite older ones. Thus, final traces do not necessarily report events starting at the beginning of a program and, indeed, the time at which events start to be reported may vary slightly from one MPI process to another, depending on the amount of probed activity on each process. Nevertheless, trace files will generally show representative profiles of an application since newer, surviving events tend to represent execution during steady state.
If buffer wraparound is an issue, then solutions include:
-
Using larger trace buffers
-
Selective enabling of probes
-
Profiling isolated sections of code
Prism's MPI performance analysis can disturb an application's performance characteristics, so it is sometimes desirable to focus data collection even if larger trace buffers are an option.
Using Larger Trace Buffers.
To increase the size of trace buffers beyond the default value, use the Prism command
(prism all) tnffile filename size
where size is the size in Kbytes of the output file for each process. The default value is 128 Kbytes.
By default, trace buffers are placed in /usr/tmp before they are merged into the user's trace file. If this file partition is too small for very large traces, buffers can be redirected to other directories using the PRISM_TNFDIR environment variable. In order to minimize profile disruption caused by writing very large trace files to disk, one should use local file systems such as /usr/tmp and /tmp whenever possible instead of file systems that are mounted over a network.
Note -
While Prism generally cleans up trace buffers after the final merge, abnormal conditions could leave large files behind. Users who abort profiling sessions with large traces should check /usr/tmp periodically for large, unwanted files.
Selectively Enabling Probes
One might focus data collection on events that are believed to be most relevant to performance in order either to reduce sizes of buffer files or to make profiling less intrusive. TNF probes are organized in probe groups. For the TNF-instrumented version of the Sun MPI library, the probe groups are structured as follows:
Figure 7-12 Sun MPI TNF Probe Groups
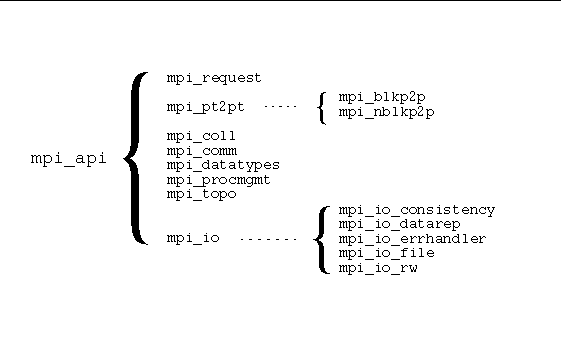
Some TNF probes belong to more than one group in the TNF-instrumented version of the Sun MPI library. For example, there are several probes that belong to both the mpi_request group and the mpi_pt2pt group. For further information about probe groups, see the Sun MPI 4.0 Programming and Reference Guide.
For message-passing performance, typically the most important groups are
-
mpi_pt2pt - point-to-point message passing
-
mpi_request - other probes for asynchronous point-to-point calls
-
mpi_coll - collectives
-
mpi_io_rw - file I/O
If there is heavy use of MPI_Pack and MPI_Unpack, their probes should also be enabled.
Profiling Isolated Sections of Code At Run Time.
Another way of controlling trace sizes is to profile only isolated sections of code. Prism supports this functionality by allowing users to turn collection on and off during program execution whenever execution is stopped - say, with a break point or by using the interrupt command.
If the profiled section will be entered and exited many times, data collection may be turned on and off automatically using tracepoints. Note that the term "trace" is used now in a different context. For TNF use, a trace is a probe. For Prism and other debuggers, a tracepoint is a point where execution stops and possibly an action takes place but, unlike a breakpoint, program execution resumes after the action.
For example, if data collection should be turned on at line 128 but then off again at line 223, one may specify
(prism all) trace at 128 {tnfcollection on}
(prism all) trace at 223 {tnfcollection off}
If the application was compiled and linked with high degrees of optimization, then specification of line numbers may be meaningless. If the application was compiled and linked without -g, then specification of line numbers will simply not work. In such cases, data collection may be turned on and off at entry points to routines using trace in routine syntax.
Profiling Isolated Sections of Code Within Source Code.
TNF data collection can also be turned on and off within user source code using the routines tnf_process_disable, tnf_process_enable, tnf_thread_disable, and tnf_thread_enable. Since these are C functions, one must call them as follows from Fortran:
call tnf_process_disable()   !$pragma c(tnf_process_disable)
call tnf_process_enable()    !$pragma c(tnf_process_enable)
call tnf_thread_disable()    !$pragma c(tnf_thread_disable)
call tnf_thread_enable()     !$pragma c(tnf_thread_enable)
Whether these functions are called from C or Fortran, one must then link with -ltnfprobe. For more information, see the Solaris man pages on these functions.
Inserting TNF Probes Into User Code.
While Sun HPC ClusterTools libraries have TNF probes for performance profiling, user code probably will not. You can add probes manually, but since they are C macros you can add them only to C and C++ code. To use TNF probes from Fortran code, you must make calls to C code, such as in this C file, probes.c:
#include <tnf/probe.h>
void my_probe_start_(char *label_val) {
   TNF_PROBE_1(my_probe_start,"user_probes","",tnf_string,label,
label_val);
}
void my_probe_end_  (double *ops_val) {
   TNF_PROBE_1(my_probe_end  ,"user_probes","",tnf_double,ops,
*ops_val);
}
The start routine accepts a descriptive string, while the end routine takes a double-precision operation count.Then, using Fortran, you might write in main.f:
DOUBLE PRECISION OPERATION_COUNT
OPERATION_COUNT = 2.D0 * N
CALL MY_PROBE_START("DOTPRODUCT")
XSUM = 0.D0
DO I = 1, N
   XSUM = XSUM + X(I) * Y(I)
END DO
CALL MY_PROBE_END(OPERATION_COUNT)
Note -
Fortran will convert routine names to lowercase and append an underscore character.
To compile and link, use
% cc -c probes.c
% f77 main.f probes.o -ltnfprobe
By default, the Prism command tnfcollection on enables all probes. Alternatively, these sample probes could be controlled through their probe group user_probes. Profile analysis can use the interval my_probe.
For more information on TNF probes, consult the man page for TNF_PROBE(3X).
Collecting Data, Batch Style
For more involved data collection experiments, you can collect TNF profiling information in batch mode, for viewing and analysis in a later, interactive session. Such collection may be performed using Prism in commands-only mode, invoked with prism -C. For example, the simplest data collection experiment would be
tnfcollection on
run
wait
quit
The wait command is needed to keep file merge from happening until after the program has completed running. One way of feeding commands to Prism is through the .prisminit file (note the leading "."), which is read by Prism upon startup. See Appendix A, Commands-Only Prism and Chapter 10, Customizing Prism for more information on commands-only mode and .prisminit files, respectively.
Accounting for MPI Time.
Sometimes it is hard to account for MPI activity properly. For example, if one issues an asynchronous send or receive (MPI_Isend or MPI_Irecv), the data movement may occur during that call, during the corresponding MPI_Wait or MPI_Test call, or during any other MPI call in between.
Similarly, general polling (such as with the environment variable MPI_POLLALL) may skew accounting. For example, an incoming message may be read during a send call because polling causes arrivals to be polled aggressively.
In sum, it will not generally be possible to produce pictures like Figure 7-7, from which one can extract an effective bandwidth estimate.
- © 2010, Oracle Corporation and/or its affiliates
