First Case Study - Point-to-Point Message Passing
The benchmark code considered in this case study is a popular HPC benchmark in computational fluid dynamics (CFD).
Data Collection.
In our CFD example, we first run the benchmark using these environment variable settings
% setenv MPI_SPIN 1
% setenv MPI_PROCBIND 1
These settings are appropriate for achieving good performance for a dedicated Sun MPI job. See the Sun MPI 4.0 Programming and Reference Guide for more information about using Sun MPI environment variables for high performance. These environment variables are specific to Sun MPI programs. They have no direct effect on Prism.
Note -
No special compilation or linking is required to use Prism's MPI performance analysis.
The benchmark was run under Prism on a single, shared-memory node using 25 processes with the command:
% prism -n 25 a.out
The -n argument to Prism must be specified even if only one process is used. The run took 146 seconds to complete.
To Collect Performance Data:
-
Click on Collection (from the Performance menu).
-
Click on Run (from the Execute menu).
-
Click on Display TNF Data (from the Performance menu).
The tnfview timeline window will appear. The horizontal axis shows time, in milliseconds. The vertical axis shows MPI process rank. For single-threaded multi-process programs, the virtual thread ID is the same as the MPI rank of each process.
Figure 7-1 The Timeline View of TNF Probes.
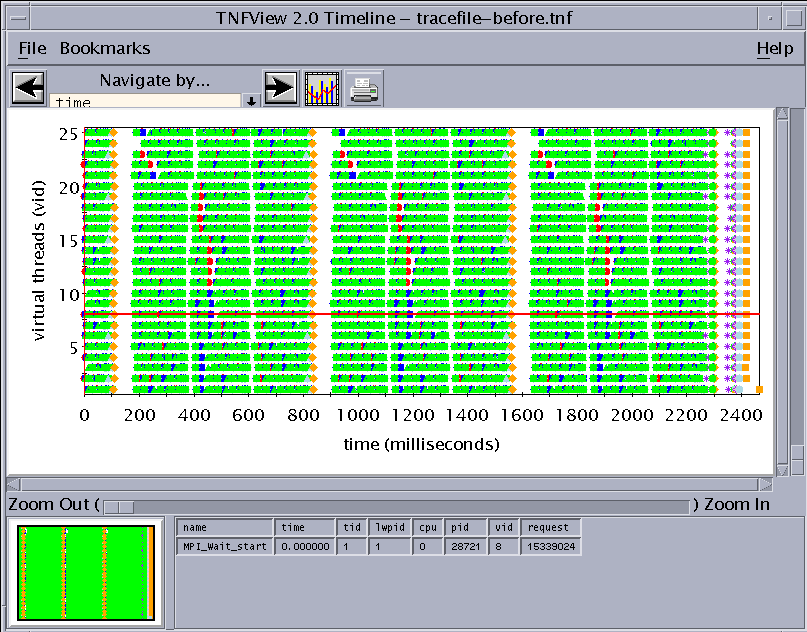
TNF trace data files are wraparound trace buffers of prescribed size. For that reason, if a lot of data is recorded, new events will overwrite older ones. For example, Figure 7-1 shows 3 iterations over roughly 2 seconds. Meanwhile, the benchmark has 200 iterations and took roughly 146 seconds, indicating that only 1/70 of the events are being represented. This is sufficient for our purposes since the last iterations are representative of the whole run. For further information about buffer wraparound, see "Coping With Buffer Wraparound".
Message-Passing Activity At a Glance.
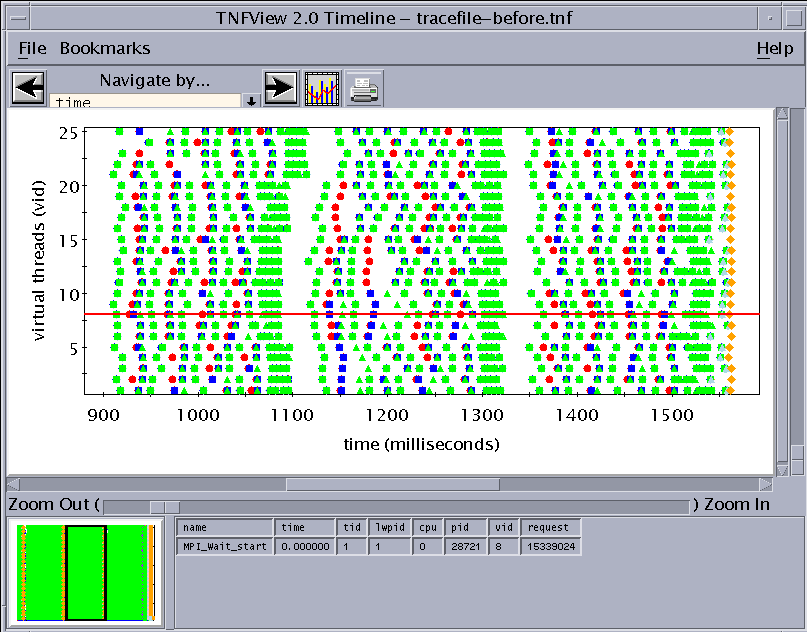
In Figure 7-1, we see three iterations, each taking roughly 700 ms. By holding down the middle mouse button while dragging over one such iteration, you can produce the expanded view shown in Figure 7-2. More detail becomes evident. There are three important phases in each iteration, which correspond to the different axes in this three-dimensional computation. Some degree of synchronization among MPI processes is evident. Though the effect is subtle for this run, it appears that consecutive blocks of 5 processes each are synchronized at the end of phase 1 (at about 1100 ms), while every fifth process is synchronized at the end of phase 2 (at about 1300 ms). This is indicative of the benchmark running on an underlying 5x5 process grid.
Figure 7-2 Expanded View of One Iteration.
Summary Statistics of MPI Usage.
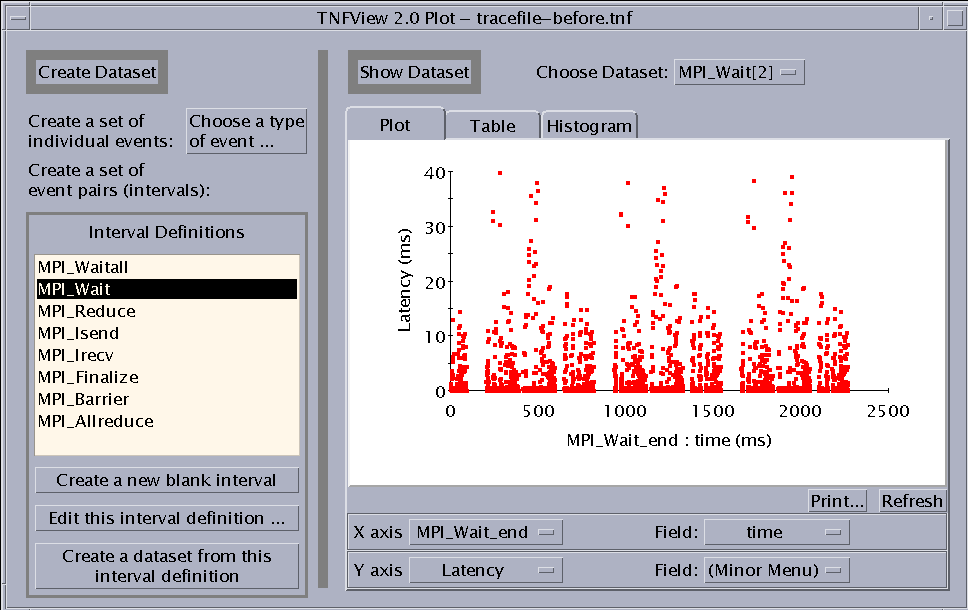
We now change views by clicking on the graph button at the top of tnfview's main window. A new window pops up and in the Interval Definitions panel you can see which MPI APIs were called by the benchmark, provided their probes were enabled. To study usage of a particular MPI routine, click on the routine's name in the list under "Interval Definitions" and then click on "Create a dataset from this interval definition" . The window will resemble Figure 7-3. While each point in Figure 7-1 or Figure 7-2 represented an event, such as the entry to or exit from an MPI routine, each point in Figure 7-3 is an interval -- the period of time between two events that is spent inside the MPI routine. The scatter plot graph shows three 700-ms iterations with three distinct phases per iteration. The vertical axis shows that MPI_Wait calls are taking as long as 40 ms, but generally much less.
Figure 7-3 Graph Window Showing a Scatter Plot of Interval Data.
Next, click on the Table tab to produce a summary similar to that depicted in Figure 7-4. Again, times are reported in milliseconds. The first column (Interval Count) indicates how many occurrences of the interval are reported, the second column (Latency Summation) reports the total time spent in the interval, the third column gives the average time per interval, and the fourth column lists the data element used to group the intervals. In the case of Figure 7-4, some threads (MPI processes) spent as long as 450 ms in MPI_Wait calls. Since only about 2.3 seconds of profiling data is represented, this represents roughly 20% of the run time. By repeatedly clicking on other intervals (MPI calls) in the list under "Interval Definitions" and then on "Create a dataset from the selected interval definition", you can examine times spent in other MPI calls and verify that MPI_Wait is, in fact, the predominant MPI call for this benchmark.
Figure 7-4 Graph Window Showing a Summary Table of Interval Data.
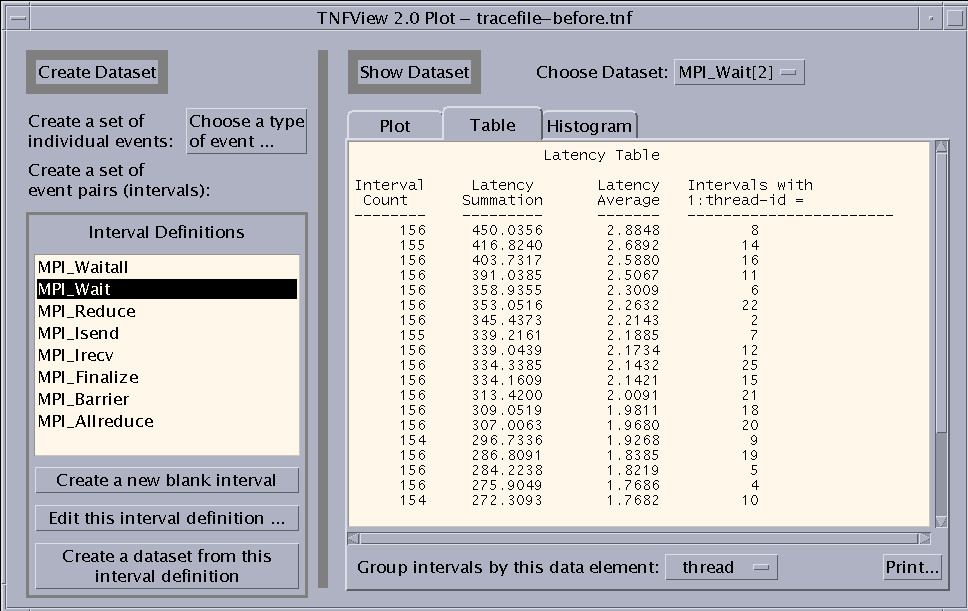
The graph window summary can be used to judge, overall, which MPI calls are costing the most time.
The tables may be organized in different ways. For example, we may pull down Group intervals by this data element: and select 2:bytes. That is, we want to group MPI_Wait calls by the number of bytes received, as reported by event 2 (MPI_Wait_end).
We learn that much of the MPI_Wait time is spent waiting for receives of roughly 40 Kbytes, but more time is spent waiting for sends to complete. (In the current release, this fourth column is often reported in hexadecimal format.)
Finding Hotspots.
Clicking on the Plot tab, we return to the view seen in Figure 7-3. Again, most of the MPI_Wait calls are seen to take relatively little time, but some calls stretch out as long as 40 ms, or so. The pattern of these timings is basically the same from one iteration to the next. Clicking on any one of the high-latency points in the scatter plot shifts the timeline view onto the interval in question, as in Figure 7-5. We may investigate events that surround the hotspot by pulling down the Navigate by... field and choosing current tid to restrict navigation to a particular thread id (MPI process). We can navigate backward or forward and add events to the Event Table. It happens that the most time-consuming pattern is:
MPI_Isend
MPI_Irecv
(no MPI activity)
MPI_Wait (on the MPI_Isend)
MPI_Wait (on the MPI_Irecv)
Notably, the program spends the most time in the MPI_Wait calls, generally in the first of the pair.
Figure 7-5 Timeline View Centered About a High-Latency MPI_Wait Call.

Figure 7-5 shows the start and end events defining the interval, as well as other neighboring events in the Event Table at the bottom of the tnfview window.
Fixing the Problem.
When tuning Sun MPI environment variables, one factor involves increasing buffers for improved performance. Our case study involved single messages of up to roughly 40 Kbytes going over a local connection. Thus, we increase shared-memory buffers by a large margin, following the given prescriptions and adding
% setenv MPI_SHM_CPOOLSIZE 102400
% setenv MPI_SHM_CYCLESTART 102400
% setenv MPI_SHM_RENDVSIZE 102400
% setenv MPI_SHM_NUMPOSTBOX 50
to our list of run-time environment variables. For further information about Sun MPI environment variables, see the Sun MPI 4.0 Programming and Reference Guide.
Rerunning the program under Prism, the benchmark time dropped from 146 seconds to 137 seconds. This 6% overall improvement has been effected by slicing off a portion of the roughly 20% of run time that was spent in MPI_Wait calls. In particular, the time spent on MPI_Wait calls that terminate MPI_Isend calls has practically vanished.
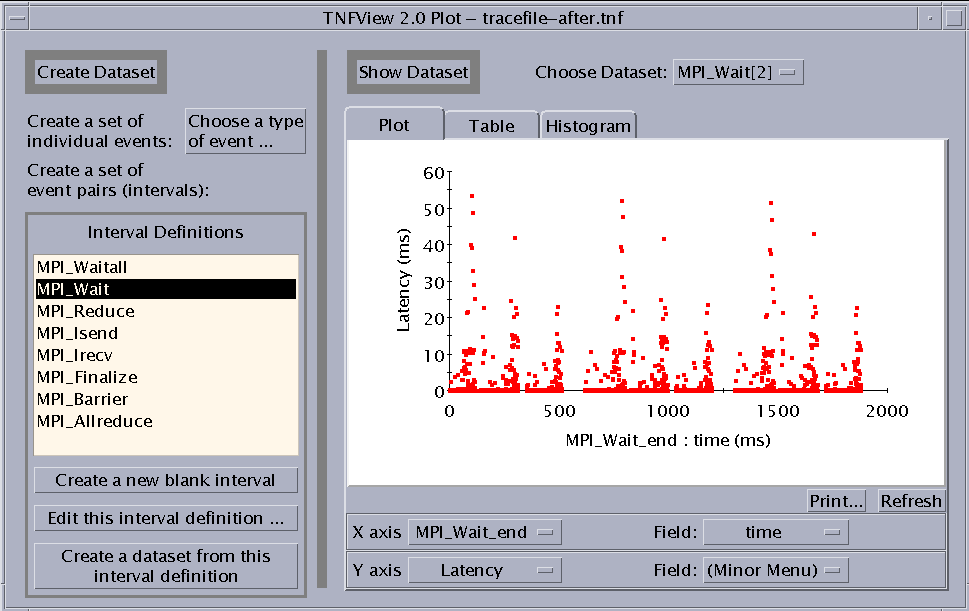
One notable signature of our changes is found by examining the scatter plot of MPI_Wait times. The new data, shown in Figure 7-6 and akin to Figure 7-3, indicate that MPI_Wait times are considerably reduced. There are still occasional long waits, but they are reproducible from iteration to iteration and result from waits on receives for data that the senders simply have not yet sent. These indicate critical paths that are inherent to the application and have little to do with how fast MPI is moving data.
Figure 7-6 Scatter Plot of MPI_Wait Times. Times are much lower than in Figure 7-3 due to MPI tuning.
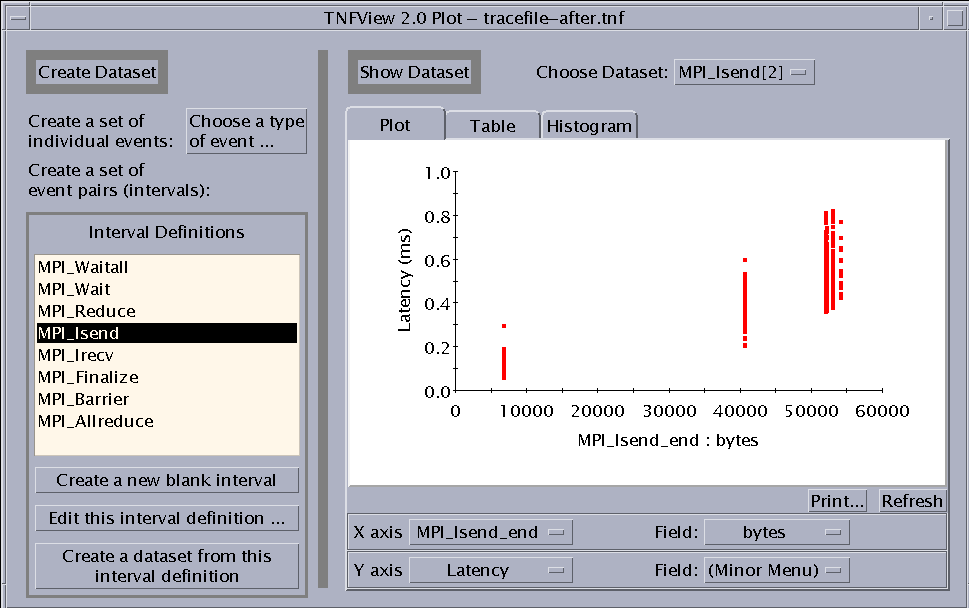
Another notable figure is the scatter plot for MPI_Isend times, shown in Figure 7-7. In this case, for the X axis, we have chosen the Field: to be bytes and then used the Refresh button to refresh the plot. The figure indicates that MPI_Isend performance grows roughly linearly with the message size at a rate of about 100 Mbyte/second, a reasonable rate for on-node data transfer.
Figure 7-7 Scatter Plot of MPI_Isend Times, Plotted Against Message Size.
- © 2010, Oracle Corporation and/or its affiliates
