Panning and Zooming in the Where Graph
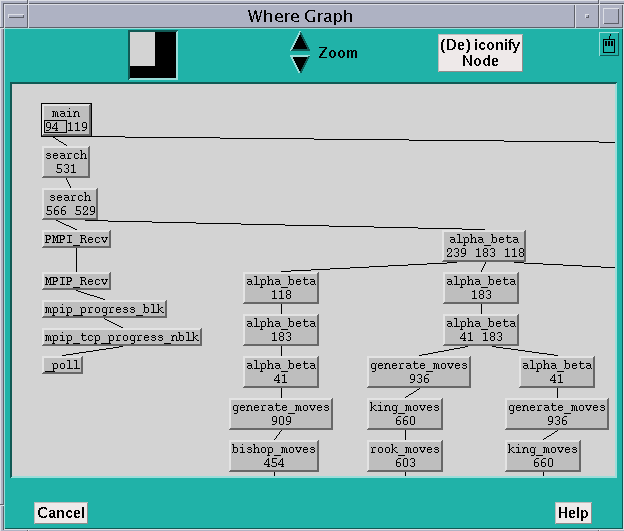
As Figure 4-6 shows, the Where graph can get quite large, so MP Prism provides methods for panning through it and zooming in and out.
The white box in the navigator rectangle at the top of the window shows the position of the display area relative to the entire Where graph. You can either drag the box or click at a spot in the navigator. The box moves to that spot, and the window shows the Where graph in this area of the total display.
To display more of the Where graph at the same time, click on the Zoom down arrow to the right of the navigator. This reduces the size of the boxes representing the functions and removes information. Figure 4-6 shows the Where graph of Figure 4-5, zoomed out one level. Note that the information about the current process's arguments is gone.
Figure 4-6 Where Graph, Zoomed Out One Level

Zooming out one more level removes the line numbers, and one more level after that removes the function names, leaving only boxes connected by lines. You can still shift-click on a box to display information about it.
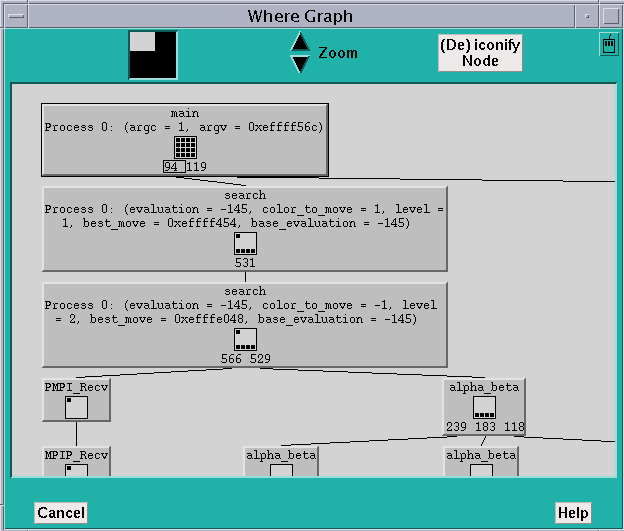
Clicking on the Zoom up arrow increases the size of the function boxes and includes more information in them. Figure 4-7 shows the Where graph of Figure 4-5, zoomed in. In this case, the Where graph shows, for each function, the processes that have that function in their call stack. As in the Psets window, the processes are represented as bitmaps of cells, numbered starting at the upper left, increasing from left to right and then jumping to the next row.
Figure 4-7 Where Graph, Zoomed In

Zooming in another level shows all arguments for all processes.
- © 2010, Oracle Corporation and/or its affiliates
