Coping With Buffer Wraparound
Prism's MPI performance analysis can collect a lot of data. TNF probe data collection employs buffer wraparound, so that once a buffer file is filled the newer events will overwrite older ones. Thus, final traces do not necessarily report events starting at the beginning of a program and, indeed, the time at which events start to be reported may vary slightly from one MPI process to another, depending on the amount of probed activity on each process. Nevertheless, trace files will generally show representative profiles of an application since newer, surviving events tend to represent execution during steady state.
If buffer wraparound is an issue, then solutions include:
-
Using larger trace buffers
-
Selective enabling of probes
-
Profiling isolated sections of code
Prism's MPI performance analysis can disturb an application's performance characteristics, so it is sometimes desirable to focus data collection even if larger trace buffers are an option.
Using Larger Trace Buffers.
To increase the size of trace buffers beyond the default value, use the Prism command
(prism all) tnffile filename size
where size is the size in Kbytes of the output file for each process. The default value is 128 Kbytes.
By default, trace buffers are placed in /usr/tmp before they are merged into the user's trace file. If this file partition is too small for very large traces, buffers can be redirected to other directories using the PRISM_TNFDIR environment variable. In order to minimize profile disruption caused by writing very large trace files to disk, one should use local file systems such as /usr/tmp and /tmp whenever possible instead of file systems that are mounted over a network.
Note -
While Prism generally cleans up trace buffers after the final merge, abnormal conditions could leave large files behind. Users who abort profiling sessions with large traces should check /usr/tmp periodically for large, unwanted files.
Selectively Enabling Probes
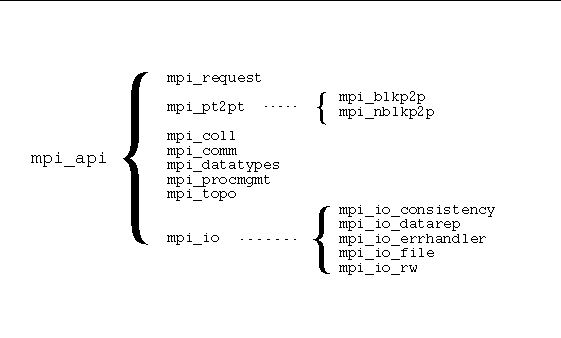
One might focus data collection on events that are believed to be most relevant to performance in order either to reduce sizes of buffer files or to make profiling less intrusive. TNF probes are organized in probe groups. For the TNF-instrumented version of the Sun MPI library, the probe groups are structured as follows:
Figure 7-12 Sun MPI TNF Probe Groups

Some TNF probes belong to more than one group in the TNF-instrumented version of the Sun MPI library. For example, there are several probes that belong to both the mpi_request group and the mpi_pt2pt group. For further information about probe groups, see the Sun MPI 4.0 Programming and Reference Guide.
For message-passing performance, typically the most important groups are
-
mpi_pt2pt - point-to-point message passing
-
mpi_request - other probes for asynchronous point-to-point calls
-
mpi_coll - collectives
-
mpi_io_rw - file I/O
If there is heavy use of MPI_Pack and MPI_Unpack, their probes should also be enabled.
Profiling Isolated Sections of Code At Run Time.
Another way of controlling trace sizes is to profile only isolated sections of code. Prism supports this functionality by allowing users to turn collection on and off during program execution whenever execution is stopped - say, with a break point or by using the interrupt command.
If the profiled section will be entered and exited many times, data collection may be turned on and off automatically using tracepoints. Note that the term "trace" is used now in a different context. For TNF use, a trace is a probe. For Prism and other debuggers, a tracepoint is a point where execution stops and possibly an action takes place but, unlike a breakpoint, program execution resumes after the action.
For example, if data collection should be turned on at line 128 but then off again at line 223, one may specify
(prism all) trace at 128 {tnfcollection on}
(prism all) trace at 223 {tnfcollection off}
If the application was compiled and linked with high degrees of optimization, then specification of line numbers may be meaningless. If the application was compiled and linked without -g, then specification of line numbers will simply not work. In such cases, data collection may be turned on and off at entry points to routines using trace in routine syntax.
Profiling Isolated Sections of Code Within Source Code.
TNF data collection can also be turned on and off within user source code using the routines tnf_process_disable, tnf_process_enable, tnf_thread_disable, and tnf_thread_enable. Since these are C functions, one must call them as follows from Fortran:
call tnf_process_disable()   !$pragma c(tnf_process_disable)
call tnf_process_enable()    !$pragma c(tnf_process_enable)
call tnf_thread_disable()    !$pragma c(tnf_thread_disable)
call tnf_thread_enable()     !$pragma c(tnf_thread_enable)
Whether these functions are called from C or Fortran, one must then link with -ltnfprobe. For more information, see the Solaris man pages on these functions.
- © 2010, Oracle Corporation and/or its affiliates
