| C H A P T E R 8 |
|
Profiling |
An important component of performance tuning is profiling, through which you develop a picture of how well your code is running and what sorts of bottlenecks it might have. Profiling can be a difficult task in the simplest of cases, and the complexities multiply with MPI programs because of their parallelism. Without profiling information, however, code optimization can be wasted effort.
This chapter includes a few case studies that examine some of the NAS Parallel Benchmarks 2.3. These are available from the NASA Ames Research Center at
http://www.nas.nasa.gov/Software/NPB/index.html
|
Note - The runs shown in this chapter were not optimized for the platforms on which they executed. |
It is likely that only a few parts of a program account for most of its runtime. Profiling enables you to identify these "hot spots" and characterize their behavior. You can then focus your optimization efforts on the spots where they will have the most effect.
Profiling can be an experimental, exploratory procedure. So you might find yourself rerunning an experiment frequently. It is a challenge to design such runs so that they complete quickly, while still capturing the performance characteristics you are trying to study. There are several ways you can strip down your runs to achieve this balance, including reducing the data set and performing fewer loop iterations. However, regardless of which streamlining method you employ, keep the following caveats in mind:
There are various approaches to profiling Sun HPC ClusterTools programs:
Use the DTrace dynamic tracing utility. DTrace is a component of the Solaris 10 OS. DTrace is a comprehensive dynamic tracing utility that you can use to monitor the behavior of applications programs as well as the operating system itself. For more information about DTrace, refer to the Solaris Dynamic Tracing Guide (Part Number 817-6223). This guide is part of the Solaris 10 OS Software Developer Collection.
Solaris 10 OS documentation can be found on the web at the following location:
http://www.sun.com/documentation
TABLE 8-1 outlines the advantages and disadvantages associated with each of these methods of profiling.
The following are sample scenarios:
Using MPProf, you can easily see if your program is spending a lot of time in MPI. It will suggest environment variable values for you.
Using the Performance Analyzer, you can see which routines consume the most time.
Adding timers and other instrumentation around innermost loops might help you if you already have some idea about your code's performance.
Depending on how those tools were constructed, the MPI profiling interface might allow you to continue using them with Sun HPC ClusterTools programs.
Sun HPC ClusterTools software includes the mpprof profiler, a tool that supports programming with the Sun MPI library.
To collect profiling data on a Sun MPI program, set the MPI_PROFILE environment variable before running the program. To generate a report using this data, invoke the mpprof command-line utility. For example:
If profiling has been enabled, Sun MPI creates a binary-format profiling data file for each MPI process. The MPProf utility digests the data from these numerous, intermediate, data files--generating statistical summaries in ASCII text. Wherever possible, MPProf adds direct tuning advice to the statistical summaries of MPI process behavior.
MPProf does not provide detailed information about the ordering of message-passing events or interprocess synchronization. That is, MPProf is not a trace-history viewer.
|
Note - To get information on user code as well as MPI message-passing activity, use Performance Analyzer. |
Output from the MPProf report generator is self explanatory and should require no further documentation. Nevertheless, sample output is included here for readers who do not have immediate access to this tool.
The first section (sample output shown in box below) is an overview that includes
The Load section (sample output shown in box below) shows the distribution of how much time was spent in MPI per process. When a process spends much time in MPI, this may be because it's waiting for another process. Thus, performance bottlenecks may be in processes that spend little time in MPI. Those processes, as well as the nodes they ran on, are identified in this section. Other tools, such as the Performance Analyzer, are needed to pinpoint bottlenecks further if load imbalances are apparent.
As discussed in Chapter 7, Sun MPI environment variables are set by default to values that will be appropriate in many cases, but runtime performance can in cases be enhanced by further tuning.
In particular, Sun MPI implements two-sided message passing between processes that cannot directly access one another's address spaces with internal shared buffers. If these buffers become congested, performance can suffer. MPProf monitors these buffers, watches for congestion, and suggests environment variable values for enhanced performance at the cost of higher memory usage.
The report discusses its recommendations and then provides a summary (sample output shown in box below) that may be "copy-and-pasted" into a session window or run script. The code may then be run again to determine whether better performance results from the recommendations.
The Breakdown by MPI Routine section of the report (sample output shown in box below) gives a breakdown by MPI routine. Attributing bytes sent and received to MPI routines can be tricky due to nonblocking and collective operations. Note that:
Performance analysis tools are sometimes classified as profiling tools, which give overall performance characterization of a program, or tracing tools, which give detailed time histories of events that occur during program execution.
While MPProf is a profiling tool, it includes some time-dependent information (a sample of the Time Dependence section of the MPProf report is shown below). This information is coarse but can prove useful in different ways:
In the following example, there is considerable broadcast and barrier activity before the program settles down to steady-state behavior, the performance of which is critical for long-running programs.
A connection is a sender/receiver pair. MPProf shows how much point-to-point message traffic there is per connection, with one matrix showing numbers of messages and another showing numbers of bytes. Values are scaled.
A real application is likely to have various communication patterns in it, but the overall matrix may resemble some easy-to-recognize case. The following examples illustrate some simple patterns.
Once the connectivity matrices have been displayed, MPProf prints the average message length:
This message length can be compared to the product of some characteristic latency in your system and some characteristic bandwidth. For example, if "ping-pong" tests indicate an MPI latency of about 2 microseconds and bandwidth of about 500 Mbyte/sec, then the product is 1000 bytes. An average length of 13916 bytes suggests bandwidth is more important than latency to your application's performance.
MPProf profiling might be used with multi-threaded MPI programs. If many threads per process are engaged in heavy MPI activity, however, MPProf data collection can slow down measurably. MPProf aggregates data for all threads on a process.
It is sometimes possible to extract more information from MPProf data files than the report generator prints out. You can use the mpdump utility to convert MPProf binary data files to an ASCII format and then process the data directly, perhaps with customized scripts. The format of the ASCII files is undocumented, but it is easy to interpret.
MPProf writes relatively little data to disk during profiling runs. This means that it is relatively easy to use compared to tracing tools, the data volumes of which must be managed carefully.
Nevertheless, one file per process is generated and it is worth managing these files. Specifically, MPProf profiling generates one data file per process per run, as well as one index file per run that points to the data files. The data files, by default, are stored in /usr/tmp of the respective nodes where the processes ran.
% mpprof -r -g directory mpprof.index.rm.jid
to collect data files from their respective nodes to an archival location if you want to save the files.
% mpprof -r -mpprof.index.rm.jid
to remove data files to clean up after a run.
MPProf generates suggestions for tuning Sun MPI environment variables.
These suggestions are often helpful, but they do not guarantee performance improvement. Some experimentation may be necessary. If you incorporate MPProf's suggestions, the next profiling run may indicate further suggestions. Multiple reruns may be required before MPProf no longer has further recommendations, but most of the speedup, if any, is likely to result from the first round or two of experimentation.
Rerunning a program incorporating MPProf's tuning suggestions may be automated. Here is an example.
The Performance Analyzer offers a good first step to understanding the performance characteristics of a program on Sun systems. It combines ease of use with powerful functionality.
As with most profiling tools, there are two basic steps to using Sun's performance analysis tools. The first step is to use the Collector to collect performance data. The second step is to use the Performance Analyzer to examine results. For example, this procedure can be as simple as replacing this:
% mprun -np 16 a.out 3 5 341
% mprun -np 16 collect a.out 3 5 341
% analyzer test.*.er
Sun's compilers and tools are usually located in the directory /opt/SUNWspro/bin. Check with your system administrator for details for your site.
The following sections show the use of the Performance Analyzer with Sun MPI programs, often revisiting variations of the preceding example.
There are several ways of using the Collector with MPI codes. For example, the simplest usage would be to add collect to the mprun command line:
% mprun -np 16 collect a.out 3 5 341
In this section we discuss some of the issues that can arise when using the Collector, and how to handle them.
The volume of collected data can grow large, especially for long-running or parallel programs. Though the Collector mitigates this problem, the scaling to large volumes remains an issue.
There are a number of useful strategies for managing these data volumes:
For example, to reduce the number of profiled events roughly by a factor of two, use:
% mprun -np 16 collect -p 20 a.out 3 5 341
This strategy should be a routine part of data collection.
A large parallel job might run out of a central NFS-mounted file system. While this might be adequate for jobs that are not I/O intensive, it might cause a critical bottleneck for profiling sessions. If multiple MPI processes are trying to write large volumes of profiling data simultaneously over NFS to a single file system, that file system, along with network congestion, could lead to tremendous slowdowns and perturbations of the program's performance. It is preferable to collect profiling data to local file systems and, perhaps, gather them to a central directory after program execution.
To identify local file systems, use:
% /usr/bin/df -lk
on each node of the cluster you will use, or ask your system administrator about large-volume, high-performance disk space.
One possible choice of a local file system is /tmp. Note that the /tmp file system on different nodes of a cluster refer to different, respectively local file systems. Also, the /tmp file system might not be very large, and if it becomes filled there might be a great impact on general system operability.
The Collector generates one "experiment" per MPI process. If there are multiple runs of a multiprocess job, therefore, the number of experiments can grow quickly.
To organize these experiments, it often makes sense to gather experiments from a run into a distinctive subdirectory. Use the commands er_mv, er_rm, and er_cp (again, typically under the directory /opt/SUNWspro/bin) to move, remove, or copy experiments, respectively. For more information on these utilities, refer to the corresponding man pages or the Sun Studio Compiler Collection documentation.
If you collect an experiment directly into a directory, make sure that the directory has already been created and, ideally, that no other experiments already exist in it.
The er_rm steps are not required because (in this instance) we are using freshly created directories. Nevertheless, these steps serve as reminders to avoid the confusion that can result when too many experiments are gathered in the same directory.
The Collector collects sampling information by default. Thus, Sun MPI calls will be profiled if they consume a sufficiently high fraction of runtime. Sometimes it is interesting to capture MPI calls more methodically. In particular, for time-line analysis, it is desirable to mark the beginnings and endings of MPI calls with higher resolution than sampling provides. MPI call tracing may be activated with the
-m on switch to collect.
Sometimes it is desirable to collect data not only on a process, but its descendants, as well. The collect tag will follow descendants with the -F on switch.
For example, the Solaris 10 Operating System supports multiple page sizes with the /usr/bin/ppgsz command-line utility. To collect performance data on a code run with 4-Mbyte memory pages, our sample data collection becomes:
% mprun -np 16 collect -F on ppg sz -o heap=4M,stack=512K a.out 3 5 341
In the particular case of the ppgsz utility, a cleaner alternative may be to preload the mpss.so.1 shared object, so that the ppgsz utility need not appear on the command line. For more information on multiple page size support, see the ppgsz and mpss.so.1 man pages in the Solaris 10 Operating System.
Once data has been gathered with the Collector, it can be viewed with the Performance Analyzer. For example:
% analyzer myrun/test.*.er
Use of the Performance Analyzer is illustrated in the case study.
There are also command-line utilities to aid in data analysis. For more information, see the er_print and er_src man pages. Here are examples of their use:
% er_print -functions test.*.er
% er_print -functions test.*.er | grep PMPI_
% er_print -callers-callees test.*.er
% er_print -source myfunction_ 1 test.*.er
The 1 is used to distinguish in case of multiple instances of the named function.
In this case study, we examine the NPB 2.3 BT benchmark. We run the program using the following environment variable settings:
These settings are not required for Performance Analyzer profiling. We simply use them to profile our code as it would run in production. See Appendix C for more information about using Sun MPI environment variables for high performance. Also refer to the Sun MPI Programming and Reference Guide.
The job is run on a single, shared-memory node using 25 processes.
FIGURE 8-1 shows the Performance Analyzer's first view of the resulting profiling data. This default view shows how time is spent in different functions. Both exclusive and inclusive user CPU times are shown for each function, excluding and including, respectively, time spent in any functions it calls. The top line shows that a total of 3362.710 seconds, over all 25 processes, are profiled.
We see that the functions LHSX(), LHSY(), and LHSZ() account for
523.410+467.960+444.350=1435.72 seconds of that time.
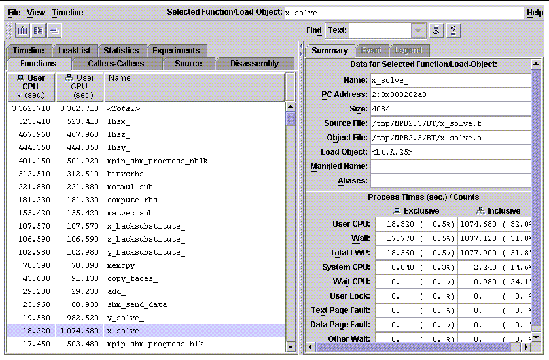
Fortran programmers will note that the term function is used in the C sense to include all subprograms, whether they pass return values or not. Further, function names are those generated by the Fortran compiler. That is, by default they are converted to lower case and have an underscore appended.
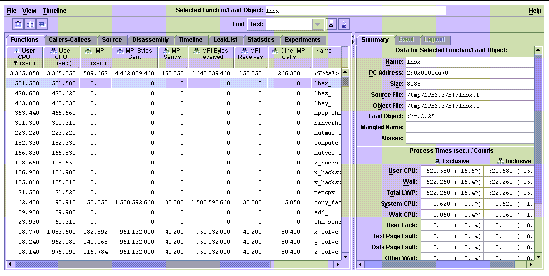
In FIGURE 8-2, we see how this overview appears when MPI tracing is turned on with the Collector's -m on switch. Note that accounting for bytes sent and received is slightly different from the way accounting is handled by MPProf. In particular, for bytes received, the size of the receive buffer is used rather than the actual number of bytes received. For more information on how bytes are counted for MPI calls, refer to the Performance Analyzer documentation volume Program Performance Analysis Tools.
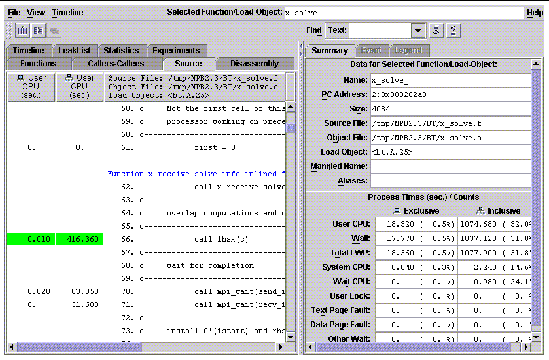
We can see how time is spent within a subroutine if the code was compiled and linked with the -g switch. This switch introduces minimal impact on optimization and parallelization, and it can be employed rather freely by performance-oriented users. When we click on the Source tab, the Performance Analyzer brings up a text editor for the highlighted function. The choice of text editor can be changed under the Options menu with the Text Editor Options selection. The displayed, annotated source code includes the selected metrics, the user source code, and compiler commentary. A small fragment is shown in FIGURE 8-3. In particular, notice that the Performance Analyzer highlights hot (time-consuming) lines of code. Only a small fragment is shown since, in practice, the annotated source can become rather wide.
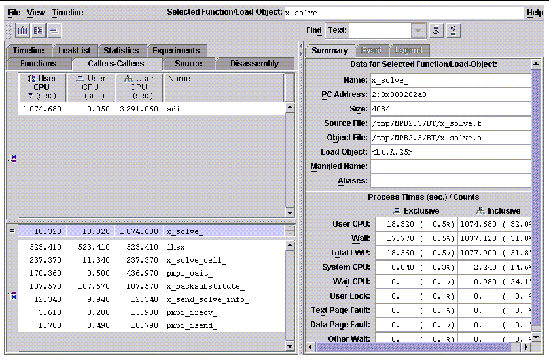
To get a better idea of where time is spent at a high level in the code, you can also click on the Callers-Callees tab. FIGURE 8-4 shows a possible Callers-Callee view. The selected function appears in the middle section, its callers appear above it, and its callees below. Selected metrics are shown for all displayed functions. By clicking on callers, you can find where time incurred in the particular function occurs in the source code at a high level. By clicking on callees, you can find more detail on expensive calls a particular function might be making. This sort of analysis is probably familiar to gprof users, but the Performance Analyzer has features that go beyond some of gprof's limitations. For more information about gprof, see Using the gprof Utility.
Different metrics can be selected for the various displays by clicking on the Metrics button, as seen at the bottom of FIGURE 8-1. You can choose which metrics are shown, the order in which they are shown, and which metric should be used for sorting.
Click on the Timeline tab to see a view similar to the one shown in FIGURE 8-5. Time is shown across the horizontal axis, while experiments appear on the vertical axis. Experiments are numbered sequentially, starting from 1. For example, MPI rank 7 might appear as experiment 8. The timeline view helps you see synchronization points, load imbalances, and other performance characteristics of your parallel MPI program.
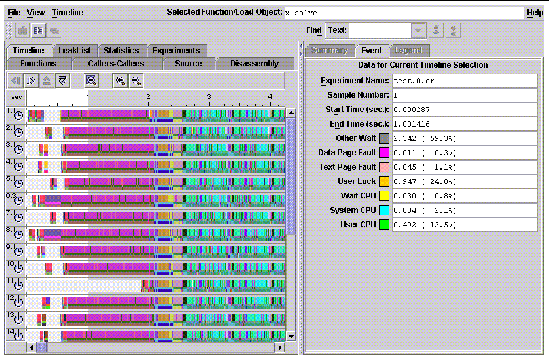
In FIGURE 8-6, another timeline view is shown. Click on an event to see its callstack in the lower right corner. When you zoom in to the time scale of the clock sampling (10 milliseconds by default), clock-sampled events appear discretely on the view. Using MPI tracing helps maintain resolution even to the highest levels of zoom.
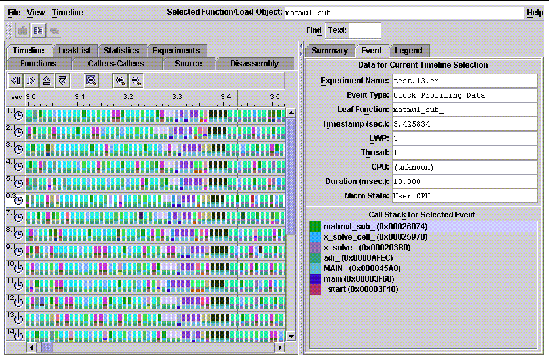
Because clocks on different nodes of a cluster are not guaranteed to be synchronized, and because the Performance Analyzer makes no attempt to synchronize time stamps from different nodes, timeline views of Sun MPI runs that were distributed over multiple nodes in a cluster are not guaranteed to be displayed properly.
In a profile, you will typically find many unfamiliar functions that do not appear explicitly in your code. Further, it can happen that none of the familiar MPI calls you do use will appear, such as MPI_Isend(), MPI_Irecv(), MPI_Wait(), or MPI_Waitall().
FIGURE 8-7 shows examples of functions you might find in your profiles, along with explanations of what you are seeing. The functions are organized by load object, such as an executable (here, a.out) or a dynamic library.
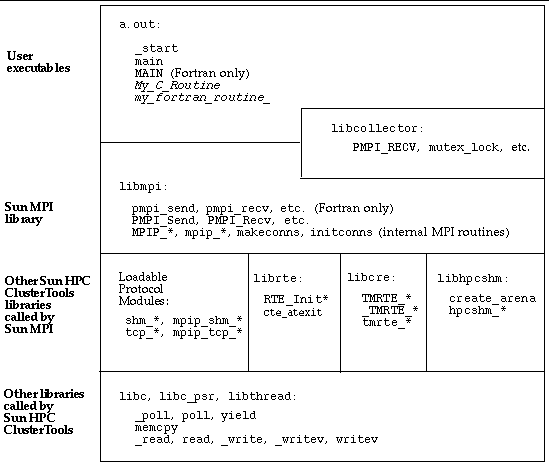
For example, a C call to MPI_Send() will enter the function PMPI_Send.
Sun MPI uses a number of internal routines, which will appear in profiles.
One way to get an overview of which MPI calls are being made, and which are most important, is to look for the PMPI entry points into the MPI library. For our case study example:
In this example, roughly 20 seconds out of 146.93 seconds profiled are due to MPI calls. The exclusive times are typically small and meaningless. Synchronizing calls, such as PMPI_Wait and PMPI_Waitall, appear twice, once due to libmpi and once to libcollector. Such duplication can be ignored.
If ever there is a question about what role an unfamiliar (but possibly time-consuming) function is playing, within the Performance Analyzer you can:
Time might be spent in MPI calls for a wide variety of reasons. Specifically, much of that time might be spent waiting for some condition (a message to arrive, internal buffering to become available, and so on), rather than in moving data.
While an MPI process waits, it might or might not tie up a CPU. Nevertheless, such wait time probably has a cost in terms of program performance.
Your options for ensuring that wait time is profiled include:
Both Sun MPI and the Solaris OS environment offer useful profiling facilities. Using the MPI profiling interface, you can investigate MPI calls. Using your own timer calls, you can profile specific behaviors. Using the Solaris gprof utility, you can profile diverse multiprocess codes, including those using MPI.
The MPI standard supports a profiling interface, which allows any user to profile either individual MPI calls or the entire library. This interface supports two equivalent APIs for each MPI routine. One has the prefix MPI_, while the other has PMPI_. User codes typically call the MPI_ routines. A profiling routine or library will typically provide wrappers for the MPI_ routines that simply call the PMPI_ ones, with timer calls around the PMPI_ call.
You can use this interface to change the behavior of MPI routines without modifying your source code. For example, suppose you believe that most of the time spent in some collective call, such as MPI_Allreduce, is due to the synchronization of the processes that is implicit to such a call. Then, you can compile a wrapper such as the one that follows, and link it into your code before the -lmpi switch. The effect will be that time profiled by MPI_Allreduce calls will be due exclusively to the MPI_Allreduce operation, with synchronization costs attributed to barrier operations.
subroutine MPI_Allreduce(x,y,n,type,op,comm,ier) integer x(*), y(*), n, type, op, comm, ier call PMPI_Barrier(comm,ier) call PMPI_Allreduce(x,y,n,type,op,comm,ier) end |
Profiling wrappers or libraries can be used even with application binaries that have already been linked. Refer to the Solaris man page for ld for more information about the environment variable LD_PRELOAD.
You can get profiling libraries from independent sources for use with Sun MPI. An example of a profiling library is included in the multiprocessing environment (MPE) from Argonne National Laboratory. Several external profiling tools can be made to work with Sun MPI using this mechanism. For more information on this library and on the MPI profiling interface, refer to the Sun MPI Programming and Reference Guide.
Sun HPC ClusterTools implements the MPI timer call MPI_Wtime (demonstrated in the example that follows) with the high-resolution timer gethrtime. If you use MPI_Wtime calls, you should use them to measure sections that last more than several microseconds. Times on different processes are not guaranteed to be synchronized. For information about the gethrtime timer, see the gethrtime(3C) man page.
When profiling multiprocess codes, ensure that the timings are not distorted by the asynchrony of the various processes. For this purpose, you usually need to synchronize the processes before starting and before stopping the timer.
In the following example, most processes might accumulate time in the interesting, timed portion, waiting for process 0 (zero) to emerge from uninteresting initialization. This condition would skew your program's timings. For example:
When stopping a timer, remember that measurements of elapsed time will differ on different processes. So, execute another barrier before the "stop" timer. Alternatively, use "maximum" elapsed time for all processes.
Avoid timing very small fragments of code. This is good advice when debugging uniprocessor codes, and the consequences are greater with many processors. Code fragments perform differently when timed in isolation. The introduction of barrier calls for timing purposes can be disruptive for short intervals.
The Solaris utility gprof might be used for multiprocess codes, such as those that use MPI. Several points should be noted:
Note, however, that the gprof utility has several limitations.
Note that the Performance Analyzer is simple to use, provides the profiling information that gprof does, offers additional functionality, and avoids the pitfalls. Thus, gprof users are highly encouraged to migrate to the Performance Analyzer for both MPI and non-MPI codes.
For more information about the gprof utility, refer to the gprof man page. For more information about the Performance Analyzer, refer to the documentation supplied with the Sun Studio Compiler Collections.
Copyright © 2006, Sun Microsystems, Inc. All Rights Reserved.