| C H A P T E R 1 |
Introduction to Service Availability Manager |
This chapter discusses the following topics:
Service Availability Manager is an add-on to Sun Management Center 3.0 that enables you to monitor the availability of Internet services. The monitored services can run either locally or remotely. Service Availability Manager enables you to measure and monitor the availability of the following Internet services:
This add-on uses Sun Management Center agent modules to measure and monitor the availability of the service. You can load Sun Management Center instances to monitor different services locally and remotely. The modules used to monitor services locally are called Service Element modules. The modules used to monitor services remotely are called Synthetic Transaction modules. Once loaded, the modules display the status of the services.
The modules also send service requests periodically, according to the parameters of the requests, and measure the response times of the requests. You can also group a set of Sun Management Center modules that are monitoring various services and view the high level summary of their status. The logical grouping of the modules monitoring the services are represented in a composite object called the service object. The high-level summary of the status of services is displayed in a new graphical user interface (GUI) called Service Manager. This new GUI can be invoked from the Sun Management Center 3.0 Java console.
Before you can use Service Availability Manager, you must perform several tasks. An outline of the tasks is provided here. More detailed procedures are contained in the following chapters. A more thorough discussion of some of the components mentioned here is found later in this chapter. In brief, the tasks you will need to perform are:
1. Install the add-on software on all agents from which you want to monitor a service, as well as on the Sun Management Center 3.0 server layer.
2. Use the setup script to setup the software on the agent and server layers.
3. Load the Service Element modules on each host that is running a service, in order to monitor the service locally.
4. Load the Synthetic Transaction modules on the host, in order to monitor the services running remotely.
The loading of the Service Element and Synthetic Transaction modules is what enables you to monitor services. The host details view is available for looking at information displayed by the modules.
You can now start viewing the availability status of services with Service Availability Manager. To look at the high-level summary of the available services and their status, you need to:
1. Create the service object on the host that has the Synthetic Transaction modules loaded. You can do this by either using the discovery capabilities or by using the Create Composite Object utility, both found in Sun Management Center 3.0.
2. Right-click the service object that you created. From the menu that appears, either:
To monitor services remotely, Service Availability Manager uses Synthetic Transaction modules. Synthetic (dummy) transactions are used to simulate the use of the services. The synthetic transactions can be used to measure performance statistics such as DNS resolve time, the total time a transaction takes, or connect time. There are ten kinds of Synthetic Transaction modules included in Service Availability Manager.
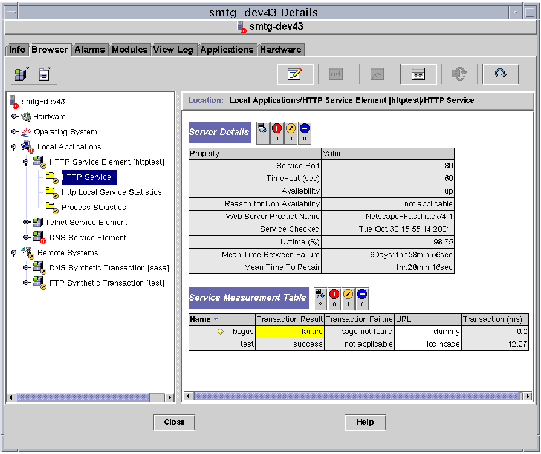
To monitor services on the same (local) system, Service Availability Manager uses Service Element modules. A Service Element module sends service requests periodically according to configuration parameters you specify. In this way both service availability and response time can be determined. There are ten kinds of Service Element modules included in Service Availability Manager. See FIGURE 1-1 for an example of the HTTP Service Element module.

An important feature of Service Availability Manager is the service object. A service object is a composite object containing Service Element modules and Synthetic Transaction modules. You customize a service object by using the Modify Service Object dialog to select the set of modules wanted.
Service Manager GUI displays in a single view the availability of all the services contained in a service object. The GUI is linked to the Sun Management Center 3.0 Java console only.
The Service Manager dialog displays the availability of the different services locally and remotely. Service Availability Manager dynamically updates the data in the table to reflect the real-time status of the services.
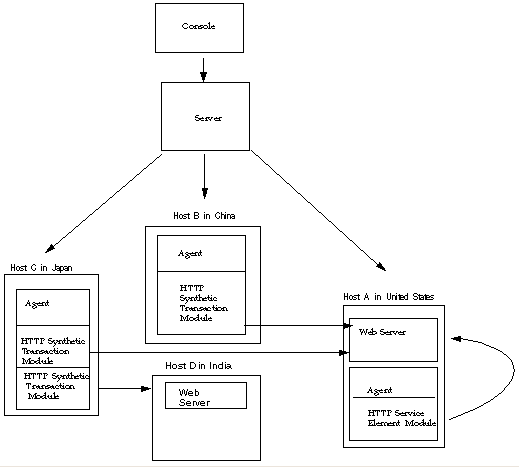
The following illustration depicts an example of how Sun Management Center 3.0 Service Availability Manager can be used:

In this example, a single Sun Management Center server is shown with three agents:
With this configuration, the system administrator for Host A can monitor the web server that is running locally. The administrator can also check remotely from Hosts B and C on the status and measure the performance of the web server on Host A. The HTTP Synthetic Transaction modules loaded on Hosts B and C makes this possible.
Host D has a web server running, but does not have an agent installed. This means the system administrator can not monitor the services locally. However, from Host D the services can be monitored remotely. The HTTP Synthetic Transaction modules loaded on Host C enables the remote monitoring of the web server on Host D.