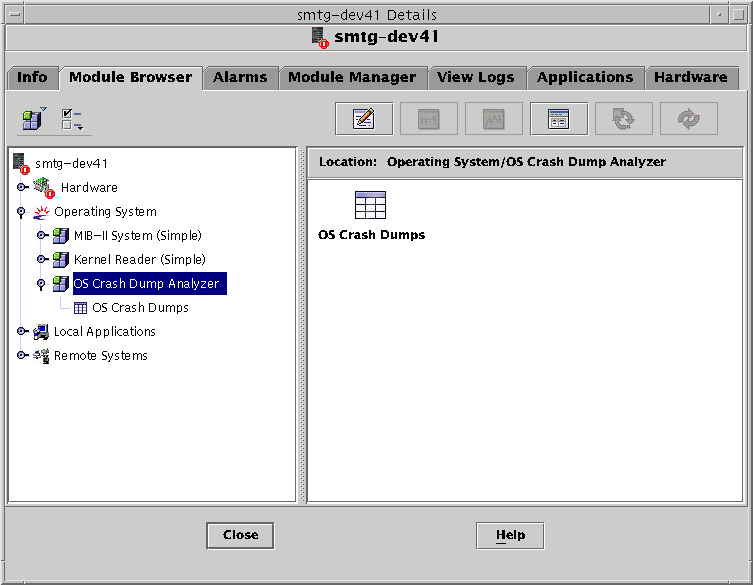
Overview of the OS Crash Dump Analyzer Module
The OS Crash Dump Analyzer module checks the dump configuration of a system, and detects whether an OS crash dump has occurred.
This module also provides the following features:
-
Displays the current configuration of the system crash dump data, and helps detect OS crash dump files that are saved in the savecore directory
-
Prints a report that can be used to help analyze the crash dump files
-
Enables you to send output to one or more email addresses
The OS Crash Dump Analyzer module generates the following types of alarms:
-
An alert alarm when the module detects that at least one crash dump has occurred
-
A caution alarm if savecore is disabled, since this situation is not a recommended configuration
-
A caution alarm for each UNIX or vmcore file the module cannot find
You can configure the alarm thresholds through the Attributes window. For more information on the Attributes window, refer to the Sun Management Center 3.5 User's Guide.
The data acquisition for the module is based on the dumpadm command. The dumpadm command is not available on the Solaris 2.6 operating environment. Therefore, if at setup time the dumpadm tool cannot be found, the module prompts for the location of the savecore directory. The usual location is /var/crash/system_name.
The OS Crash Dump Analyzer displays two tables, the Dump Configuration table and the List of UNIX/vmcore Files table.
The Dump Configuration table displays the values listed in the following table.
Table 2–1 Dump Configuration Table
The Dump Configuration table does not show the same information on the Solaris 2.6 operating environment. On this operating environment, only the savecore directory and number of crash dumps is given.
The List of UNIX/vmcore Files table gives more information about each crash dump.
Table 2–2 List of UNIX/vmcore Files Table|
Field |
Description |
|---|---|
|
ID |
File identification |
|
Size of vmcore |
Size of vmcore file |
|
Size of unix core |
Size of UNIX core file |
|
Timestamp |
Timestamp |
To Access the OS Crash Dump Analyzer
-
Load the OS Crash Dump Analyzer module.
To learn how to load a module, refer to the Sun Management Center 3.5 User's Guide. Once loaded, this module is located under the Operating System category.
You can also specify your contact email address at this time. For detailed steps, see To Specify an Email Address.
-
Double-click Operating System in the Navigator window.
-
Double-click OS Crash Dump Analyzer.
The OS Crash Dump Analyzer icon is displayed in the Viewer window.

-
Double-click the OS Crash Dumps icon in the Viewer window.
The Details window displays the Dump Configuration Table and the List of UNIX/vmcore Files Table.
To Specify an Email Address
The module assumes that you provided an email address when you loaded the module. To specify an email address for use by the module, do the following:
-
Press mouse button 3 on the OS Crash Dump Analyzer icon in the Navigator window.
A pop-up menu is displayed
-
Choose Edit Module from the menu.
The Edit Module dialog box appears.
-
Provide the contact email address.
-
Click OK.
To Display the Savecore Filesystem Size
-
If the OS Crash Dump Analyzer module is not already displayed, access the module as described in To Access the OS Crash Dump Analyzer.
-
Press mouse button 3 on the OS Crash Dumps icon located in the Navigator window.
A pop-up menu is displayed.
-
Choose Savecore Filesystem Size
Sun Management Center displays the Probe Viewer window with the results of the command.
To Analyze the Crash Dump File
-
If the OS Crash Dump Analyzer module is not already displayed, access the module as described in To Access the OS Crash Dump Analyzer.
-
Select a crash dump file in the List of UNIX/vmcore Files table.
-
Press mouse button 3 anywhere in the row.
A pop-up menu is displayed.
-
Choose System Crash Dump Analysis.
This option displays the results in the Probe Viewer window. The information includes stack trace, process information, message buffers, and other such detail.
If files are corrupted, the Probe Viewer displays an incomplete report providing only status information.
-
(Optional) If you want the results sent in an email message, press mouse button 3 in the row and choose Analysis Output by Email from the pop-up menu.
- © 2010, Oracle Corporation and/or its affiliates
