Overview of the Details Window
The details view is a subset of the Domain view. The highest hierarchical object in a details view is the host machine or module object. For more information about module objects, see To Create a Module Object. Unlike the administrative domain view, the details view enables you to see modules and the various monitored properties and statistics contained in the modules.
The Details window displays several tabs. The commonly seen tabs are shown in Table 6–1.
Click a tab to view the named information.
The tabs that appear in the Details window depend on the type of selected object. For example, the Hardware tab appears only if the Config-Reader module is supported on your system. For additional information about the tabs for your specific hardware object, see your platform supplement.
Table 6–1 Common Details Window Tabs|
Tab |
Description |
|---|---|
|
Provides general information about the managed object including name, IP address, polling type, and so on. This information is collected at the time the object is created. Info is the default view if the managed object is being monitored through SNMP or ICMP or if the object is in a non-monitored status. |
|
|
Enables you to navigate through the hierarchy and contents views of the hardware, operating system, local applications, and remote systems. Module Browser is the default view if the managed object is being monitored through a Sun Management Center agent. The Module Browser is described in Chapter 7, Browsing Information About a Managed Object. |
|
|
Displays alarm status messages and the alarm controls for the current host or node. Enables you to acknowledge or delete alarms. Alarms are described in Chapter 12, Managing Alarms. |
|
|
Module Manager |
Displays available modules and identifies which modules are loaded, scheduled, and enabled. Also indicates any modules that are multi-instance modules. Enables you to load, enable, disable, and unload modules. |
|
View Logs |
Displays information from log files, including error messages, for your host. Enables you to search, monitor, and examine system, Sun Management Center, and other log messages. |
|
Applications |
If Advanced System Monitoring add-on is installed, displays a list of applications. These applications can include the processes that are running on the host, other installed applications, and hardware information. Process information appears only if the Solaris Process Details module is loaded. Hardware information appears only if the Hardware Diagnostics Suite software is enabled. For more information about the Hardware Diagnostic Suite, view its online help. |
|
Hardware |
Displays hardware configuration information about your host for selected hardware platforms. Configuration information might include the physical and logical view of your host. This tab appears only if the hardware platform is supported by the Config-Reader module. |
Info Tab
The Info tab shows the properties table for the current managed object. The properties table is the only information that is available from the Details window for objects that are monitored through SNMP or ICMP. The general properties are listed in the following table.
Table 6–2 General Properties in the Info Tab of the Details Window|
Property |
Description |
|---|---|
|
Label you selected when you created the node. |
|
|
Optional description that you entered when you created the node. |
|
|
Machine name [The host name in this property table does not change if you change the host name on the host device. To update the information, either modify the host object, or delete the existing host object and re-create the object with the new name. See To Modify an Object.] |
|
|
IP address [When a Sun Management Center entity is added to the topology, the Topology Agent queries the entity for its configured IP address and port for the Trap Handler and Event Manager components. However, the information stored in the topology will be incorrect if the entity is ever reconfigured to correct a misconfiguration or to change the entity server-context. If the information that is shown here for the Trap Handler and Event Manager is compared with the expected configuration of the entity and does not match, remove the entity from the topology and re-enter it.] |
|
|
Netmask associated with the host |
|
|
Operating system type and version |
|
|
Hardware architecture |
|
|
Host IP address of Sun Management Center server that receives this host's trap information |
|
|
Host IP address of Sun Management Center server that receives this host's events information |
|
|
Entity Polling Type |
Agent or SNMP |
|
Host name of the target |
|
|
IP address of the target |
|
|
Agent Version |
The version number for the agent software, or 0.0 if polling type is SNMP |
|
Time zone |
The time zone in which the managed object resides |
Module Browser Tab
The Module Browser tab displays the hierarchy and contents views for managed objects that are monitored through Sun Management Center agents. These objects represent hardware, operating system, local applications, and remote systems.
See Chapter 7, Browsing Information About a Managed Object for detailed information about using the Module Browser tab.
Alarms Tab
The Alarms Details window displays the alarms for the host. For detailed information about using the Sun Management Center Alarm Manager, see Chapter 12, Managing Alarms.
Module Manager Tab
The Module Manager tab displays the loaded modules. This tab also lists those modules that are available to your system but are not currently loaded or scheduled to be loaded. You can perform the following tasks:
-
Unload a module
-
Load a module
-
Edit module parameters
-
Enable a module
-
Disable a module
-
Display module rules
-
Schedule a module for loading at a later time
For detailed information about using the Module Manager tab, see Chapter 11, Managing Modules.
View Logs Tab
The View Logs tab enables you to view several types of messages:
-
System log messages stored in the /var/adm directory
-
Sun Management Center error messages
-
Other messages
By default, only the system log messages in /var/adm are displayed. File names for these system log messages start with the word messages.
If you select the Sun Management Center Log option on the Log File menu, a list of log file choices is displayed.
The View Logs window has two scrollable panes: Messages For and Monitored Messages.
-
The Messages For area contains the filtered messages that you select using the Filter button. You can locate specific messages in this area by using the Find Message feature.
-
The Monitored Messages area contains the messages that you select using the Monitor button. New messages in this field are highlighted.
Note –
If no messages match the Filter criteria, the following message appears at the bottom of the View Logs window.
No matches found for this log file |
Applications Tab
The Applications tab enables you to view and select detailed information about processes running on the selected host or node. If you have any custom or third-party applications installed, this tab also enables you to view detailed information about processes running in the selected applications. The displays are continually updated.
View Processes
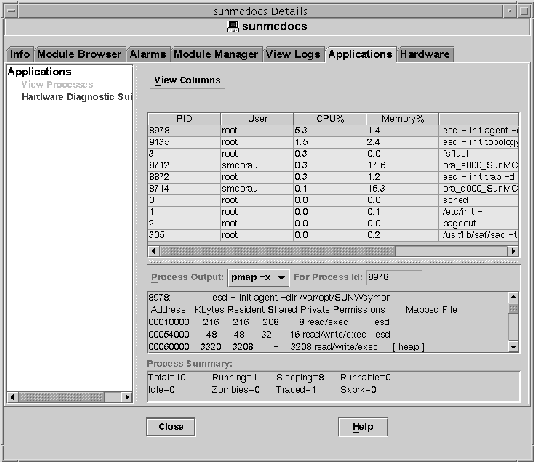
The View Processes application in Figure 6–1 enables you to view and select detailed information about processes running on the selected host or node.
The Solaris Process Details module must be loaded to use the Process Viewer. For instructions, see To Load a Module. If the Solaris Process Details module is not loaded when you click the Applications tab, you must do the following:
-
Close the Details window.
-
Load the Solaris Process Details module.
-
Reopen the Details window.
Figure 6–1 Process Viewer
The following table lists the properties that are available in the Process Viewer.
Table 6–3 Process Viewer Properties|
Property |
Description |
|---|---|
|
Process Identifier |
|
|
Process ID of the parent process |
|
|
Effective user ID number |
|
|
Effective user login name |
|
|
Effective user ID |
|
|
Group ID of the user |
|
|
Effective group ID of the user |
|
|
Process ID of the session leader |
|
|
Process ID of the process group leader |
|
|
Tty |
Terminal that controls the process. A question mark (?) is printed when there is no controlling terminal. |
|
Time that the process started, in hours, minutes, and seconds. The start time for a process that is more than 24 hours old is given in months and days. |
|
|
Cumulative execution time for the process |
|
|
State of the process |
|
|
Address of an event for which the process is sleeping. If blank, the process is running. |
|
|
Scheduling class of the process |
|
|
Memory address of the process |
|
|
Size in pages in main memory for the image of the swappable process |
|
|
Priority of the process |
|
|
Decimal value of the system scheduling priority of the process |
|
|
Ratio of CPU time used recently to CPU time that was available in the same period, expressed as a percentage |
|
|
Ratio of the process's resident set size to the physical memory on the machine, expressed as a percentage |
|
|
Command name |
|
|
Full command name and its arguments, up to a limit of 80 characters |
Process Statistics Window
The Output For Process ID window displays the statistics for either pmap, pstack, pfiles, or pldd for any highlighted process in the Process View window.
- pmap
- pstack
-
Prints a stack trace for each lightweight process (lwp) in each process
- pfiles
-
Reports fstat and fcntl information for all open files in each process
- pldd
-
Prints dynamic libraries for the process
Process Summary Field
The Process Summary field lists statistics for all processes, active or inactive.
Custom or Third-Party Applications
Note –
To develop custom applications, you need the Sun Management Center Developer Environment and documentation. See your Sun authorized sales representative for more information.
If you have any custom or third-party applications installed on your system, they are listed below Applications - View Processes in the left side of the Applications Details window. Select the application if you do not want to view process detail information for a host or node.
After you select an application, the selected properties for the application are displayed in the right side of the Applications Details window. The properties that are shown depend on the application that is selected.
Hardware Tab
Note –
The Hardware tab does not appear if this feature is not supported on your system.
The Hardware Details window, which is shown in Figure 6–2, provides three choices for system information:
-
Hardware Summary
-
Physical View
-
Logical View
Note –
For additional information about the Hardware tab for your specific hardware object, see your platform supplement.
Figure 6–2 Hardware Details Window
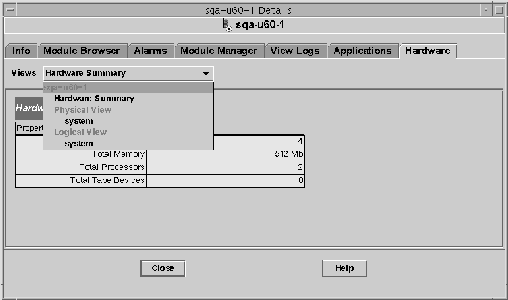
The Views menu provides access to the available hardware information.
Hardware Summary
The Sun Management Center software displays a table of hardware resources of the selected host. The following list shows some typical values displayed in the Hardware Summary.
- Total Disks
- Total Memory
- Total Processors
- Total Tape Devices
-
Total number of tape devices that are connected to the host
Your summary might appear different. The resources vary, depending on the type of object that is displayed in the detail view.
Note –
The Total Disks field displays the number of internal disks only. This number does not include the disks that are part of enclosures.
Physical View
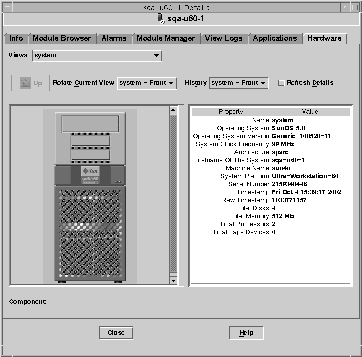
When you select the Physical view - system option, the software displays a photo-realistic picture of the selected host, if available. Pictures are not available for some system types.
Note –
This feature is usable only if the host is monitored by a Sun Management Center agent.
As you move the mouse pointer over the picture of the system being viewed, some of the components are highlighted. The detailed component information displays in the right section of the viewing window. The path name of the component is displayed in the Component field at the bottom of the window.
If a component has an alarm, a colored line appears around the component to indicate the alarm severity. This line enables you to identify quickly the faulty component.
Figure 6–3 Hardware Configuration Physical View With Component Details (Property/Value View)
Rotate Current View Menu
For some systems, you can select alternate front, rear, and side views through the Rotate Current View pull-down menu. Pictures are not available for some system types.
For some systems, pictures of components such as CPU boards and I/O boards might also be available. As you move the mouse pointer over the system picture, the pointer changes from an arrow to a hand icon when there is an individual component picture.
Click a highlighted component to display the detailed picture of the component. When you are finished viewing component details, click Up to return to the parent system view.
Physical View When a Sun StorEdge Device is Connected
If a Sun StorEdge™ A5000, A5100, A5200, or T3 system is connected to the selected component, the Views pull-down menu lists the devices that are connected. The connected devices are listed under the system to which they are connected. The Sun StorEdge A5000-series devices are displayed on this menu as sena(0), sena(1), and so on.
You can select and view any of these storage devices from the Views menu.
History Menu
Use the History pull-down menu to revisit a view that you had selected previously.
Refresh Details Button
Click the Refresh Details button to update the Property/Value information in the right side of the Details window for the selected physical component. Otherwise, the information does not change from when you first opened the physical view.
Dynamic Reconfiguration Button
The Dynamic Reconfiguration button appears in the physical view and in the logical view only for certain platforms. Refer to your hardware supplement for more information.
Logical View
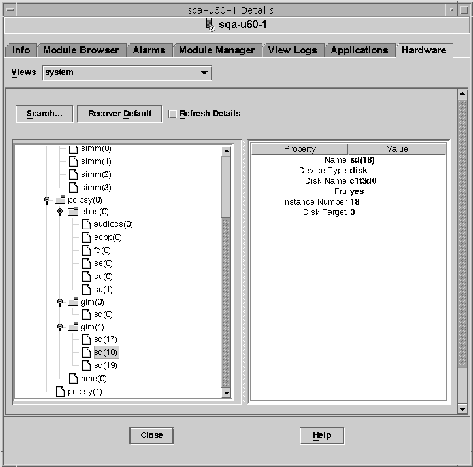
The software displays a logical view configuration of a host, if the host is monitored by a Sun Management Center agent, as illustrated in the following figure. Logical views are not available for ping hosts.
Figure 6–4 Hardware Configuration Logical View
Search Button
Click the Search button to display the Search window. Use the Search window to search for components in the Logical View topology on the left side of the viewing window. The located component is highlighted in the topology view. The name of the component displays in the Component field in the bottom right section of the screen.
The Search function is case-sensitive. If the search does not locate the component in your system, the following error message appears at the bottom of the Details window.
Node not found |
The Search function stops at the first instance found. For example, if you enter the word board, Search always stops at board(0). To find the next hit, click the Next button. To find a specific instance of a name, type a more complete name. For example, board(2).
Expand All
Click the Expand All/Recover Default button to decompress and recompress all the component icons in the topology area (left side) of the window. The compressed view is shown in the following figure.
Figure 6–5 Compressed Topology of Components in Logical View
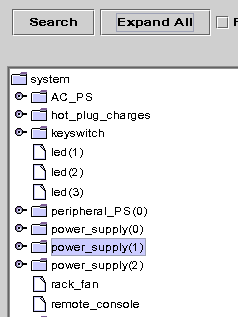
Press the Expand All button to display the expanded topology view, as shown in the following figure.
Figure 6–6 Expanded Topology of Components in Logical View
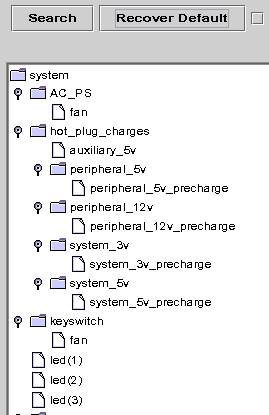
The button label toggles to Recover Default. When you press Recover Default, the topology recompresses all the component icons in the topology area of the window.
Refresh Details and Dynamic Reconfiguration
The Refresh Details and Dynamic Reconfiguration features in the Logical View are the same as the features described for the Physical View in Refresh Details Button and Dynamic Reconfiguration Button.
- © 2010, Oracle Corporation and/or its affiliates
