 To Create a Graph of a Monitored Data Property
-
Press mouse button 3 in any table cell that contains a data property, and choose Open Graph from the pop-up menu.
-
Select the desired data property, and click the Graph button at the top of the Details window.
From the Details window, display the Graphing window in either of the following ways:
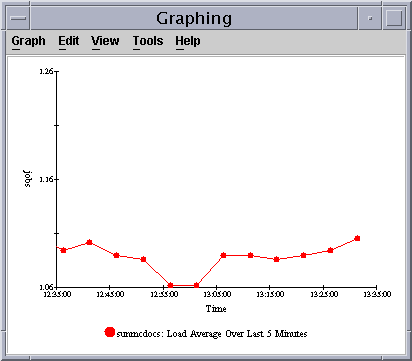
The Graphing window opens. The values of the property are plotted as a function of time. The plotting is dynamic. Values continue to be plotted even if you minimize the Graphing window. Plotting stops, however, if the window is closed.
The following figure shows a typical Graphing window.
Figure 9–1 Graph of System Load Statistics Average Over the Last Five Minutes

- © 2010, Oracle Corporation and/or its affiliates
