| C H A P T E R 6 |
|
Graphs and Gauges |
The Sun MAT software can graphically display some of the data it collects from the regions it is monitoring. Data can be displayed as a graph or a gauge.
Graphs are time-based displays of one or more datapoints.
1. On the Sun MAT main window menu bar, choose Chart.
The drop-down menu contains two items, New Graph and New Gauge.
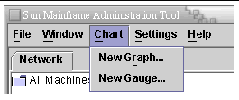
2. From the drop-down menu, choose New Graph.
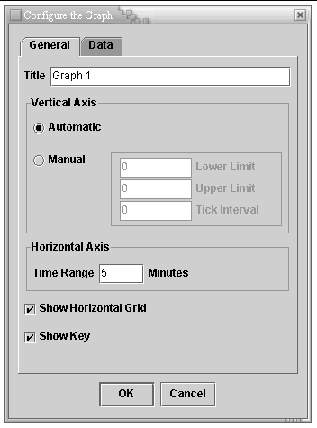
The Configure the Graph dialog box is displayed. It has two tabs: General and Data.
|
Note - The Configure the Graph dialog can also be displayed by selecting Graph |
3. On the General tab, set the display values for the graph.
These values remain in force for all graphs until you change them.
a. In the Title field, type the name of the graph.
b. In the Vertical Axis area, select either Automatic or Manual.
c. In the Horizontal Axis area, type the time period in minutes that will be displayed on the graph.
d. Select whether to display a horizontal grid on the graph.
e. Select whether to display the key for the graph.
4. Click the Data tab to display its contents.
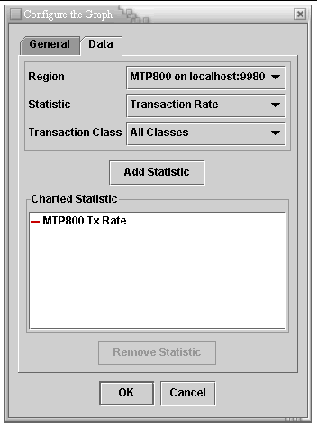
The Data tab is used to specify the statistics that will be graphed from the available regions. When you configure a graph for the first time, the Charted Statistic area is empty. See FIGURE 6-3.
5. On the Data tab, choose the data you want to graph:
a. Click the drop-down arrow to select a region.
The region drop-down list shows all of the regions that are currently being monitored.
b. Click the drop-down arrow to select a statistic.
You can choose Transaction Rate, Active Tasks, Users, or Transactions Waiting from the list.
c. Click the drop-down arrow to select a transaction class defined in the region or to select all transaction classes.
6. Click the Add Statistic button to add the data statistic you just defined to the Charted Statistic list.
To remove a statistic, select it, and click the Remove Statistic button.
7. Repeat steps 5 and 6 to add other statistics to your graph.
8. Click OK to commit the changes you made to the configuration window and display the graph.
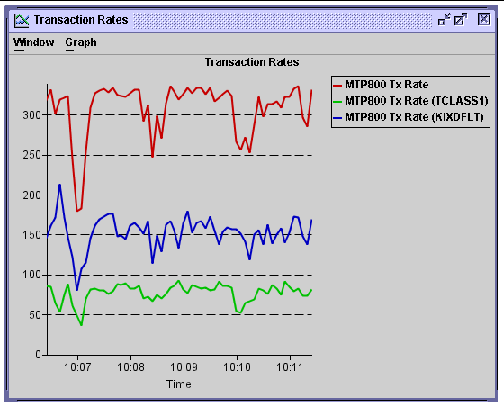
See FIGURE 6-4 for an example of a graph.
The following figure shows a graph of transaction rates for the MTP800 region over a five-minute period. The graph displays the overall transaction rate and the transaction rates for the TCLASS1 and KIXDFLT transaction classes.
The graph window menu has two items: Window and Graph, which have the following options:
As you make changes in the Configure the Graph dialog, the changes are dynamically displayed on the graph window. If you click OK, the changes are committed. If you press Cancel, all changes made in the current configuration session are backed out.
A gauge is a dynamic display of one or more datapoints that is not time-based.
1. On the Sun MAT main window menu bar, choose Chart.
The drop-down menu contains two items, New Graph and New Gauge.
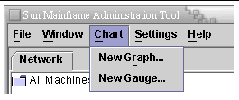
2. From the drop-down menu, choose New Gauge.
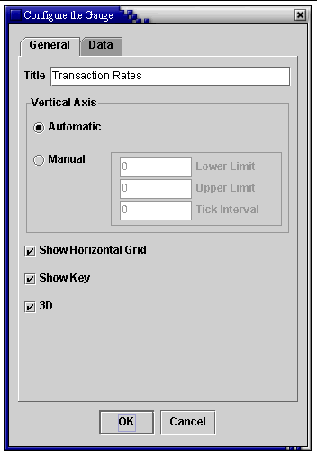
The Configure Gauge dialog box is displayed. It has two tabs: General and Data.
|
Note - The Configure the Gauge dialog can also be displayed by selecting Gauge |
3. On the General tab, set the display values for the gauge.
These values remain in force for all gauges until you change them.
a. In the Title field, type the name of the gauge.
b. In the Vertical Axis area, select either Automatic or Manual.
c. Select whether to display a horizontal grid on the gauge.
d. Select whether to display the key for the gauge.
e. Select whether to display the gauge three-dimensionally (3D check box).
4. Click the Data tab to display its contents.
The Data tab is used to specify the statistics that will be displayed from the available regions. When you configure a gauge for the first time, the Charted Statistic area is empty.
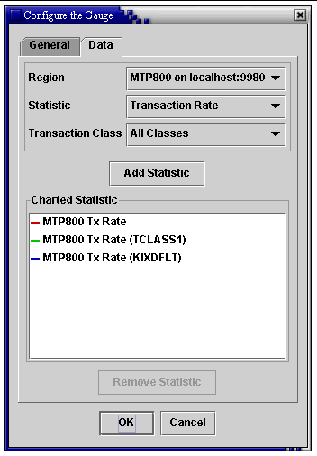
5. On the Data tab, choose the data you want to display:
a. Click the drop-down arrow to select a region.
The region drop-down list shows all of the regions that are currently being monitored.
b. Click the drop-down arrow to select a statistic.
You can choose Transaction Rate, Active Tasks, Users, or Transactions Waiting from the list.
c. Click the drop-down arrow to select a transaction class defined in the region or to select all transaction classes.
6. Click the Add Statistic button to add the data statistic you just defined to the Charted Statistic list.
To remove a statistic, select it, and click the Remove Statistic button.
7. Repeat steps 5 and 6 to add other statistics to your gauge.
8. Click OK to commit the changes you made to the configuration dialog and display the gauge.
See FIGURE 6-8 for an example of a gauge.
The following figure shows a 3D gauge of transaction rates for the MTP800 region. The gauge displays the overall transaction rate and the transaction rates for the TCLASS1 and KIXDFLT transaction classes.
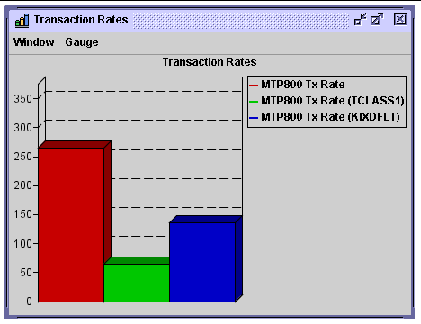
The gauge window menu has two items: Window and Gauge, which have the following options:
As you make changes in the Configure the Gauge dialog, the changes are dynamically displayed on the gauge window. If you click OK, the changes are committed. If you press Cancel, all changes made in the current configuration session are backed out.
Copyright © 2004, Sun Microsystems, Inc. All rights reserved.