Table of Contents
MySQL Enterprise subscription, MySQL Enterprise Monitor, MySQL Replication Monitor, and MySQL Query Analyzer are only available to commercial customers. To learn more, see: http://www.mysql.com/products/enterprise/features.html.
MySQL Enterprise Advisors are a series of scripts that gather information from your MySQL servers using the Service Manager and the Monitor Agents, analyze that information based on custom rules developed by MySQL AB, and then offer alerts and advice when necessary. As new rules are introduced, the MySQL Enterprise Advisors can be updated through the MySQL Enterprise website.
The MySQL Enterprise Advisors fall into the following categories:
Administration
Better manage databases
Suggest improvements for smoother operation
Heat Chart
Drive the status indicators in the Heat Chart
Identify up/down status and performance issues
Performance
Identify potential performance bottlenecks
Make suggestions for improved database speed
Replication
Identify replication bottlenecks
Improve replication design
Schema
Identify schema changes
Find security loopholes
Security
Protect MySQL servers
Find security loopholes
An advisor category provides a set of rules designed to enforce MySQL best practices for that specific category. Rules can be targeted to run at the individual server or group level and, upon rule violation, provide alerts and expert advice on how to address and correct a problem before it becomes a costly outage.
Individual rules are defined in the
items-mysql-monitor.xml file. On Windows this
file is found in the C:\Program
Files\mySQL\Enterprise\Agent\share\mysql-monitor-agent
directory and on Unix in the
/opt/mysql/enterprise/agent/share/mysql-monitor-agent
directory. Find below the rule for discovering a
root account with no password.
<ITEM>
  <NAME>no_root_password</NAME>
  <FIELD>no_password</FIELD>
  <SCOPE>table</SCOPE>
  <CODE>
    <![CDATA[SELECT COUNT(*) AS no_password FROM mysql.user WHERE user='root' AND password='']]>
  </CODE>
  <NAMESPACE>mysql</NAMESPACE>
  <RETURNS>INTEGER</RETURNS>
  <SOURCE>table</SOURCE>
  <INSTANCE>mysql.user</INSTANCE>
</ITEM>
Your MySQL Enterprise subscription level determines which rules are available to you. Subscription levels are cumulative, meaning that higher MySQL Enterprise levels have access to all the rules of the lower levels.
When the Dashboard is first installed, the only rules that are
scheduled are those that belong to the Heat Chart
group.
Go to the Advisors screen by logging in to the Dashboard and
choosing the Advisors tab.
Instructions for installing Advisors are given in Section 2.2.7.3, “Installing Advisors After Initial Log-in”, and following. Principally, you need to configure your MySQL Enterprise login or enter your product key before you can update your Advisors.
If your MySQL Enterprise login is configured, you can download
the latest Advisors by navigating to the
Advisors page and finding the Check
for Updates link. You can periodically update advisors
in this way.
If you do not have Internet access and cannot use the online update option you can manually import advisors. This process is described in Section 2.2.7.3, “Installing Advisors After Initial Log-in”.
Once the MySQL Enterprise Advisors have been installed, you can configure which advisors you would like to run on a scheduled basis.
You can schedule rules by individual server or by group. This is
done by first selecting the desired server or server group from
the Server tree found on the left side of the
screen. Next select the Advisors tab.
Opening the Advisors tab takes you to the
Current Schedule page. If you have only just
installed the MySQL Enterprise Monitor then you will only see the Heat
Chart group of advisors. Clicking the
button will show all the rules in the
Heat Chart group.
Clicking the button beside any specific
rule will show the servers that this rule is running on, its
frequency, and its status. Initially, all the Heat
Chart rules are enabled.
For a more complete description of a rule, click the rule's name. This opens a dialog box that gives detailed information about the rule.
To view the advisors other than the Heat Chart group, select the
Add to Schedule link. This will show all the
advisors available for your subscription level.
Rules are grouped by functionality and displayed in alphabetic order. To expand a group click the button to the left of the advisor name.
You may activate all the rules in a group by selecting the
checkbox beside the group name. Once selected you may apply rules
against a specific server or a group of servers. A message showing
the group of servers or the specific server you have selected will
display immediately below the
button. For example, if the All Servers group
is selected in the server tree, then the message will read,
“Schedule Advisors Against All
Servers”.
To select a specific rule, expand the group tree by clicking the button. Select the checkbox to the left of the rule you wish to schedule. Click to display the following dialog box:
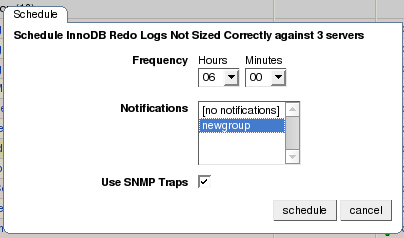
The Schedule dialog box allows you to configure the following fields:
Frequency: Dictates how often the rule will run. The default value for different rules varies but a rule can be set to run at any interval desired.WarningSetting the frequency of a rule involves tradeoffs. Rule evaluation consumes system resources—CPU, memory, and disk space. While the amount consumed is small, if you run all the rules against dozens of servers on a very frequent basis, you may put a significant load on the Service Manager. So select an appropriate frequency. For example, unless you are stopping and restarting your servers frequently, rules that check server configuration variables probably don't need to run very often.
Another consideration is that certain status variables increase monotonically until a server is restarted. Examples of these are
Key_reads,Qcache_hits,Questions,Table_locks_waited, and similar variables. The value returned bySHOW STATUSfor these variables is the value since the server was started (or since the lastFLUSH STATUScommand), which is not very useful for performance tuning, especially if the server has been running for an extended period of time. For performance tuning it is much better to know the change in state (for example, delta) of these values over the last 10 minutes, 1 hour, or whatever time frame is appropriate for your application. The frequency at which you schedule a rule is the time frame used to calculate the delta values of these variables, and it is the delta that is used in expression evaluation, not the absolute value. Consequently, select a frequency that is appropriate for the metrics being used in the expression.Notifications: A listbox of users, notification groups, or both who will be emailed when an advisor reaches an alert level. Single or multiple selections are allowed. For instructions on setting up notification groups see, Section 4.5, “Manage Notification Groups”.
Set the frequency, identify whomever you wish to notify, and click
to schedule the advisor. Upon
completion, you should see the message, Successfully
scheduled.
If you haven't set up global SNMP traps and would like your
Network Management System (NMS) to handle events related to a
specific rule then check the Use SNMP Traps
checkbox. For more information about Simple Network Management
Protocol (SNMP) see Simple Network
Management Protocol (SNMP) Traps.
Scheduling rules using the checkbox and the
button is an effective way to
schedule multiple rules. To schedule a single rule you may also
use the schedule link.
When scheduling more than one rule, you have the option of selecting a checkbox to use the default frequency of each rule or you may choose a frequency that will apply to all selected rules. When customizing the frequency, take care that you choose a value that is appropriate to all the rules selected.
If the agent does not have the SUPER
privilege and InnoDB-related rules are scheduled, a warning will
appear in the DataCollection log. This also
occurs if mysqld is started with the
skip-innodb option. For more information about
agent rights see Section 2.3.1, “Creating a MySQL User Account for the Monitor Agent”.
It is particularly important that
Notifications be set for the Heat
Chart group of rules. This is easily done from the
Current Schedule page by clicking the
button beside a rule and then clicking
a server.
Doing this opens a window with three
tabs—Overview,
Settings, and Advanced.
The Overview tab shows which advisor group a
rule belongs to, a description of its purpose, and a link to the
history of this alert.
In the Settings tab you can adjust the
frequency of this rule and also specify a notification group. To
select more than one contiguous group press the
Shift key and click the desired groups. (Some
web browsers may require that you drag your selection.)
Noncontiguous selections are made by holding down the
Control key and clicking the desired groups.
If you haven't set up global SNMP traps and would like your
Network Management System (NMS) to handle events related to a
specific rule then check the Use SNMP Traps
checkbox. For more information about Simple Network Management
Protocol (SNMP) see Simple
Network Management Protocol (SNMP) Traps.
The Advanced tab gives detailed information
about how this rule is implemented.
The frequency and thresholds defined for a rule are default
recommendations. To edit these properties choose the
Create/Edit Rule link.
The following image shows the screen used to edit rules:
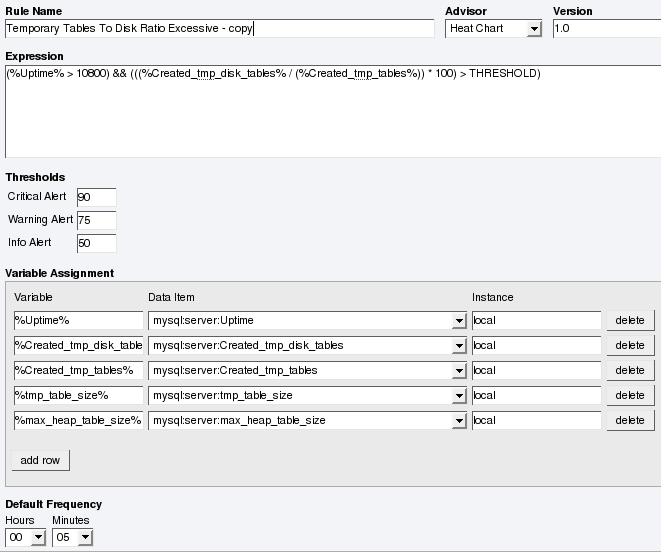
Beside the rule name is the Advisor drop-down
list box, used for setting the advisor group. This list box shows
existing groupings and any you may have added. The
Expression textarea shows the advisor rule,
Variable Assignment the data item associated
with variable(s) used in the rule and
Thresholds determines when to trigger each
alert type.
The three levels of Thresholds are
Info Alert, Warning Alert,
and Critical Alert indicating increasing levels
of severity. Levels can be triggered by the expression result
being equal to a certain value, greater than a certain value, or
less than a certain value.
The data items that variables are associated with are operating
system (OS) properties such as available RAM or MySQL
characteristics such as the InnoDB buffer pool. To see all
available data items drop down the Data Item
list box. For a listing of these data items see
Appendix G, Data Collection Items.
In Figure 5.2, “MySQL Enterprise Dashboard: Editing Rules” the drop-down
Data Item list box within the Variable
Assignment frame shows the various MySQL server status
or operating system specific variables that may be used in
expressions. The text boxes below Thresholds
define the levels at which informational, warning, or critical
alerts are issued.
To lower the threshold for an informational alert, simply increase
the number given in the Info Alert text box.
When a data item can apply to multiple objects, you need to
specify which instance to use for that item, hence the
Instance text box. In almost all cases this
should be set to local. The exceptions are as
follows:
For CPU-related items set Instance to
cpu0. Additional CPUs on a system are referred to ascpu1, cpu2and so on.There can be multiple disks mounted on a system. To refer to a specific drive set Instance to the name of of the mounted drive. On Windows this would be
C:, D:, and so on. On Unix systems, use whatever is valid for the df command.For RAM-related items set Instance to
mem.Where there are table-specific variables, the database name and table name must be specified in the Instance text box. This topic is discussed in detail in what follows.
It is not possible to have a data item that is unrelated to an
instance. This raises the error, You must map
"<variable>" to an instance, and you will be
unable to save the rule.
An agent can only collect data from one MySQL server, so the
instance entry for a variable in a rule does
not need to specify which MySQL server to use; no matter how many
servers are being monitored there is always a one-to-one
relationship between an agent and its monitored server.
However, on one server there may be multiple occurrences of a
variable. For example, there are multiple possible occurrences of
table-specific variables such as Avg_row_length
because there can be multiple databases and tables defined in a
MySQL server. In this case, the “instance” refers to
the database and table that a data item should be associated with,
specified in the form
databasename.tablename.
So, for example, if you want to reference the
Avg_row_length of the mysql
database user table in an expression, select
the mysql:tablestatus:Avg_row_length from the
Data Item list box and specify
mysql.user in the Instance
text box.
On the other hand, in the case of a global server variable, there
is only one possible target. For example, there can only be one
instance of delay_key_write because this
variable is global and applies to the server as a whole. In this
case specify local in the
Instance text box.
To save your changes click the button at the bottom of the page.
You can change only the thresholds and the frequency of built-in rules. So that rules function properly when updated, other changes are prohibited.
Should you wish to make other changes to a built-in rule, copy it and modify it as desired.
You can edit a rule even if it is currently scheduled. Your
changes will not be overwritten when new rules are imported using
the Check for Updates link.
In addition to using and editing the advisors and rules provided
by MySQL Enterprise, users can create their own advisors and
rules to meet their own unique needs. To do this go to the
Advisors page and choose the
Create/Edit Rule link.
Similar existing rules are grouped together in advisor groups.
The built-in advisors are:
Administration
Heat
      Chart
Performance
Replication
Schema
Security
The ability to create your own advisor group allows you to create groupings suitable to your circumstances.
You can create your own grouping by simply clicking the
button. Enter an
appropriate name and click the
button. The newly created group will appear in the
Advisor column.
The newly created advisor is added to the list box of advisors shown in Figure 5.2, “MySQL Enterprise Dashboard: Editing Rules”. You can now use this category of advisors when you create a new rule.
Rules are created using the same screen seen in Figure 5.2, “MySQL Enterprise Dashboard: Editing Rules”. To begin creating a rule from scratch, click the button. However, the simplest way to create a new rule is to copy an existing one. Unlike editing an existing rule, when you copy a rule, every element of that rule is editable.
You can change the rule name, the advisor group that a rule belongs to and you can set your own version number. In Figure 5.2, “MySQL Enterprise Dashboard: Editing Rules”, you have already seen how the threshold and frequency of a rule may be altered.
Most importantly you can alter a rule's expression. Expressions are the core of a MySQL Enterprise Advisor and are used to define the scenario being monitored. An expression can be as simple as a single server parameter or can be quite complex, combining multiple parameters with various mathematical operations.
An expression has two main characteristics:
An expression defines a situation where a best practice is not being followed
The result of an expression must always be 1 or 0 (that is, true or false)
If an expression evaluates to true for a specific server, an alarm is raised, indicating that a best practice is not being followed. If an expression evaluates to false no alarm is raised because the best practice is indeed being followed.
For example, if having binary logging enabled is considered a
best practice for a production server (which we believe it is),
then this best practice is being violated if
log_bin is OFF.
Consequently, the expression for the “Binary Logging Not
Enabled” rule is “%log_bin% == OFF”. If this
evaluates to 1, an alarm is raised because the best practice is
not being followed.
An expression is made up of one or more variables and zero or more mathematical operators. The MySQL Enterprise Monitor uses the MySQL database server's expression parser and evaluator For a complete list of operators and functions see Functions and Operators. For a complete list of the built-in variables used when creating rules see Server Option and Variable Reference.
Creating an expression is dependent on variables defined in the Variable Assignment frame. This frame links variables used in the expression field with data gathered from the target MySQL server instance—server status variables, operating system status information, and table information. Variable names are associated with elements in the Data Item drop-down list. If you need to define more than one variable simply click the button. For a complete listing of the data collection items used in creating rules see Appendix G, Data Collection Items.
The remaining fields determine the information that displays in a notification email or the informational pop-up window associated with each advisor.
When saving a new rule ensure that you do not duplicate the name of an existing rule.
When an expression is evaluated variables get replaced by values. For example, part of the expression for the “MyISAM Key Cache Has Sub-Optimal Hit Rate” rule calculates the hit rate as follows:
100-((%Key_reads% / %Key_read_requests%)*100)
If the current value of %Key_reads% is 4522
and the current value of %Key_read_requests%
is 125989, the hit ratio assesses to 96.4%:
100 -((4522 / 125989) * 100)
By convention, the Advisors supplied by MySQL use
‘%’ as the delimiter, for
example, %Key_reads%. This makes variables
more readily identifiable.
In addition to being used in an expression, variables may also
be used in the Description,
Advice, Action, and
Links attributes of a rule. This allows you
to report the current value of an expression.
For instance, you can add the message, “The current value
of Key_reads is %Key_reads%.” to the
Advice text box. When this is displayed on
the screen, the value of %Key_reads% is
substituted into the text. Supposing
%Key_reads% has a value of
4522, the message becomes “The current
value of Key_reads is 4522.”
Each expression has a threshold value that triggers an alert.
The THRESHOLD keyword is used to associate
that value with an alert level—either an
Info, Warning, or
Critical alert.
For example, the expression for the performance advisor, “Thread Cache Size May Not Be Optimal”, is:
100-((%Threads_created% / %Connections%) * 100) < THRESHOLD
The THRESHOLD is set at 95% for an Info level
alert, 85% for a Warning alert, and 75% for a Critical alert;
producing alerts of three different levels.
Expressions can be quite simple. The expression for “Binary Logging Not Enabled” (one of the Administration alerts) is:
%log_bin% == THRESHOLD
When the result is OFF, only one alert is
triggered—a Warning level alert. In this situation you
might think we could just use the expression %log_bin%
== "OFF". However, doing this would not test binary
logging against a threshold so would not result in an alert.
When you create an expression, think carefully about the conditions under which it should be evaluated and the conditions under which it should not. For example, the expression for the “MyISAM Key Cache Has Sub-Optimal Hit Rate” rule is:
(%Uptime% > 10800) && (%Key_read_requests% > 10000) » && (100-((%Key_reads% / %Key_read_requests%) * 100) < THRESHOLD)
The essence of the rule is really: (100-((%Key_reads% /
%Key_read_requests% ) * 100) < THRESHOLD). However,
when a server is first starting up, it may take a while to reach
a state that is representative of normal operations. For
example, the key cache and the query cache may need some period
of time before they have cached typical application data as
opposed to start-up and initialization data. In this case, the
first part of the expression, (%Uptime% >
10800), holds off evaluating this expression until the
system has been running for 10800 seconds (3 hours).
In addition, if some part of the system is not heavily used an
alert may be triggered based on limited data. For example, if
your application does not use the MyISAM storage engine, the
“MyISAM Key Cache Has Sub-Optimal Hit Rate” rule
may be triggered based on very limited use of other MyISAM
tables such as the mysql.user table. For this
reason, this advisor has a second part—
(%Key_read_requests% >
10000)—meaning the rule won't be evaluated
unless there is plenty of activity associated with the key
cache.
In other circumstances, there may be periods of time during
which you don't want a rule to be evaluated—a blackout
period. For example, the expression for the “Slave Too Far
Behind Master” rule is: %Seconds_Behind_Master%
> THRESHOLD. However, suppose you run a backup
process between 6 and 7 pm on a replication slave, and it's
normal for that slave to get behind the master by an amount more
than the THRESHOLD during that time. In that case you don't want
to receive an alert because the rule violation is expected. You
can achieve this by adding the following to the expression:
&& CURTIME() NOT BETWEEN '18:00:00' AND '19:00:00' In
essence, this means “don't trigger an alert between
18:00:00 and 19:00:00 (6 pm and 7 pm)”.
String values may appear in the Expression or
the Thresholds text boxes. In both cases,
they must be enclosed within quotation marks. For example, the
expression for the “Slave I/O Thread Not Running”
rule is:
(%Slave_running% == "ON") && (%Slave_IO_Running% != THRESHOLD)
In similar fashion the Critical Alerts
threshold text box is set to a value of
"Yes".
When the expression is evaluated, either
"OFF" or "ON" will be
substituted for %Slave_running%, and
"Yes" or "No" for
%Slave_IO_Running%, depending on the state of
your system. If the slave is running but the I/O thread is not,
the expression then becomes:
("ON" == "ON") && ("No" != "Yes")
Without quotation marks this expression would not evaluate to
TRUE as it should.
So that it is interpreted properly, the ==
operator is converted to = before being
passed to the MySQL expression parser.
When editing or defining a rule, the text entered in the
Problem Description,
Advice, Recommended
Action, and Links and Further
Reading text boxes may be formatted in Wiki format.
This allows you to format text and add hyperlinks when creating
or editing your own rules.
Find a brief introduction to using Wiki formatting in the following table.
Table 5.1. MySQL Enterprise Monitor: Wiki Formatting
| Example | Description |
|---|---|
__bold__ | boldface text |
~~italic~~ | italicize text |
| \\ | create a line break |
| \\ \\ | create a double line break |
\\\\G | create a backslash |
*item 1 | create a bulleted list item |
#item 1 | create a numbered list item |
\_ | use the ‘\’ to escape special characters |
| {moreInfo:name|url} | create a hyperlink |
So the following Wiki text:
Replication is a __very nice feature__ of MySQL. Replication can be very
useful for solving problems in the following areas:
* Data Distribution
* Load Balancing
* Backup and Recovery
You can check replication status and start a slave using the following
commands: SHOW SLAVE STATUS \\\\G\\START SLAVE;
{moreInfo:MySQL Manual: Replication
FAQ|http://dev.mysql.com/doc/refman/5.0/en/replication-faq.html}
Would be translated into the following HTML markup:
Replication is a <b>very nice feature</b> of MySQL. Replication can be very useful for solving problems in the following areas: <ul> <li>Data distribution</li> <li>Load Balancing</li> <li>Backup and recovery</li> </ul>You can check replication status and start a slave with the following commands: SHOW SLAVE STATUS \G;<br/>START SLAVE; <a href="http://dev.mysql.com/doc/refman/5.0/en/replication-faq.html" target="_blank" >MySQL Manual: Replication FAQ</a>
To find out more about this format go to the wikipedia.org web site.
This section documents the steps required to create a rule. Before attempting to create a rule, please review the preceding sections of this chapter.
This example creates a rule that checks the number of rows in a table. Having 50,000 rows in this table is deemed to warrant a critical alert. Lesser numbers are assigned to informational and warning level alerts.
Begin by navigating to the Advisors tab and
clicking the manage rules link. Then choose
the button.
Create your custom rule by following these steps:
Using the
Rule Nametext box, give the rule an appropriate name. Something such as "Excessive number of records intable_nametable", may be appropriate.From the
Advisordrop down list box choose an advisor group for your rule. TheAdministrationgroup of rules might be suitable but if you wish, create your own group of advisors. For instructions on doing this see Section 5.4.1, “Creating Advisors”.Enter the following expression in the Expression text area: '%
table_name_num_rows% > THRESHOLD'. Replacetable_namewith the name of the table you wish to monitor. Note that the variable%has not yet been defined.table_name_num_rows%Set the Thresholds.
Set the
Critical Alertlevel to50000.Set the
Warning Alertlevel to10000.Set the
Info Alertlevel to5000.
Define your variable in the
Variable Assignmentframe.In the
Variabletext box enter'%, the variable used in thetable_name_num_rows%Expressiontext boxIn the
Data Itemdrop down list box find and select themysql:table:numrowsentry. (For a description of all the data items available see Appendix G, Data Collection Items.)In the
Instancetext box enterdatabase_name.table_name.
Add appropriate entries for the
Problem
              Description
, theAdvice, and theLinkstext areas. If you wish, use Wiki markup for these text areas. See Section 5.4.6, “Wiki Format” for more information. Note that you can also reference the'%variable in these text areas. For example, you can display the current number of rows with a message such as 'table_name_num_rows%table_namecurrently has %table_name_num_rows% rows.'Save the rule.
Once the rule is created it needs to be scheduled against the server that contains the database table you wish to monitor. For instructions on scheduling rules see Section 5.2, “Scheduling Rules”.
Section 5.4.7, “Creating a New Rule: An Example” shows how to create a custom rule and Appendix G, Data Collection Items shows the data items that can be used in rule creation. However, in some circumstances you may want to create a rule that uses a custom data collection item.
This section describes how to create a custom data collection item. The steps are as follows:
Create an XML file to define how the data is collected.
Point the agent configuration file to this XML file.
Restart the agent.
As an example, this section shows how to create a data item for monitoring the amount of free InnoDB tablespace. The format and content of the XML file that defines the data to be collected is as follows:
<?xml version="1.0" encoding="utf-8"?>
<classes>
  <class>
    <namespace>mysql</namespace>
    <classname>innodb_min_free</classname>
    <query><![CDATA[SELECT MIN(substring_index(substring_index(table_comment," ",3)," ",-1)/1024/1024)
      as Free FROM INFORMATION_SCHEMA.TABLES WHERE engine = 'InnoDB']]></query>
  </class>
</classes>
The above works in MySQL 5.1.23 and earlier. For MySQL 5.1.24
and later, the information is reported within the
data_Free column, and would need to be
declared as:
<?xml version="1.0" encoding="utf-8"?>
<classes>
  <class>
    <namespace>mysql</namespace>
    <classname>innodb_min_free</classname>
    <query><![CDATA[SELECT MIN(data_free/1024/1024)
      as Free FROM INFORMATION_SCHEMA.TABLES WHERE engine = 'InnoDB']]></query>
  </class>
</classes>
Save this file as:
Windows:
C:\Program
              Files\MySQL\Enterprise\Agent\share\mysql-proxy\items\innodb_min_free.xml
Unix:
/opt/mysql/enterprise/agent/share/mysql-proxy/items/innodb_min_free.xmlMac OS X:
/Applications/mysql/enterprise/agent/share/mysql-proxy/items/innodb_min_free.xml
After saving this file, you must point your
mysql-monitor-agent.ini file to it. ( For
the location of this file on your operating system see
Section 2.3.6.1, “MySQL Enterprise Monitor Agent (mysql-monitor-agent.ini)
Configuration”.) Find the
[mysql-proxy] section and add the file name
innodb_min_free.xml to the
item-files parameter using a semi-colon as
a separator. For example:
[mysql-proxy]
 ...
item-files = items-mysql-monitor.xml,innodb_min_free.xml
 ...
For this change to take effect you must restart the agent. To do this see:
Once the agent has restarted, you will find the new data item
in the Data Item drop down list box on the
Rule Definition page. Its fully qualified
name is mysql:table:innodb_min_free.
In some circumstances you may no longer wish to apply a rule against a specific server or group of servers and in other circumstances you may want to suspend a rule for a short length of time. With this in mind, it is possible to disable or unschedule a rule.
To disable or unschedule an advisor choose the Current
Schedule screen of the Advisors tab.
Rules may be disabled or unscheduled using the buttons on the
upper or lower left of the screen. You may also change a rule by
clicking the enabled or
unschedule hyperlink to the right of a rule.
The buttons are particularly useful when you are altering more
than one rule.
To no longer run a rule against a specific server, expand the
advisor group and the specific rule by clicking the
button. You may then click the
button. When the dialog window
opens, choose the button and
that rule will no longer be applied. If you wish to back out of
the operation choose . If, at a later
date, you wish to institute this rule again, you may do so from
the Add to Schedule page.
If you want to suspend a rule temporarily, use the
button and follow the same process
you would for unscheduling. Once a rule is disabled the link under
the status column changes to red and reads
disabled. When a rule is disabled, data is no
longer collected for that rule. A disabled rule is easily
re-enabled by clicking the disabled link or by
using the button.
Multiple rules may be altered for one or more servers by selecting the appropriate checkbox and then clicking the , , or button.
Rules associated with the heat chart cannot be disabled or unscheduled as they are required by MySQL Enterprise Monitor.
Database servers require regular maintenance and during these periods you may wish to stop Monitor Agents from reporting their findings. During a blackout period rules are not evaluated and notifications are put on hold but Monitor Agents continue to collect data . In this respect blacked-out rules differ from disabled rules; data continues to be collected and stored in the repository.
Blackout periods are enabled by entering the following URL into the address bar of your browser, substituting the appropriate host name, port and server name:
http://localhost:18080/rest?command=blackout »
 &server_name=SuSE:3306&blackout_state=true
If you are unsure of the host name and port to use, check the
configuration_report.txt file. Be sure to
specify the correct port for the Tomcat server. Specify the server
you wish to blackout using the name that appears in the Server
Tree, being sure to include a colon and port number as shown in
the preceding example.
An HTTP authentication dialog box requesting your Dashboard user
name and password will open. Specify the administrator's
credentials. The default user name is admin;
use the password you specified when you initially logged in to the
Dashboard.
You can also blackout a server group by entering the following URL into the address bar of your browser, substituting the appropriate host name, and server group name:
http://localhost:18080/rest?command=blackout »
 &group_name=Finance&blackout_state=true
When the HTTP authentication dialog box opens, enter the administrator's credentials.
You can confirm that a server is blacked out by looking at the server name in the Dashboard; the name of a blacked out server is greyed.
To reactivate the blacked-out server or server group, use the
appropriate URL and query string, changing the
blackout_state=true name/value pair to
blackout_state=false. Again, this must be done
by a user with administrative privileges.
Restarting MySQL Enterprise Monitor will not reactivate a blacked out server.
Rather than opening your web browser and blacking out a server by typing entries into the address bar, you can write a script to achieve the same effect. This section documents a sample blackout script that can be run from the command line.
Create the following file and save it as
blackout.pl.
  #!/usr/bin/perl

  use LWP 5.64;

  # USAGE: blackout.pl servicemanager:18080 admin password servername:3306 true

  # $ARGV[0] = management server hostname:port
  # $ARGV[1] = management server username
  # $ARGV[2] = management server password
  # $ARGV[3] = mysqld managed instance server name and port
  # $ARGV[4] = blackout state (true/false)


  my $browser = LWP::UserAgent->new;
  $browser->credentials(
    $ARGV[0],
    '',
    $ARGV[1],
    $ARGV[2]
  );

  my $url = URI->new('http://'.$ARGV[0].'/rest');

  $url->query_form( # And here the form data pairs:
    'command' => 'blackout',
    'server_name' => $ARGV[3],
    'blackout_state' => $ARGV[4]
  );

  my $response = $browser->post( $url );

  if (!$response->is_success) {
    die $response->status_line . "\n";
  }
Windows users can omit the shebang line.
On Unix systems use the chmod +x blackout.pl command to make the file executable.
At the command line enter blackout.pl
.
servicemanager:18080 admin
password servername:3306
true
If you are unsure of the host name and port to use, check the
configuration_report.txt file. Be sure to
specify the correct port for the Tomcat server. Specify the
server you wish to blackout using the name that appears in the
Server Tree, being sure to include a colon and port number as
shown in the preceding example. Make sure that the user you
specify is a "manager". Specifying a user with "dba" rights only
will not black out a server and no error will be displayed.
You can confirm that a server is blacked out by looking at the
server name in the Dashboard; the name of a blacked out server
is greyed. To end the blackout, run the same script, changing
the final argument to false.
Restarting MySQL Enterprise Monitor will not reactivate a blacked out server.