Table of Contents
MySQL Enterprise subscription, MySQL Enterprise Monitor, MySQL Replication Monitor, and MySQL Query Analyzer are only available to commercial customers. To learn more, see: http://www.mysql.com/products/enterprise/features.html.
The MySQL Enterprise Monitor serves as an automated assistant for MySQL database administrators. This service is designed to help administrators with their day-to-day tasks by monitoring MySQL servers and identifying potential problems. These features are designed to save the database administrator's time and effort by providing the information you need through a simplified interface.
An extension of existing MySQL Enterprise services, MySQL Enterprise Monitor monitors enterprise database environments and provides expert advice on how customers can tighten security and optimize the performance and uptime of their MySQL servers.
MySQL Enterprise Monitor helps administrators:
Intelligently stay up to date with releases and bug fixes.
Know what's going on with their system.
Manage day-to-day database maintenance tasks.
Improve the performance of their system.
Manage and prevent crises.
The MySQL Enterprise Monitor was designed to tackle the job of managing the performance of any number of MySQL database servers, regardless of their physical or geographical location. Although MySQL Enterprise Monitor can easily track just a handful of MySQL servers, the service is specifically designed to greatly curtail the time it takes to get a handle on the availability and performance levels of many database servers at once.
The MySQL Enterprise Monitor does this by providing an web-based interface—called the Enterprise Dashboard—that serves as the portal for viewing information about your MySQL database servers. MySQL professionals can manage all their servers by group or individually if need be.
The Enterprise Dashboard web interface does not have to be installed on individual desktops, but is instead available from a centrally located machine that serves as the main location for the Monitoring and Advisory service.
The MySQL Enterprise Monitor is a collection of components that work together to monitor and help administer your MySQL server installations. This service includes server management agents, advisors, and a central MySQL Enterprise Service Manager, all working in tandem with the MySQL Enterprise to keep your MySQL servers secure and up to date. All of this is controlled through the MySQL Enterprise Dashboard—a lightweight web-based interface that gives you complete control of your MySQL servers from any location.
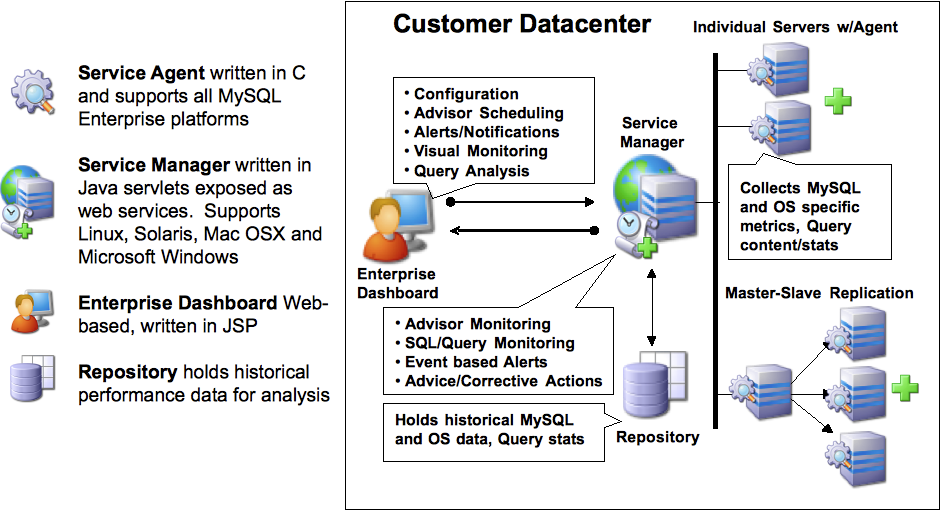
The service is made up of a number of components, including the Monitor Agent (MySQL Enterprise Monitor Agent), the Service Manager (MySQL Enterprise Service Manager), the Enterprise Dashboard, the Repository and the Advisors.
The MySQL Enterprise Monitor is powered by a distributed web-based application that is deployed within the confines of the corporate firewall. The Enterprise Dashboard provides the interface to the server data, advisor notifications, live information and communication with the MySQL Enterprise Update Service.
Subscribers are kept up to date about the latest releases of the MySQL server or issues that may affect their specific implementation of MySQL by using the MySQL Enterprise Update Service. This same mechanism is used to notify MySQL Enterprise Monitor users of updates to the application or to the MySQL Advisors and Rules. The various components are described below.
Monitor Agent
Monitor Agents are the foot soldiers of the MySQL Enterprise Monitor; they monitor each MySQL server. Running as a Windows service or Unix daemon, the Agent uses a combination of MySQL specific commands, SQL queries, and custom scripts to collect and report MySQL server or operating system (OS) specific data. The Monitor Agent initiates a “heartbeat” to the Service Manager on a regular basis to ensure specific MySQL server and OS level data collections are current.
In the overall architecture, the Monitor Agent is the only component of the MySQL Enterprise Monitor that establishes or maintains a connection with the monitored MySQL Server. As with any MySQL client, the Monitor Agent is authenticated on the monitored MySQL server and requires a user name and password to establish a connection.
In addition, the MySQL Enterprise Monitor Agent also provides a proxy service that allows for information about queries to be captured and reported as part of the Query Analyzer functionality. The MySQL Enterprise Monitor Agent accepts client connections and forwards the SQL statements on to the server and returns the results. In the background, the agent is collecting information about the query execution, row counts, times and other data so that queries and their execution can be monitored.
Service Manager
The Service Manager is the heart and soul of the MySQL Enterprise Monitor. It is built on a collection of Java services hosted on a single Windows or Unix server. The Service Manager interacts with all of the Monitor Agents under its domain to collect MySQL server and OS level data for each of the monitored MySQL servers.
The Service Manager performs many duties including:
Enterprise Dashboard, the main interface to the MySQL Enterprise Service Manager.
Autodiscovery of monitored MySQL Servers.
Creation and management of Monitor Agent tasks.
Storage of data collections from Monitor Agents.
Monitoring of key MySQL server and OS level metric data collections.
Reporting MySQL best practice events and violations.
Providing MySQL expert advice for MySQL best practice violations.
Autodiscovery of replication topology (Not available for all subscription levels)
The Repository
The Repository is built on MySQL 5.0.
xand is used to store MySQL server and OS level data collections for each of the monitored MySQL Servers. This information is used by the Service Manager to evaluate and report the health and status of the monitored MySQL environment(s).The Enterprise Dashboard
The MySQL Enterprise web client provides the graphical user interface (GUI) for the MySQL Enterprise Monitor. This interface is the primary means of monitoring the state of your MySQL servers, identifying rule violations and providing advice on how best to address and correct any underlying issues.
This interface also provides an easy means of configuring advisors, adding users, creating notification groups, and receiving updates from MySQL Enterprise.
The key features of the MySQL Enterprise Monitor can be summarized as follows:
Group-level or Server-level management options
Enterprise Dashboard for managing all MySQL Servers from a consolidated console
Monitoring page for “at a glance” global health check of key systems
MySQL-provided Advisors and Advisor Rules for enforcing MySQL Best Practices
Advisor Rule Scheduling for unattended operations
Customizable Thresholds and Alerts for identifying Advisor Rule violations
User-Defined Advisor Rules
Event/Alert History browser for researching advisor-specific events and annotations
Query Analyzer functionality allowing you to monitor the execution times, row counts and other data about queries executed on your MySQL server.
These features are presented through the MySQL Enterprise Dashboard which is made up of six main pages:
The Monitor page comprises:
The Server Tree: Easily navigate monitored servers
The Graphing: This capability is built in so you can quickly assess critical functions such as activity, performance metrics, and number of connections
The Heat Chart: Color-coded buttons provide key operating system and database metrics
The Advisors page
This page shows the advisors that are currently scheduled. There are advisors for a variety of topics such as security and indexing. Users can add, edit, or create their own advisors.
The Events page
This page shows rule violations, indicating the server, severity, and time of occurrence. A number of filter options are available, allowing various views of events.
The Graphs page
Use this page to view all the available graphs and to adjust the scale of the graphs, for a more or less detailed view as the situation requires.
The Query Analyzer page
The Replication page
Use this page to keep track of your masters and their slaves (Not available for all subscription levels)
The Settings page
On this page you configure servers, users, email addresses, and notification groups. Entering a user name and password for MySQL Enterprise provides automatic updates.
Using the Tomcat/Apache web server for the user interface allows an administrator to configure the web server to meet any security regulations. The MySQL Enterprise Monitor architecture is designed to be as secure as possible, even when monitoring systems outside of the local network.
Communications between the MySQL Enterprise Monitor Agent and MySQL Enterprise Service Manager can be protected by Secure Socket Layer (SSL) encryption and server and agent can use SSL certificates to provide authentication and prevent spoofing.
The MySQL Enterprise Monitor Agent is like a web browser — it is an HTTP client application that initiates all communication with the MySQL Enterprise Service Manager. If the server requires action from the agent, it must wait until the agent next initiates contact and sends its request in a response. This means you do not need to open an inbound port on the machine on which the agent is running because it does not listen for requests. However, an outbound port must be open for the agent to contact the MySQL Enterprise Service Manager.
As an additional security feature, each Agent can have a separate Advisory Service login which minimizes exposure should any one agent be compromised.
This document uses certain typographical conventions:
Text in this styleis used for SQL statements; database, table, and column names; program listings and source code; and environment variables. Example: “To reload the grant tables, use theFLUSH PRIVILEGESstatement.”Text in this styleindicates input that you type in examples.Text in this style indicates the names of executable programs and scripts, examples being mysql (the MySQL command line client program) and mysqld (the MySQL server executable).
Text in this styleis used for variable input for which you should substitute a value of your own choosing.File names and directory names are written like this: “The global
my.cnffile is located in the/etcdirectory.”Character sequences are written like this: “To specify a wildcard, use the ‘
%’ character.”Text in this style is used for emphasis.
Text in this style is used in table headings and to convey especially strong emphasis.
When commands are shown that are meant to be executed from within
a particular program, the prompt shown preceding the command
indicates which command to use. For example,
shell> indicates a command that you execute
from your login shell or from the command line in Windows:
shell> type a shell command here
The “shell” is your command interpreter. On Unix, this is typically a program such as sh, csh, or bash. On Windows, the equivalent program is command.com or cmd.exe, typically run in a console window.
When you enter a command or statement shown in an example, do not type the prompt shown in the example.
Sometimes, what appears on one line in a console window cannot be
represented in the documentation on a single line. In cases such
as this the character ‘»’ is
used. For example:
Please specify the directory where the MySQL Enterprise Monitor »
 will be installed.
Where Unix commands are concerned, the continuation character
‘\’ is used. Doing this allows
commands to be copied and pasted to the command line verbatim. For
example:
shell> /opt/mysql/enterprise/agent/bin/mysql-monitor-agent -f \
 /opt/mysql/enterprise/agent/etc/mysql-monitor-agent.ini
SQL keywords are not case sensitive and may be written in either case. This document uses uppercase.
In syntax descriptions, square brackets
(‘[’ and
‘]’) indicate optional words or
clauses. For example, in the following statement, IF
EXISTS is optional:
DROP TABLE [IF EXISTS] tbl_name
When a syntax element consists of a number of alternatives, the
alternatives are separated by vertical bars
(‘|’). When one member from a set
of choices may be chosen, the alternatives
are listed within square brackets
(‘[’ and
‘]’):
TRIM([[BOTH | LEADING | TRAILING] [remstr] FROM]str)
When one member from a set of choices must be
chosen, the alternatives are listed within braces
(‘{’ and
‘}’):
{DESCRIBE | DESC} tbl_name [col_name | wild]
An ellipsis (...) indicates the omission of a
section of a statement, typically to provide a shorter version of
more complex syntax. For example, INSERT ...
SELECT is shorthand for the form of
INSERT statement that is followed by a
SELECT statement.
An ellipsis can also indicate that the preceding syntax element of
a statement may be repeated. In the following example, multiple
reset_option values may be given, with
each of those after the first preceded by commas:
RESETreset_option[,reset_option] ...
Commands for setting shell variables are shown using Bourne shell
syntax. For example, the sequence to set the CC
environment variable and run the configure
command looks like this in Bourne shell syntax:
shell> CC=gcc ./configure
If you are using csh or tcsh, you must issue commands somewhat differently:
shell>setenv CC gccshell>./configure
Throughout this document the term
‘Unix’ is used to describe any Unix
or Unix-like operating system. For an up-to-date list of operating
systems supported by the MySQL Enterprise Monitor please see the
http://www.mysql.com/products/enterprise/.