| C H A P T E R 5 |
|
System Monitoring and Maintenance Using the WebGUI |
This chapter describes how to use the WebGUI to perform monitoring and maintenance.
It includes the following sections:
Both the ILOM and BIOS firmware are tightly coupled and are always updated together. A single firmware image contains both the ILOM and BIOS firmware.

|
Caution - Shut down your host operating system before proceeding. Otherwise the ILOM will shut the host down ungracefully, which could cause file system corruption. |
|
Note - The upgrade takes about five minutes to complete. During this time, no other tasks can be performed in the ILOM.
|
1. Log in to the ILOM with administrator privileges.
2. Ensure that you can access the new flash image on the client machine that you are using to update the ILOM.
3. If the server OS is running, perform a clean shutdown.
4. From the Maintenance tab, choose Firmware Upgrade.
The Upgrade the Firmware page appears.

|
Caution - Do not close the WebGUI using the Log Out button in the web browser when the ILOM is in Upgrade mode. If you must close the WebGUI, use the WebGUI's Cancel button. |
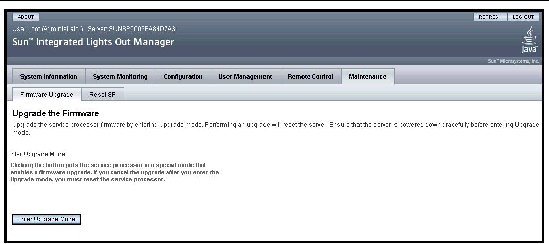
A dialog box appears and asks you to confirm that you want to enter Upgrade mode.
6. Click OK to enter Upgrade mode.
The ILOM stops its normal operation and prepares for a flash upgrade.
7. Type the path to the new ILOM flash image file in the Select File to Upload field, or click the Browse button to locate and select the firmware update file (*.ima).
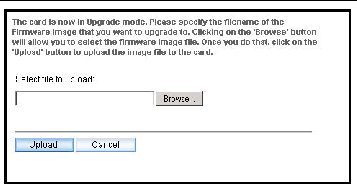
The Upgrade wizard copies the selected file into the ILOM's DRAM and then verifies that the copy procedure was successful. This takes about one minute with a fast network connection.
The system displays a confirmation dialog box.
|
Note - A network failure during the file upload will result in a time out and the ILOM will reboot with the prior version of the ILOM firmware. |
9. In the dialog box, click OK.
The Verify Firmware Image dialog appears.
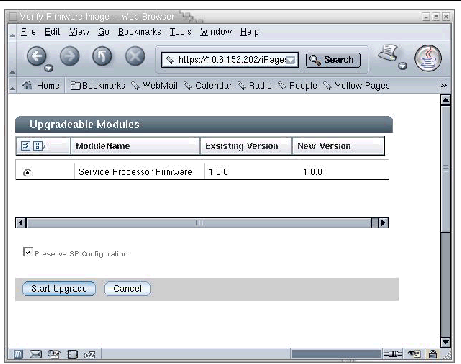
10. Select Preserve Configuration to keep your ILOM settings. Otherwise, they will be overwritten.
11. Click the Start Upgrade button, or click the Cancel button to stop the upgrade.
If you clicked Start Update, a progress screen indicates that the firmware image is being upgraded. Once the upgrade progress reaches 100%, the firmware upgrade is complete.
After the upgrade operation has completed successfully, the ILOM will automatically reboot. This is done so that the image upgrade can take effect.
|
Note - You cannot perform any other operation within your current Internet browser session. |
12. Close your Internet browser and reconnect to the ILOM.
|
Note - If the configuration is not preserved, enter BIOS setup and save the optimal default settings. |
1. Log in to the ILOM as Administrator or Operator to reach the WebGUI.
2. From the Maintenance tab, choose Reset SP.
The Reset Service Processor page appears.
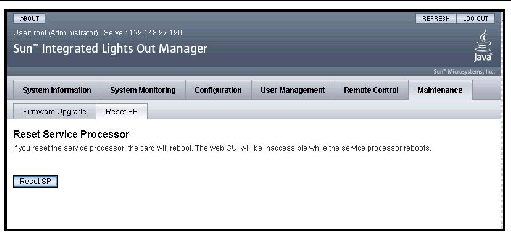
3. Click the Reset SP button to reset the ILOM.
The ILOM reboots. The WebGUI is unavailable while the ILOM reboots.
This procedure causes the ILOM to reset the administration password and to clear the BIOS password.
This procedure requires changing a hardware jumper in your server enclosure. See your service manual for details.
This section explains how to view detailed information about the Sun server replaceable components, sometimes referred to as field-replaceable units (FRUs) and customer-replaceable units (CRUs).
Depending on the component you select, information about the manufacturer, component name, serial number, and part number might be displayed.
1. Log in to the ILOM as Administrator or Operator to reach the WebGUI.
2. From the System Information tab, select Components.
The Replaceable Component Information page appears.
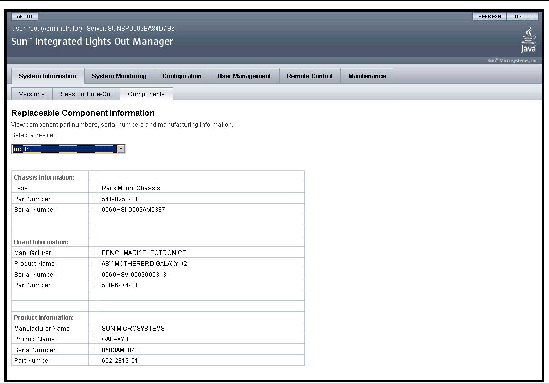
3. Select a component from the drop-down list.
Information about the selected component appears.
This section explains how to view the temperature, voltage, and fan sensor readings. For details on individual sensors, see your platform supplement.
The system is equipped with a number of sensors that measure voltages, temperatures, and other settings. ILOM polls the sensors and posts an event in the sensor event log (SEL) when they cross a threshold. Some of these readings are also used to perform actions, such as adjusting fan speeds, illuminating LEDs and powering off the chassis.
If an event crosses a threshold defined in the Alert Destinations view, it generates an alert, which is sent to the destination configured in Section 5.6, Viewing Alert Destinations and Configuring Alerts.
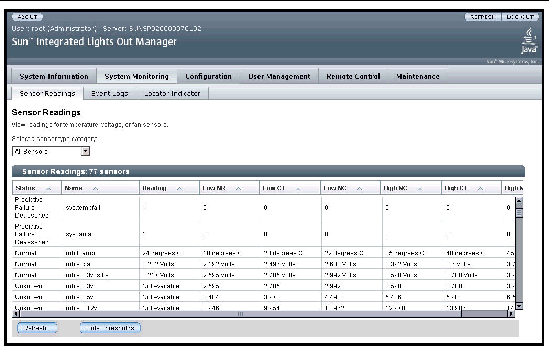
The thresholds appear in the Sensor Readings view shown in FIGURE 5-6.
1. Log in to the ILOM as Administrator or Operator to reach the WebGUI.
2. From the System Monitoring tab, choose Sensor Readings.
|
Note - The sensor displays in this section are examples. The sensor names, ranges and functions might be different on your system. For details, see your platform supplement. |
The Sensor Readings page appears.
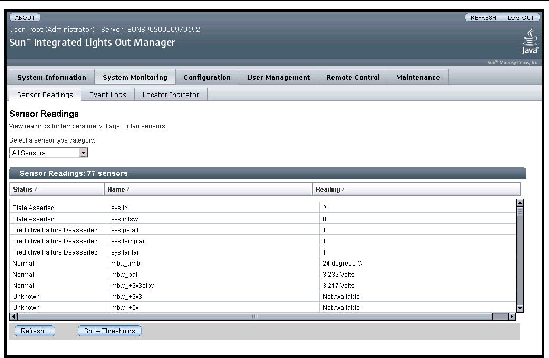
3. Select the type of sensor readings that you want to view from the drop-down list.
The selections are All Sensors, Temperature Sensors, Voltage Sensors, or Fan Sensors.
The WebGUI displays the readings.
For details, see your platform supplement.
4. To sort the data by the values in any column, click the triangle symbol next to the column heading.
For example, clicking the symbol next to Status sorts the entries by Status. Clicking it again reverses the sort order.
5. Click the Refresh button to update the sensor readings to their current status.
6. Click the Show Thresholds button to display the settings that trigger alerts.
The WebGUI updates the Sensor Readings table.
|
Note - The sensors shown in FIGURE 5-7 are examples only. The actual sensor names, ranges, and functions might be different on your platform. For details, see your platform supplement. |
In this example, if the system temperature reaches 35o C, the ILOM will send an alert.
Sensor thresholds include the following:
7. Click the Hide Thresholds button hide the thresholds.
The WebGUI redisplays the sensor readings without the thresholds.
This section explains how to view alert destinations and configure alert settings for the ILOM.
The alert management view allows you to map alert levels to destinations (IP addresses). For example, you can configure it so that all critical alerts are sent to one destination and all non-recoverable alerts are sent to another.
An alert is generated when a sensor crosses the specified threshold. For example, if you configure an alert for critical thresholds, the ILOM sends an IPMI trap to the specified destination when any sensor crosses the upper or lower critical (CT) threshold.
All alerts are IPMI PET traps, as defined in the Intelligent Platform Management Interface (IPMI) v2.0. A special criteria, informational, is reserved for system events that are not related to sensors.
Each line in the alert management view is called a "rule". Each rule identifies an alert level and sends all alerts at that level to the specified IP address.
|
Note - Because there are four alert levels and 15 alert rules, you can configure the system to send the same level of alert to multiple destinations. |
Users with operator privileges can view the alert settings. Changing them requires administrator privileges.
1. Log in to the ILOM as Administrator or Operator to reach the WebGUI
2. From the Configuration tab, choose Alert Management.
The Alert Destinations page appears, displaying a list of alerts.
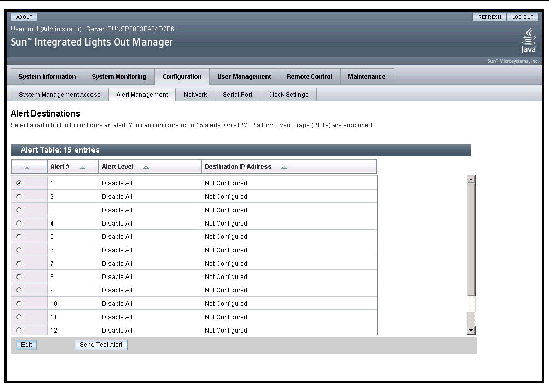
The alert table includes four columns:
Configuring an alert requires administrator privileges.
1. Select a radio button to select an alert in the table.
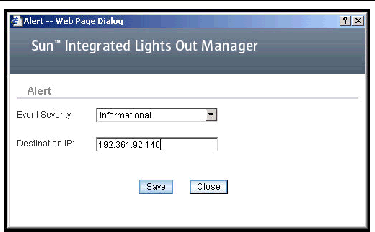
3. Select an event severity from the drop-down list.
4. Type the destination IP address for the alert.
The modified alert appears in the Alert Destinations table.
This procedure causes the ILOM to send a test alert. It requires administrator privilege.
1. Select a radio button to select an alert in the table.
2. Click the Send Test Alert button.
A confirmation dialog box indicates that the alert was sent to the specified IP address.
3. Click OK to exit the dialog.
4. On the destination machine, verify that the alert was sent successfully.
This section explains how to view and clear the system event log (SEL).
The IPMI system event log provides status information about the Sun server's hardware and software to the ILOM software, which displays the events in the WebGUI. Events are notifications that occur in response to some actions.
To view and clear the system event logs:
1. Log in to the ILOM as Administrator or Operator to reach the WebGUI.
2. Select System Monitoring => Event Logs.
The System Event Logs page appears.
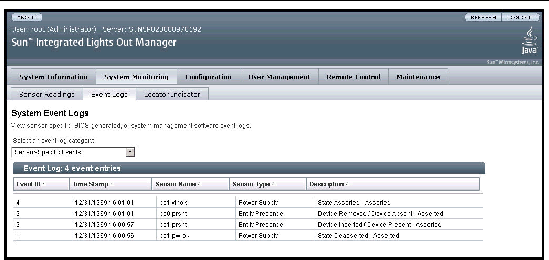
3. Select an event log category that you want to view from the drop-down list.
You can select from the following types of events:
After you have selected a category of event, the Event Log table displays the specified events.
The fields in the Event Log table are described below.
4. To clear the event log, click the Clear Event Log button.
A confirmation dialog box appears.
5. Click OK to clear all entries in the log.
The SEL time stamps are related to the ILOM clock settings. If the clock settings change, the change is reflected in the time stamps.
When the ILOM reboots, the ILOM clock is set to Thu Jan 1 00:00:00 UTC 1970. The ILOM reboots as a result of the following:
After an ILOM reboot, the ILOM clock is changed by the following:
To set the ILOM clock, see Section 6.3, Setting the ILOM Clock.
This section explains how to enable monitoring and management of the Sun server using the Simple Network Management Protocol (SNMP). The Sun server supports SNMP versions 1, 2c, and 3. SNMP v3, which is the preferred version to use for secure operations, is enabled by default. The ILOM has a preinstalled SNMP agent that enables you to manage the server using the ILOM. You can use any management application that supports SNMP to manage the Sun server.
SNMP is used to access and manipulate Management Information Base (MIB) files on the target agent. For more information about SNMP and the classes of MIB files that the Sun server supports, see Section 11.1, About SNMP.
1. Log in to the ILOM as Administrator to reach the WebGUI.
Only accounts with administrator privileges are enabled to modify SNMP settings.
2. From the Configuration tab, select System Management Access, and then select SNMP.
The SNMP Settings page appears.
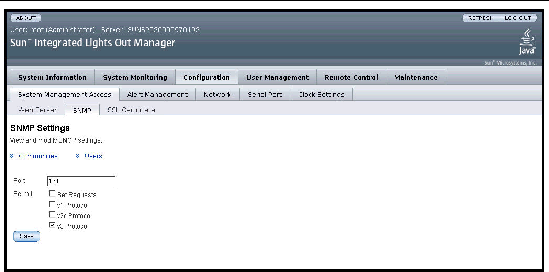
3. Type the port number in the Port field.
4. Enable or disable Set Requests by clicking the Set Requests checkbox.
If sets are disabled, all SNMP objects are read only.
5. if disabled, everything defaults to read
6. If you want to permit SNMP set requests, select the Set Requests check box.
7. Select a check box to enable SNMP v1, v2c, or v3.
SNMP v3 is enabled by default. You can independently enable or disable v1, v2c, and v3 protocol versions.
8. Click the Save button for your settings to take effect.
9. At the bottom of the page, you can also add, edit, or delete SNMP communities, as well as SNMP users. See FIGURE 5-12.
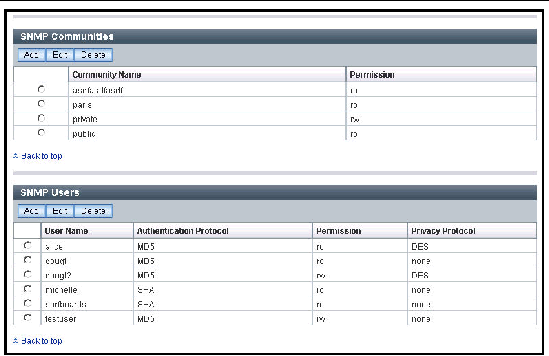
1. Click the Communities link, or scroll down to the Communities list.
2. Click the Add button under the SNMP Communities list.
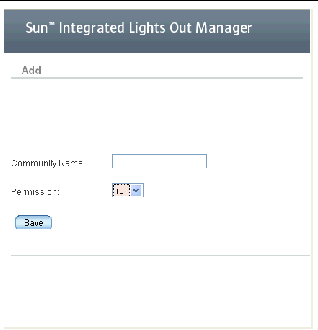
3. Type the name in Community Name field.
The name can contain up to 35 characters. It must start with an alphabetic character and cannot contain a space.
4. Select either read-only (ro) or read-write (rw) permissions.
1. Click the Communities link, or scroll down to the Communities list.
2. Select the radio button of the SNMP community to edit.
3. Click the Edit button under the SNMP Communities list.
4. Select either read-only (ro) or read-write (rw) permissions.
1. Click the Communities link, or scroll down to the Communities list.
2. Select the radio button of the SNMP community to be deleted.
3. Click the Delete button under the SNMP Communities list.
A confirmation dialog box appears.
4. Click OK to delete the SNMP community.
1. Click the Users link or scroll down to the Users list.
1. Click the Add button under the SNMP Users list.
2. Type a user name in the User Name field.
The name can include up to 35 characters. It must start with an alphabetic character and cannot contain a space.
3. Select either Message Digest 5 (MD5) or Secure Hash Algorithm (SHA).
4. Type in an authentication password.
The authentication password must contain 8 to 16 characters, with no colon or space characters. It is case sensitive.
5. Type it again in the Confirm Password field.
6. Select either read-only (ro) or read-write (rw) permissions.
7. Select either DES or none for a privacy protocol.
8. Type in a privacy password.
The privacy password must contain 8 to 16 characters, with no colon or space characters. It is case sensitive.
9. Type it again in the Confirm Password field.
1. Click the Users link or scroll down to the Users list.
2. Select the radio button of the SNMP user to be edited.
3. Click the Edit button under the SNMP Users list.
4. Select either Message Digest 5 (MD5) or Secure Hash Algorithm (SHA).
5. Type in an authentication password.
The authentication password must contain 8 to 16 characters, with no colon or space characters. It is case sensitive.
6. Type it again in the Confirm Password field.
7. Select either read-only (ro) or read-write (rw) permissions.
8. Select either DES or none for a privacy protocol.
9. Type in a privacy password.
The privacy password must contain 8 to 16 characters, with no colon or space characters. It is case sensitive.
10. Type it again in the Confirm Password field.
1. Click the Users link, or scroll down to the Users list.
2. Select the radio button of the SNMP user to be deleted.
3. Click the Delete button under the SNMP Users list.
A confirmation dialog box appears.
4. Click OK to delete the SNMP user.
This section explains how to turn the Locator indicator on the Sun server on and off.
|
Note - Your platform might have a Server Locator Indicator. Check your platform supplement. |
The Server Locator Indicator is a pair of small lights that you turn on to help you identify a specific server among many in a data center. One light is positioned on the front of the server in the upper left corner, and the other is on the back of the server in the upper center section.
1. Log in to the ILOM as Administrator or Operator to reach the WebGUI.
2. From the System Monitoring tab, select Locator Indicator.
The Locator Indicator page appears.
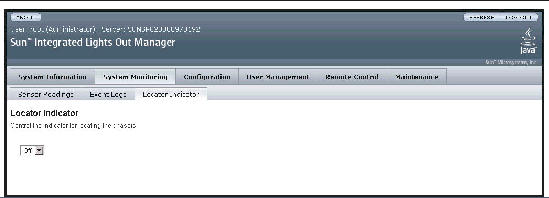
3. To turn the Locator indicator on and off, use the drop-down list.
The Locator indicator is either illuminated or turned off, according to your selection.
This section explains how to view the ILOM hardware and firmware revisions, as well as the Intelligent Platform Management Interface (IPMI) version.
1. Log in to the ILOM as Administrator or Operator to reach the WebGUI.
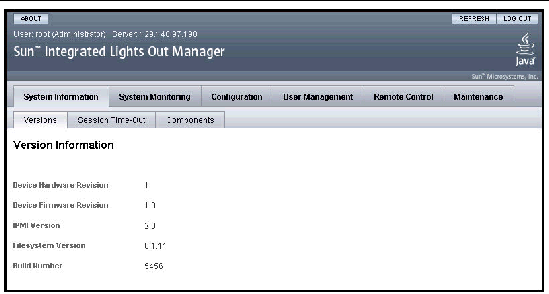
2. From the System Information tab, select Versions.
The Version Information page appears (see FIGURE 5-15). This page displays the ILOM hardware and software revisions, and the IPMI version.
This section explains how to view all active connections to the ILOM.
1. Log in to the ILOM as Administrator or Operator to reach the WebGUI.
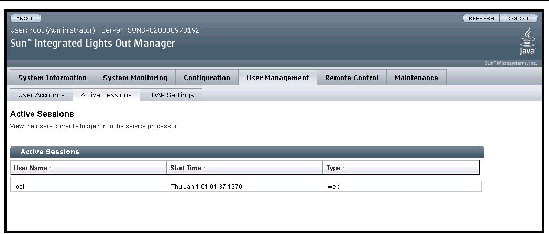
2. From the User Management tab, select Active Sessions.
The Active Sessions page appears. You can find the user name, the date and time that the user initiated the session, and the type of session(web or command shell).
Copyright © 2006, Sun Microsystems, Inc. All Rights Reserved.