|
Health Monitoring Module |
The Health Monitoring control module on the Sun Control Station allows you to monitor the health status of your managed hosts according to various parameters. This document explains the features and services available through the Health Monitoring control module.
The model implemented for the Health Monitoring Module is based on polling and events. This means that health-status data is acquired either by the control station initiating a polling interval to read the client-state information from each host, or by the managed host informing the control station when it has a problem (an event).
The event model allows for immediate notification when a problem is detected.
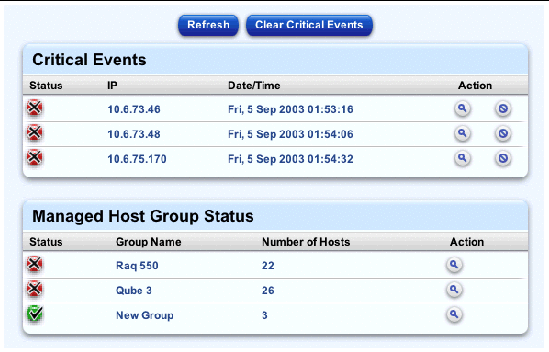
FIGURE 1 shows a sample of the Critical Events and the Managed Host Group Status tables.

The status of each service or hardware component is indicated by a colored circle and icon--grey with dotted line, green with checkmark, yellow with exclamation mark or red with X mark--beside each item. The colors have the following significance:
 Grey with dotted line--No information is available, or the service or the monitoring feature is not enabled on the host.
 Green with checkmark--The service or component is functioning normally.
 Yellow with exclamation mark--There is moderate use on the host or a component is recovering.
 Red with X--There is heavy use on the host or a failure.
If a "critical" event is present on the control station, a Status Alert is generated in the top-left corner of the UI.
A critical event is generated when a transition to a "warning" or "critical" event is detected or generated (meaning that a yellow or red state is returned during health polling).
A critical event can involve any of the services or hardware components on a managed host.
A host can be managed by more than one Sun Control Station. The Health-Monitoring settings (for example, the CPU alarm thresholds) can be changed from any of the control stations. When the settings are changed on one control station, the new values are propagated to all of the managed hosts.
In this case, the values from the most recent settings changes overwrite the earlier values on the managed host; however, the settings that appear in the UIs of the other control stations do not update to reflect the most recent settings changes.
To resolve this issue, if more than one control station manages a given host(s), ensure that the Health-Monitoring settings on each of these control stations are set to the same values.
You can have a host managed by two different control stations.
The managed host in now enabled to provide LOM information to the first control station; this information is displayed in the Health Monitoring tables.
However, since the Health Monitoring control module is designed to receive LOM information when it is available, the Health Monitoring tables on the second control station will also display this LOM information, even though the LOM control module has not been installed on the second control station.
This is not a bug or a malfunction on the second control station, but just to let you know that you may see LOM information displayed in the Health Monitoring tables when you would not expect to see it.
When you click the Health Monitor menu item on the left, the sub-menu items allow you to view the current status or update the status of the services and hardware components for managed hosts.
The Summary sub-menu item displays a summary of the health-status data for the managed hosts.
When you click on the Health Summary sub-menu item, the Critical Events and Managed Host Group Status tables appear; see FIGURE 1.
When you click a magnifying-glass icon to see more detailed information for a host, three tables appear:
|
Note - To add a new Health Monitoring service, see Adding new services to the Health Monitoring module. |
To view a summary of the health-monitoring data on a managed host:
1. Select Health Monitor > Health Summary.
The Critical Events and Managed Host Group Status tables appear.
2. To view more detailed information for a critical event, click the magnifying-glass icon next to the item in the Actions column.
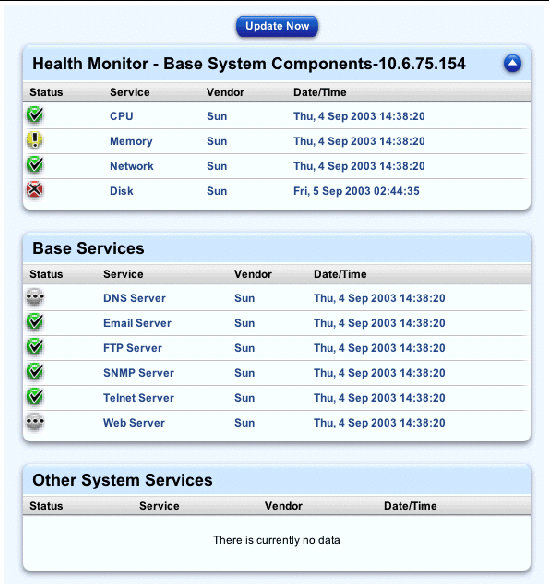
The following information tables appear; see FIGURE 2.
Click the up-arrow icon in the top-right corner to return to the previous screen.
3. If you view the details for a group of managed hosts, the Managed Hosts State table appears, listing the hosts belonging to that group.
You can click on the magnifying-glass icon next to the host in the Actions column. The same three information tables then appear.
Click the up-arrow icon in the top-right corner to return to the previous screen.

Above the Critical Events table is a Refresh button. This button causes the UI frame to update immediately to reflect the most current data in the database.
This button does not update the database with new information from the managed hosts. To update the information in the database, see Updating the health-status data.
The services monitored on Sun Cobalt server appliances can include:
|
Note - Not all of these services are available on each type of Sun Cobalt server appliance. |
 (JSP
(JSP ) and Servlets
The services monitored on non-server-appliance hosts servers include:
When a critical event occurs on a managed host, the event appears in the Critical Events table. If you decide not to deal with a given critical event, you can clear this event from the table. The problem is still present on the managed host, but there will be no further notification concerning this critical event in the Critical Events table.
|
Note - If a critical event for a different problem occurs on this same managed host, a new critical event displays in the table. |
To clear a particular critical event from the Critical Events table or to clear all critical events:
1. Select Health Monitor > Health Summary.
The Critical Events and Managed Host Group Status tables appear.
2. To clear a particular critical event from the table, click the delete icon next to the event in the Actions column.
The Critical Events table refreshes with that critical event removed from the table.
3. To clear all critical events from the table, click Clear Critical Events above the table.
The Critical Events table refreshes with no entries.
You can refresh the health-status data for each host; this feature causes the control station to retrieve immediately the most recent health-status data from a host.
The Update Now button appears in the UI when you are viewing the detailed information tables for an individual host.
To refresh the health-status data on a managed host:
1. Select Health Monitor > Health Summary.
The Critical Events and Managed Host Group Status tables appear.
2. Click the magnifying-glass icon next to the item in the Actions column.
The detailed tables of information appear.
3. If you view the details for a critical event, the following information tables appear:
4. If you view the details for a group of managed hosts, the Managed Hosts State table appears, listing the hosts belonging to that group.
You can click on the magnifying-glass icon next to the host in the Actions column. The same three information tables then appear.
5. On the screen showing the detailed information tables for a host, click Update Now above the table.
This forces the control station to retrieve immediately the health data from the managed host.
The Task Progress dialog appears.
6. Click the up-arrow icon in the top-right corner to return to the previous screen(s).
To view the overall health for each of the managed hosts in one table:
1. Select Health Monitor > View Hosts.
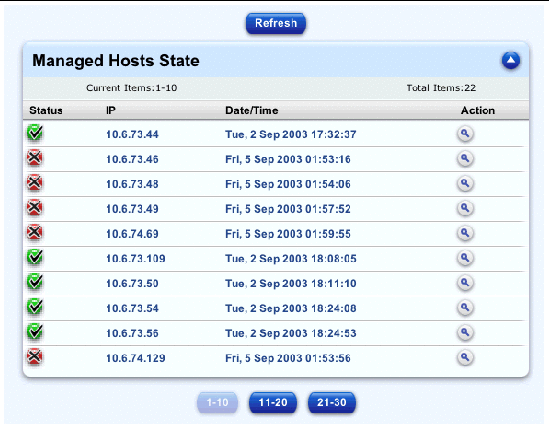
The Managed Hosts State table appears, displaying the list of managed hosts; see FIGURE 3.
2. To view more details on an individual host, click the magnifying-glass icon next to the host in the Actions column.
The following information tables appear:
Click the up-arrow icon in the top-right corner to return to the previous screen.
3. On the screen showing the detailed information tables for a host, you can click Update Now above the table.
This forces the control station to retrieve immediately the health data from the managed host.
The Task Progress dialog appears.
4. Click the up-arrow icon in the top-right corner to return to the previous screen(s).

Above the Managed Hosts State table is a Refresh button. This button causes the UI frame to update immediately to reflect the most current data in the database.
This button does not update the database with new information from the managed hosts.
This feature allows the control station to verify that the agent is still running on a managed host and that the host can be accessed over the network. It works in the following way:
1. The control station sends a simple agent request.
If this request is successful, the agent is functioning normally and the host can be accessed over the network. The status of the network component in the Base System Components table is green.
If this agent request is not successful, the status of the network component changes to red; see FIGURE 2 for a sample.
2. The host with the "failed" agent is then pinged through an Internet Control Message Protocol (ICMP) ping to verify network connectivity.
If this ICMP ping is successful, the health-monitoring information table in the database records that the control station cannot access the agent on the host <IP address>.
If this ICMP ping is not successful, the table records that the control station cannot access the host <IP address> over the network.
The Status Polling Interval indicates when a polling cycle begins (for example, every four hours) for retrieving the health data from the managed hosts.
When setting this interval, you need to take into account the number of hosts managed by the control station. The managed hosts are polled in serial. When the control station encounters an unreachable host (including SCS agent failures), the timeout period for polling this host is ten (10) minutes.
If the control station encounters a number of unreachable hosts during a polling cycle, a given cycle may not complete before the start of the following polling cycle.
The minimum Status Polling Interval is one hour. If a Sun Control Station is managing many hosts, you should set a longer interval.
To configure the settings for the Health Monitoring control module:
1. Select Health Monitor> Settings.
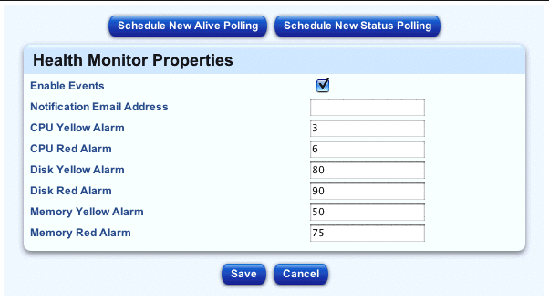
The Health Monitor Properties table appears; see FIGURE 4.
2. You can configure the following parameters:
Events come into the control station on port 80.
This feature does not affect the events that are detected during a polling interval.
You can enter only one email address in this field.
For example, a value of 80 means that a yellow alarm is generated when the 80% of the capacity of the hard disk drive is used.
For example, a value of 90 means that a red alarm is generated when the 90% of the capacity of the hard disk drive is used.
For example, a value of 50 means that a yellow alarm is generated when the 50% of the memory is in use.
For example, a value of 75 means that a red alarm is generated when the 75% of the memory is in use.
The Health Monitor Properties table refreshes.

To schedule a new Alive Polling task:
1. Select Health Monitor> Settings.
The Health Monitor Properties table appears.
2. Click Schedule New Alive Polling above the table.
The Schedule Settings For Alive Polling table appears. Configure the following settings:
If you click Cancel, the scheduled task is not saved. The Scheduled Tasks table appears, but without the task you just cancelled.
If you click Save, the scheduled task is added to the list of scheduled tasks. The Scheduled Tasks table appears with the new task.
4. In this table, you can view details for, modify or delete a scheduled task.
To view the details of a scheduled task, click the magnifying-glass icon.
To modify a scheduled task, click the pencil icon.
To delete a scheduled task, click the delete icon.
To schedule a new Status Polling task:
1. Select Health Monitor> Settings.
The Health Monitor Properties table appears.
2. Click Schedule New Status Polling above the table.
The Schedule Settings For Status Polling table appears. Configure the following settings:
If you click Cancel, the scheduled task is not saved. The Scheduled Tasks table appears, but without the task you just cancelled.
If you click Save, the scheduled task is added to the list of scheduled tasks. The Scheduled Tasks table appears with the new task.
4. In this table, you can view details for, modify or delete a scheduled task.
The Health Monitoring Module allows you to incorporate customized scripts to execute and monitor. A script is executed and, based on the results, may send an event that causes an alarm or critical event on the Sun Control Station. The specific information associated with the event is presented in the Other Services table in the detailed-information screen. Clearing the Critical Event table resets the alarms.
To make it easy to customize the Health Monitoring module, the module uses a configuration file to specify details on the customized scripts. From this configuration file, the Health Monitoring daemon acquires the name of the monitor, description, program to run, and the text for each of the states that the program will supply.
The states are 0, 1, 2 or 3; they correspond to the criticality of the problem and thus to the color and icon of the state presented in the Health Monitoring tables. The states are defined as:
The format of the configuration file is as follows:
Example: /usr/mgmt/bin/cobalt_db.pl
Example: Monitors the database
Example: The database server is not monitored/state unavailable.
Example: The database server is online.
Example: The database server is in limbo.
Example: The database server is offline.
The program specified in the configuration file is required to return a numeric value of 0, 1, 2 or 3. When the Health Monitoring daemon runs a polling pass (approximately every 10 minutes), the program specified in the configuration file is executed.
The results (a value of 0, 1, 2 or 3) are captured and stored after the program is executed for the first time. From that point on, each time the Health Monitoring daemon runs, the results are compared to the previous results. If the results are different, an event is generated and sent to the control station. The event contains the state, message associated with the state, name, version and description of the service. If a yellow or red state is returned, a critical event is generated on the control station and a Status Alert is generated in the top-left corner of the UI.
The configuration file must be placed in the /usr/mgmt/etc/hmd directory and the monitor script in the /usr/mgmt/bin directory.
Include these steps in the install script so that, during installation, the files are placed in the correct directories and the daemon is restarted.
To create a new Health Monitoring service:
1. Create the configuration file with the various settings for the new service.
Name the configuration filename.conf (for example, cobalt_db.conf). All of the configuration files are placed in the /usr/mgmt/etc/hmd directory.
This is what a sample configuration file would look like:
version 1.0
program /usr/mgmt/bin/cobalt_cpu.pl
detail :81/cgi-bin/.cobalt/cpuUsage/cpuUsage.cgi
vendor Sun
interval 10
name CPU
description Cobalt CPU Monitor
state0msg The CPU is not monitored/state unavailable.
state1msg The CPU is lightly used.
state2msg The CPU is moderately used.
state3msg The CPU is heavily used.
yellowalarm 3
redalarm 6
alarmtitle load of the CPU
2. Create a script to monitor the new service (the program setting in the configuration file).
All of these monitor scripts are placed in the /usr/mgmt/bin directory.
For example, the monitor script for the service Database Check (cobalt_db.pl) would look like:
#!/usr/bin/perl
use strict;
# cobalt_cpu.pl - health monitoring script for the CPU
#
# Details:
#
# This script is used in conjunction with the health monitoring daemon (hmd)
# for use with "Big Daddy".IPC is accomplished by setting the proper exit
# code of this script. The following exit codes coincide with the following
# states:
#
# -1 - fatal error
# 0 - n/a ( unmonitored/state unavailable )
# 1 - green ( normal state )
# 2 - yellow ( warning state )
# 3 - red ( critical state )
#
# Based up the exit code, the hmd will react by sending an event to the
# management station with the information defined in the config file for
# this service.
my $yel_thresh = $ARGV[0] || 3;
my $red_thresh = $ARGV[1] || 6;
my $fifteen;
open(LOAD,"/proc/loadavg") or out(-1);
my $line = <LOAD>;
$line =~ /^(\d+\.\d+)\s*(\d+\.\d+)\s*(\d+\.\d+)/o;
close LOAD;
$fifteen = $3;
if ($fifteen >= $red_thresh) {
exit 3;
} elsif ($fifteen >= $yel_thresh ) {
exit 2;
} else {
exit 1;
}
3. In the install script, include the following directive specifically for the new Health Monitoring service.
Copy the configuration file and the monitor script to the correct locations.
echo "Copying script to /usr/mgmt/bin " >> $LOG
cp /YourDirectory/patches/cobalt_db.pl /usr/mgmt/bin/
echo "Copying config file to /usr/mgmt/etc/hmd " >> $LOG
cp /YourDirectory /patches/cobalt_db.conf /usr/mgmt/etc/hmd/
4. Create a package file for each type of host on which you wish to install this new Health Monitoring service (for example, a Sun LX50 server or a Sun Cobalt Qube 3).
3).
5. Upload the package to the control station through the Software Management Module. Use Software Management Module either to publish the package or to install it on selected hosts.
For more information, refer to the PDF Software Management Module.
Copyright © 2003, Sun Microsystems, Inc. All rights reserved.