| C H A P T E R 12 |
|
Peripheral Devices |
This chapter describes viewing and editing parameters for peripheral devices. Topics covered include:
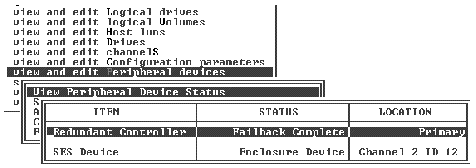
To view the status of each controller, from the Main Menu, choose "view and edit Peripheral devices  View Peripheral Device Status."
A table displays the status of the available peripheral devices.
A Fibre Channel array's SCSI Enclosure Services (SES) processor is located on the I/O module. The SES processor monitors chassis-based environmental conditions such as temperature sensor readings, cooling fans status, the beeper speaker condition, power supplies, and slot status. The SES processor is supported by Sun StorEdge Configuration Service and the Sun StorEdge CLI. These chassis sensors are separate from the controller sensors described in Viewing Controller Voltage and Temperature Status.
For Sun StorEdge 3510 FC JBOD arrays and Sun StorEdge 3511 SATA JBOD arrays, both Sun StorEdge Configuration Service and the Sun StorEdge CLI access the SES processor using device files in /dev/es, such as /dev/es/ses0, as shown in the following example.
|
1. /dev/rdsk/c4t0d0s2 [SUN StorEdge 3310 SN#000280] (Primary) 2. /dev/es/ses0 [SUN StorEdge 3510F D SN#00227B] (Enclosure) |
|
1. From the Main Menu, choose "view and edit Peripheral devices  View Peripheral Device Status
  SES Device" to display a list of environmental sensors and other hardware components of that SES device.
2. Select an item from the list and press Return to display information about it or see a list of its component attributes.
Choosing Overall Status, as in the illustration above, displays the status of the SES device and its operating temperature.
Overall status of an SES device is reported independently from the status of the individual components of that device. An SES device showing an overall status in the menu has its own sensors that report its overall status and its overall temperature.
3. Select other attributes in which you are interested and press Return to learn more about the SES device.
Selecting the Element Descriptor in the following illustration displays the descriptive name of the element.
In this case the descriptor is Disk Drives.
You can view the status of SES components, including the pair of fans located in each power supply module. A fan is identified in the SES Device menus as a cooling element.
|
1. From the Main Menu, choose "view and edit Peripheral devices  View Peripheral Device Status
  SES Device
  Cooling element."
In some cases you have to "drill down" to display information about components, as as shown in the following illustrations. The following series of screens provide the fan (cooling element) status for each fan.
2. Choose one of the elements (element 0, 1, 2, or 3).
Normal fan speeds are indicated by numbers 1 through 7, indicating speeds in the normal range of 4000 to 6000 RPM. The number 0 indicates that the fan has stopped.
If a fan fails and the Status field does not display the OK value, you must replace the power supply module and fan.
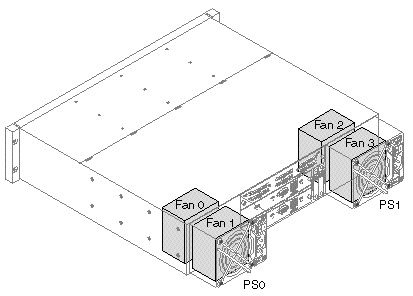
Cooling elements in the status table can be identified for replacement as shown in TABLE 12-2. Cooling fan locations are identified in FIGURE 12-2.
Monitoring temperature at different points within the array is one of the most important SES functions. High temperatures can cause significant damage if they go unnoticed. There are a number of different sensors at key points in the enclosure. The following table shows the location of each of those sensors. The element ID corresponds to the identifier shown when you choose "view and edit Peripheral devices  View Peripheral Device Status
  SES Device
  Temperature Sensors."
|
Note - Press the down arrow to access an element ID that is not currently displayed in the displayed list of sensors. |
Voltage sensors make sure that the array's voltages are within normal ranges. The voltage components differ for the Sun StorEdge 3510 FC array and the Sun StorEdge 3511 SATA array.
The following tables describe each voltage sensor. The element ID corresponds to the identifier shown when you choose "view and edit Peripheral devices  View Peripheral Device Status
  SES Device
  Voltage Sensor."
Each Sun StorEdge 3510 FC array and Sun StorEdge 3511 SATA array has two fully redundant power supplies, with load-sharing capabilities. The sensors monitor the voltage, temperature and fan units in each power supply.
A SCSI array's SAF-TE processor is located on the SCSI I/O module. It controls environmental monitoring of SAF-TE devices contained in the chassis such as temperature sensors, cooling fans, the beeper speaker, power supplies, and slot status. These chassis sensors are separate from the controller sensors described in Viewing Controller Voltage and Temperature Status.
|
1. From the Main Menu, choose "view and edit Peripheral devices  View Peripheral Device Status
  SAF-TE Device."
The temperature sensor displays the current temperature of each sensor in degrees Fahrenheit.
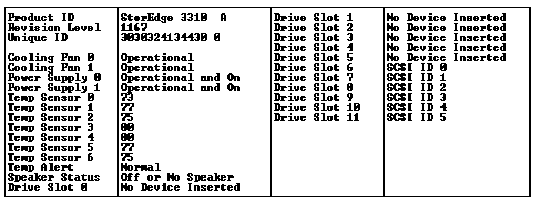
When a drive slot is filled, the drive slot row displays a SCSI ID number.
In a single-bus configuration, ID numbers 0 through 5 and 8 through 13 are shown if all 12 drives are filled (SCSI IDs 6 and 7 are reserved for host communication). Wherever a slot is empty, the message "No Device Inserted" is displayed. See FIGURE 12-3.
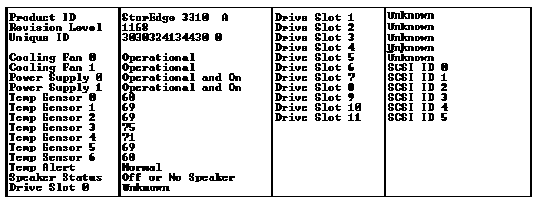
The SAF-TE protocol does not support a split-bus configuration and recognizes only one bus (half the drives) if you have a split-bus configuration. As a result, in a 12-drive split-bus configuration you see the message "Unknown" for six drives on one channel, but you see the ID numbers for the six drives on the other channel, as shown in FIGURE 12-4.
|
Note - See Viewing the Status of a Physical Drive for instructions on how to determine whether you have all slots filled in a split-bus configuration. |
You can view the status of SAF-TE components, including the pair of fans located in each power supply module. A pair of fans is identified in the SAF-TE Device Status window as Cooling Fan 0 or Cooling Fan 1.
If a fan fails and the Status field does not display the Operational value, you must replace the power supply module and fan.
Cooling elements in the status table can be identified for replacement as shown in TABLE 12-2. Cooling fan locations are identified in FIGURE 12-5.
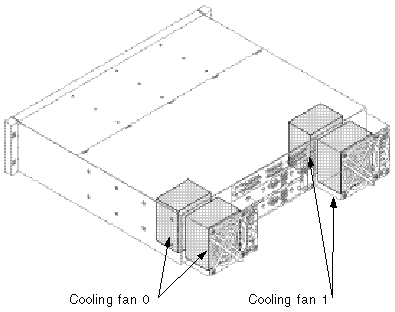
Monitoring temperature at different points within the array is one of the most important SAF-TE functions. High temperatures can cause significant damage if they go unnoticed. There are a number of different sensors at key points in the enclosure. The following table shows the location of each of those sensors. The Element ID corresponds to the identifier shown when you choose "view and edit Peripheral devices  View Peripheral Device Status
  SAF-TE Device."
Each Sun StorEdge 3310 SCSI array and Sun StorEdge 3320 SCSI array has two fully redundant power supplies, with load sharing capabilities. The sensors monitor the voltage, temperature and fan units in each power supply.
The Set Peripheral Device Entry menu options include the following:
This menu option enables you to force the failure of either the primary or secondary controller.
You can force a primary controller failure to test an array's failover functionality. This feature is normally used only for testing and troubleshooting.
 From the Main Menu, choose "view and edit Peripheral devices
  Set Peripheral Device Entry
  Redundant Controller
  force Primary controller failure," and then choose Yes to confirm your choice.
The primary controller is disabled and the array fails over to the secondary controller. A period of time is necessary before the controller's functionality is restored.
You can force a secondary controller failure to test an array's failover functionality. This feature is normally used only for testing and troubleshooting.
1. From the Main Menu, choose "view and edit Peripheral devices  Set Peripheral Device Entry
  Redundant Controller
  force Secondary controller failure," and then choose Yes to confirm your choice.
A message confirms that the controller has been failed.
2. Press Escape to clear the message.
1. From the Main Menu, choose "view and edit Peripheral devices  Set Peripheral Device Entry
  Redundant Controller - Primary" to display the following message.
2. Choose Yes to restore the controller that you previously force-failed.
3. Allow several minutes for the failed controller to come back online.
The following message notifies you when the controller is back online:
Event trigger operations configure an array so that it dynamically switches from write-back-enabled to write-back-disabled (write-through) if a specified failure occurs or threshold is exceeded. Once the problem is corrected, the original write policy is restored.
This change affects the write policy of all logical drives except those whose individual policy has been changed to override the global default write policy for the array.
Except for the "Temperature exceeds threshold -" menu option, these trigger operations toggle between being enabled and being disabled each time you change the setting.
If the array has been configured with the write-back cache mode enabled, enable this menu option if you want the array to automatically revert to write-through cache mode (write-back disabled) if one controller in a dual controller array fails.
See Enabling and Disabling Write-Back Cache for more information about write-back and write-through cache policies.
 From the Main Menu, choose "view and edit Peripheral devices
  Set Peripheral Device Entry
  Event Trigger Operations
  Controller Failure," and choose Yes to confirm the change.
If the array has been configured with the write-back cache mode enabled, enable this menu option if you want the array to automatically revert to write-through cache mode (write-back disabled) if an array's battery backup fails or falls below its lower threshold.
|
|
 From the Main Menu, choose "view and edit Peripheral devices
  Set Peripheral Device Entry
  Event Trigger Operations
  BBU Low or Failed," and choose Yes to confirm the change.
If the array has been configured with the write-back cache mode enabled, enable this menu option if you want the array to automatically revert to write-through cache mode (write-back disabled) if one of the array's power supplies fails.
 From the Main Menu, choose "view and edit Peripheral devices
  Set Peripheral Device Entry
  Event Trigger Operations
  Power Supply Failed," and choose Yes to confirm the change.
If the array has been configured with the write-back cache mode enabled, enable this menu option if you want the array to automatically revert to write-through cache mode (write-back disabled) if one of the array's cooling fans fails.
 From the Main Menu, choose "view and edit Peripheral devices
  Set Peripheral Device Entry
  Event Trigger Operations
  Fan Failure," and choose Yes to confirm the change.
The "Temperature exceeds threshold -" menu option differs from other event triggers. It forces a controller shutdown---rather than merely a change in cache policy--if a temperature is detected that exceeds system threshold limits. You can adjust this setting to shut down the controller as soon as the temperature limit is exceeded, or after a delay ranging from two minutes to an hour, or disable the controller shutdown entirely. Choose Enable for an immediate shutdown after the upper threshold limit is exceeded, or choose Disable if you want no trigger for this event. Otherwise, select the time intervals you want to elapse after the threshold is exceeded before the controller shutdown takes place.
1. From the Main Menu, choose "view and edit Peripheral devices  Set Peripheral Device Entry
  Event Trigger Operations
  Temperature exceeds threshold" to display a menu of options and shutdown delay intervals.
2. Select the option or interval you want, and then choose Yes to confirm your choice.
Sun StorEdge 3000 family products are NEBS Class 3-certified. When this equipment is installed and operated in a NEBS-III or other environment that potentially requires the equipment to be operated outside of the normal temperature range, the Over-Temp Controller Shutdown function must be disabled (this includes testing for such operation).
The sensors responsible for shutdown (if enabled) are: Board #1 (85C), Board #2 (85C - and the most likely to cause the shutdown, especially when on the IOM in the upper slot), and CPU (95C).
In addition, there is a thermal switch in each power supply that shuts down the 5VDC & 12VDC current when the switch reaches 95C. This thermal switch cannot be directly monitored, bypassed, or defeated.
Ensure that an air gap exists between RAID controllers and any other equipment in the rack. Otherwise, if two devices make physical contact with each other, thermal conduction between the units can result in higher than expected operating temperatures.
This section describes how to see whether the voltage and temperature of the RAID controller are within normal ranges. These controller sensors differ from the chassis sensors whose status is reported by the SES (FC and SATA) or SAF-TE (SCSI) processor. See Viewing SES Status (FC and SATA Only) and Viewing Peripheral Device SAF-TE Status (SCSI Only) for information about chassis sensors.
|
 From the Main Menu, choose "view and edit Peripheral devices
  Controller Peripheral Device Configuration
  View Peripheral Device Status."
The components checked for voltage and temperature are displayed and defined as normal or out of order.
|
1. From the Main Menu, choose "view and edit Peripheral devices  Controller Peripheral Device Configuration
  Voltage and Temperature Parameters" to display a list of trigger threshold categories.
2. Select a parameter whose upper and lower thresholds you want to view or edit.
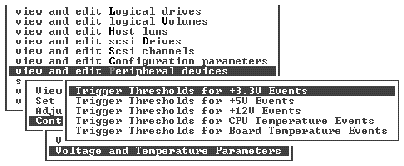
Upper and lower thresholds for the selected parameter are displayed.
3. If you want to change a threshold, select that threshold.
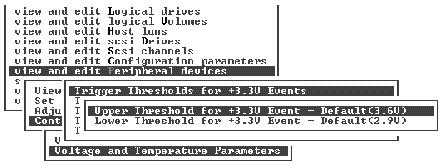
Editable threshold values are displayed.
4. If you want to change a threshold, delete the old value, type a new value, and press Return to change the setting.
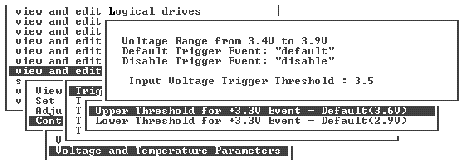
You can view FC error statistics that indicate the status of loopback operations on local channels and on drives.
The statistics are provided under the following headings:
To check the Fibre Channel Error statistics, perform the following steps.
1. From the Main Menu, choose "view and edit Peripheral devices  Fibre Channel Error Statistics
  Local Channel Statistics" to display local channel statistics.
2. Choose "Drive Side Device Statistics" to display drive-side device statistics.
Copyright © 2009, Dot Hill Systems Corporation. All rights reserved.