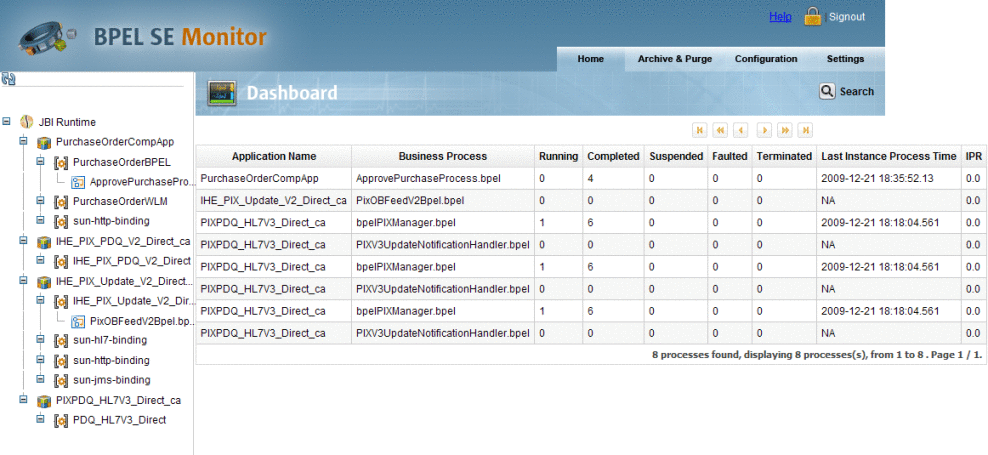
The BPEL Operational Dashboard
The Dashboard, the BPEL Monitoring Console's top-level window, provides a holistic picture of all your deployed applications. From the Dashboard you can determine the overall health of your system and quickly get a sense of how things are going.

The Dashboard tracks the number of process instances for each deployed application and business process. From the Dashboard's table you can follow the progress of your applications by the current tally of instances.
The Dashboard displays the following information:
-
Application Name: The name of the deployed Composite Application project.
-
Business Process: The name of the BPEL business process.
-
Running: The number of business process instances that are currently running.
-
Completed: The number of instances that have completed since the BPEL Service Engine was started.
-
Suspended: The number of instances that are currently suspended.
-
Faulted: The number of instances that have faulted or failed.
-
Terminated: The number of instances that were terminated.
-
Last Instance Process Time: The date and time that the last completed instance.
-
IPR (Instance Processing Rate): The number of instances processes within a user–defined unit of time.
The unit of time for which the IPR is sampled is configured from the Settings -> Business Process tabs. The Instance Processing Rate Calculation Period specifies the sample period in seconds. For example, if you want the sample period to display the number of business process instances for a one hour period, set the Instance Processing Rate Calculation period to 3600 (seconds).
Viewing a Specific Business Process
The Dashboard is designed help you move quickly from a summary view to a specific business process. From the Dashboard, click on any business process to open the Business Process Home page to that specific process. Click Home to return to the Dashboard.
- © 2010, Oracle Corporation and/or its affiliates
