Moving Between Windows in the Monitor Console
“Drill down” is a term used for moving from a summary view to detailed data. The BPEL Monitoring Console is designed to allow you to drill down from summary information to get to the detail you need for a single business process or process instance. You can quickly move through your deployed applications and business process in the BPEL Monitoring Console, no matter how big or small your system might be.
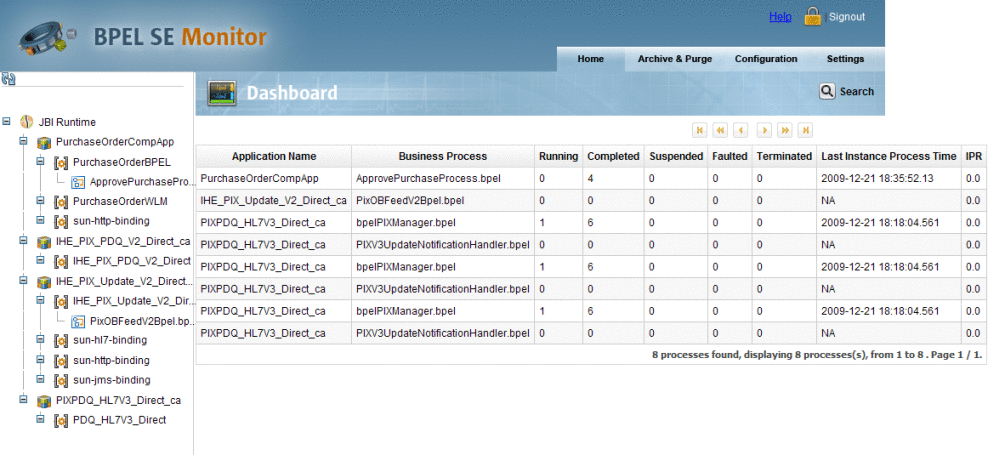
Navigating The Project Tree
The project tree is in the left pane of each of the console's windows. The tree displays all of the applications currently deployed in BPEL. The tree includes the complete JBI runtime, application nodes, and BPEL process nodes. Navigate through the console windows using the project tree, as follows:
-
JBI Runtime: Displays all deployed applications in the Dashboard
-
Application Node: Displays the business processes of the selected application in the Dashboard
-
Business Process Node: Displays the business process in the Business Process Home
The Dashboard
The Dashboard Table displays all of the currently deployed applications and their business processes. Click on a business process to open the Business Process Home page for that specific process.
The Business Process Home
The Business Process Home displays a real-time list of statistical information for the specific business process instance, such as how many instances are completed, running, suspended, and so on. It also displays the last time an instance was processed and the rate at which they are being processed.
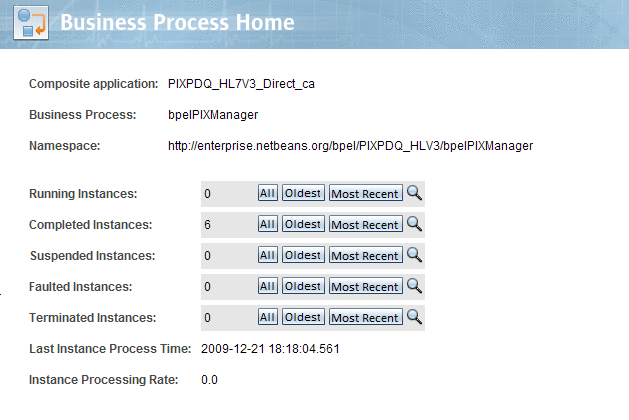
Click on All, Oldest, or Most Recent to display the selected business process instances on the Instance Home page. Click on Search Instances to open the Search Instances window.
Search Instances
The Search Instances option is available on all of the console's main windows. Click the Search icon next to an instance type to open the Search Instances window, or click Search from the main menu.
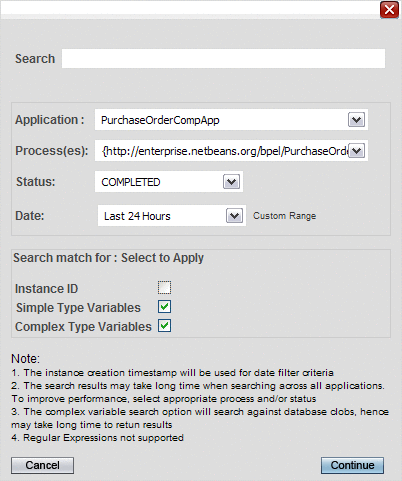
The Search Instances window allows you to search for an instance using the following criteria:
-
Application: Select from a list of currently deployed applications.
-
Process: Select any business process for the selected application.
-
Status: Select from running, completed, suspended, faulted, terminated, or all available process instances.
-
Date: Select 24 hours, 7 days, 14 days, 30 days, 1 year, or all available. You can also select Custom Range to enter your own date range.
-
Search: Enter the instance ID, or use simple or complex type variables for your search. In the lower portion of the Search Instance window, select which of those three to include in the search.
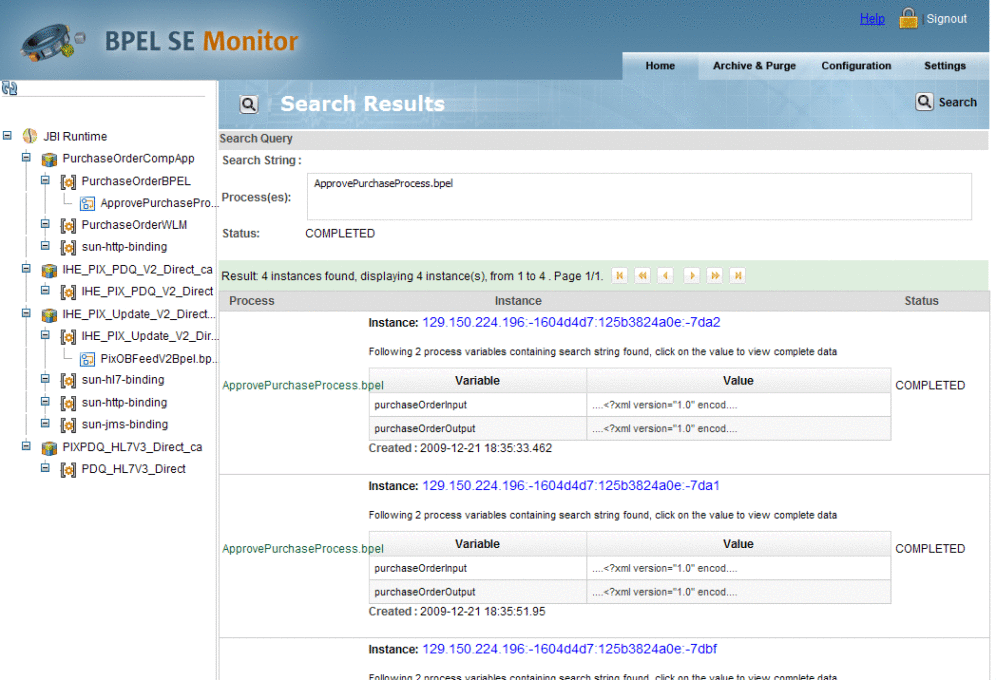
Search results appear on the Search Results window, which displays the business process instances with the following information:
-
Business Process
-
Process instance ID
-
Status
-
Variable names and values
Select the Instance ID to open the Instance Home window with the selected instance.
Instance Home
The Instance Home page displays business process instances in a table. The page also includes functionality to access any available business process instance without leaving the Instance Home page.
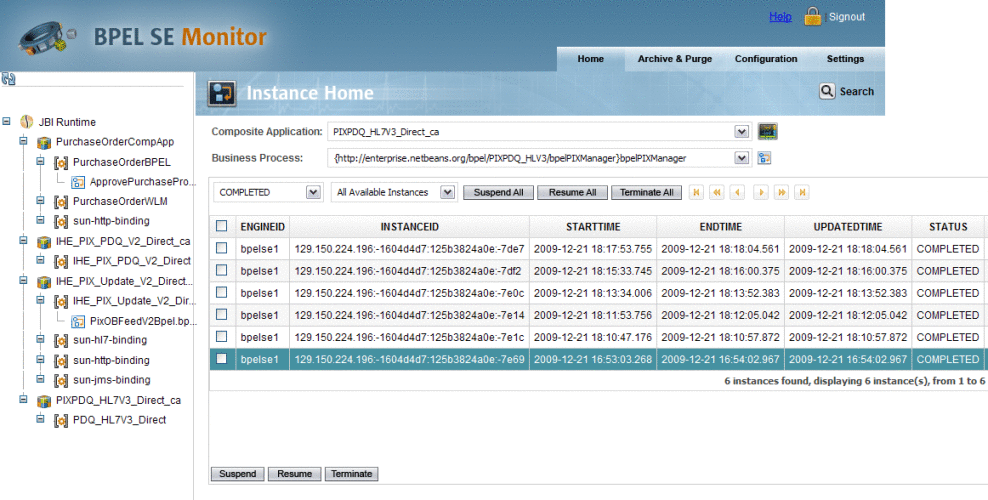
The Instance Home functionality allows you to drill down the instance list by any of the following filters:
-
Deployed Composite Application
-
Business process
-
Business process instances, filtered as:
-
Completed
-
Suspended
-
Faulted
-
Terminated
-
All available statuses
-
-
Instances, which can be further filtered as:
-
Most recent instance
-
Oldest instance
-
All available instances
-
The Instance Home page provides direct links to the Dashboard (Monitor Home) and the Business Process Home (Process Home).
View Variables
From the Instance table click View in the Variables column for an instance. The Variable Data window appears for the selected instance.
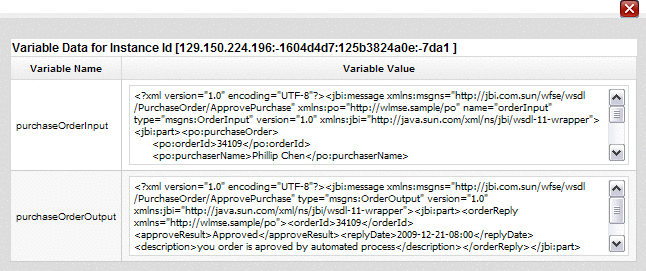
The Variable Data window displays the variable name in the first column and variable value in the second column. If the selected instance is currently running, the variable values are only displayed for those variables that are already populated.
- © 2010, Oracle Corporation and/or its affiliates
