| Skip Navigation Links | |
| Exit Print View | |

|
Sun Datacenter InfiniBand Switch 36 Topic Set |
Documentation, Support, and Training
Understanding Switch Specifications
Understanding InfiniBand Cabling
Verify Shipping Carton Contents
Install the Switch in the Rack
Verifying the InfiniBand Fabric
Understanding Administrative Commands
Monitoring the InfiniBand Fabric
Controlling the InfiniBand Fabric
Controlling the Subnet Manager
Understanding Oracle ILOM on the Switch
Understanding Oracle ILOM Targets
Installing the Oracle ILOM Firmware
Acquire the Oracle ILOM Firmware Version 1.1.3
Install the Oracle ILOM Firmware Version 1.1.3
Administering Oracle ILOM (CLI)
Accessing Oracle ILOM From the CLI
Switching Between the Oracle ILOM Shell and the Linux Shell
Monitoring Oracle ILOM Targets (CLI)
Controlling Oracle ILOM Targets (CLI)
Upgrading the Switch Firmware Through Oracle ILOM (CLI)
Administering Oracle ILOM (Web)
Access Oracle ILOM From the Web Interface
Monitoring Oracle ILOM Targets (Web)
Controlling Oracle ILOM Targets (Web)
Upgrading the Switch Firmware Through Oracle ILOM (Web)
Accessing the Rear Panel Diagram
InfiniBand Connector Status Window
Accessing Status Pane Information
Monitoring Parameters and Status
InfiniBand Connector Parameters and Status
I4 Switch Chip Port Parameters and Status
Administering Oracle ILOM (SNMP)
Monitoring Oracle ILOM Targets (SNMP)
Controlling Oracle ILOM Targets (SNMP)
Display the Sensors' State (IPMI)
Display the Sensor Information (IPMI)
Display the System Event Log (IPMI)
Display FRU ID Information (IPMI)
Display Switch Status LED States (IPMI)
Disable the Locator LED (IPMI)
Understanding Oracle ILOM Commands
Understanding Hardware Commands
Linux Shells for Hardware Commands
Understanding InfiniBand Commands
Linux Shells for InfiniBand Commands
Understanding the SUN-DCS-MIB MIB OIDs
Understanding the SUN-ILOM-CONTROL-MIB MIB OIDs
Understanding the SUN-PLATFORM-MIB MIB OIDs
The following figure provides an example of the System Info tab.

The System Info tab displays status information regarding the switch hardware. The information is categorized in the following groups:
Service Processor – Basic information about the management controller
Core IB Switch – Basic information about the I4 switch chip
Firmware – Version and build date
Chassis FRU – FRU ID information about the chassis
Power Supply FRU (0) – FRU ID information about the left power supply
Power Supply FRU (1) – FRU ID information about the right power supply
Voltage Sensor Data – Measured voltages on the main board
Power Sensor Data – Status of the power supplies
Temperature Sensor Data – Main board and I4 switch chip temperatures
Fan Sensor Data – Fan presence and speed
Chassis FRU Info – Codes, versions, dates, and part numbers for the switch chassis
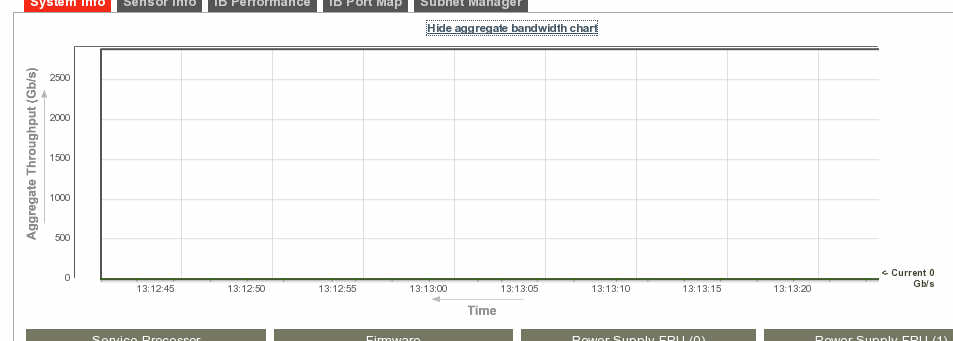
If the Poll I4 checkbox in the control panel is selected (default), then you can click Show Aggregate Bandwidth to display the historic total bandwidth. The following figure provides an example of the aggregate bandwidth.

Note - The aggregate bandwidth chart has a dynamic time scale. The scale is continually adjusting for the initiation time on the left and the current time on the right.
Clicking Hide Aggregate Bandwidth Chart removes the bandwidth chart.