|
|
| Sun ONE Directory Server Administration Guide |
This chapter describes how to monitor Directory Server by configuring a logging policy and analyzing the status information maintained by the server.
Sun ONE Directory Server provides three types of logs:
- Access Log - List the clients which connect to the server.
- Errors Log - Provides information about server errors.
- Audit Log - Gives details about access to suffixes and to the configuration.
The status information in the server includes statistics about connections and cache activity. This information is available through the Directory Server console and in monitoring entries available through the LDAP command-line tools. For information on using SNMP to monitor your server, see Chapter 13 "Monitoring Directory Server Using SNMP."
This chapter contains the following sections:
Defining Log File Policies
The following sections describe how to define your log file creation and deletion policies.
Defining a Log File Rotation Policy
If you want the directory to periodically archive the current log and start a new one, you can define a log file rotation policy from Directory Server console. You can configure the following parameters:
- The total number of logs you want the directory to keep. When the directory reaches this number of logs, it deletes the oldest log file in the folder before creating a new log. The default is 10 logs. Do not set this value to 1. If you do, the directory will not rotate the log and the log will grow indefinitely.
- The maximum size (in MB) for each log file. If you don't want to set a maximum size, type -1 in this field. The default is 100 MB. Once a log file reaches this maximum size (or the maximum age defined in the next step), the directory archives the file and starts a new one. If you set the maximum number of logs to 1, the directory ignores this attribute.
- How often the directory archives the current log file and creates a new one by entering a number of minutes, hours, days, weeks, or months. The default is every day. If you set the maximum number of logs to 1, the directory ignores this attribute.
Defining a Log File Deletion Policy
If you want the directory to automatically delete old archived logs, you can define a log file deletion policy from Directory Server console.
You can configure the following parameters:
- The maximum size of the combined archived logs. When the maximum size is reached, the oldest archived log is automatically deleted. If you don't want to set a maximum size, type -1 in this field. The default is 500 MB. This parameter is ignored in the number of log files is set to 1.
- The minimum amount of free disk space. When the free disk space reaches this minimum value, the oldest archived log is automatically deleted. The default is 5 MB. This parameter is ignored in the number of log files is set to 1.
- The maximum age of log files. When a log file reaches this maximum age, it is automatically deleted. The default is 1 month. This parameter is ignored in the number of log files is set to 1.
Manual Log File Rotation
You can manually rotate log files if you have not set automatic log file creation or deletion policies. By default, access, errors, and audit log files can be found in the following directory:
To manually rotate log files:
- Shut down the server. See "Starting and Stopping the Directory Server" for instructions.
- Move or rename the log file you are rotating in case you need the old log file for future reference.
- Restart the server. See "Starting and Stopping the Directory Server" for instructions.
The server will automatically create new files according to each log configuration.
Access Log
The access log contains detailed information about client connections to the directory.
Viewing the Access Log
- On the top-level Status tab of the Directory Server console, select Logs icon, and then select the Access Log tab in the right-hand panel.
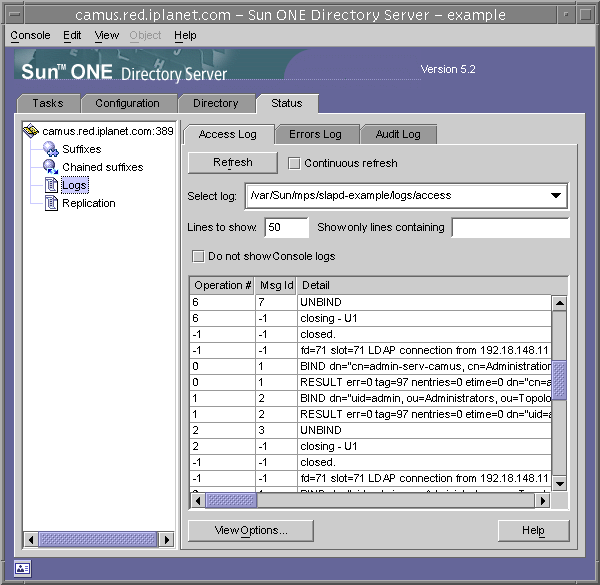
This tab displays a table containing the latest entries in the selected access log, as shown in the following figure. For an explanation of the access messages, see Chapter 8, "Access Logs and Connection Codes," in the Sun ONE Directory Server Reference Manual.
Figure 12-1 Viewing Log Contents

- To refresh the current display, click Refresh. Select the Continuous checkbox if you want the display to refresh automatically every ten seconds.
- To view a different access log file, select it from the Select Log drop-down menu.
- To display a different number of messages, enter the number you want to view in the "Lines to show" text box and then click Refresh.
- To filter the log messages you may enter a string in the "Show only lines containing" text box and then click Refresh. In addition, you may also select the Do Not Show Console Logs checkbox which will filter out any message that originated from the console's connections to the server.
- To modify the columns of the table of log entries, click View Options. Use the controls of the View Options dialog to change the order of the columns, add or remove columns, and choose a column on which to sort the table.
Configuring the Access Log
You can configure a number of settings to customize the access log, including where the directory stores the access log and the creation and deletion policies.
You can also disable access logging for the directory. You may do this because the access log can grow very quickly (every 2,000 accesses to your directory will increase your access log by approximately 1 MB). However, before you turn off access logging, consider that the access log provides beneficial troubleshooting information.
To configure the access log for your directory:
- On the top-level Configuration tab of the Directory Server console,select Logs icon, and then select the Access Log tab in the right-hand panel.
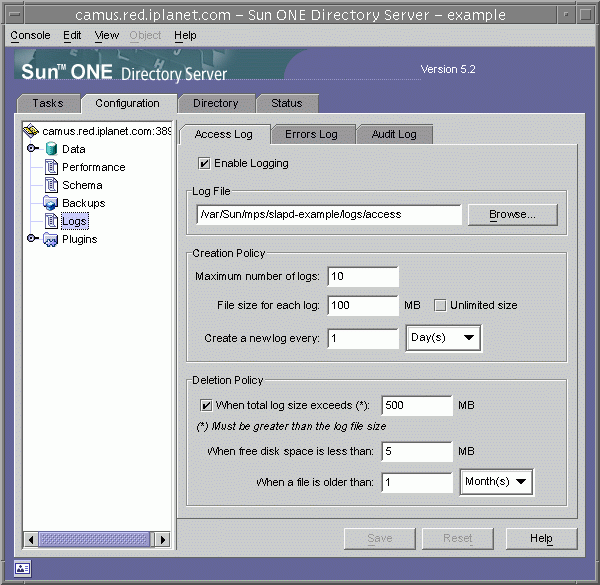
This tab contains configuration settings for the access log, as shown in the following figure:
Figure 12-2 Configuration Panel for Log File Rotation and Deletion

- To enable access logging, select the Enable Logging checkbox.
Clear this checkbox if you do not want the directory to maintain an access log.
Access logging is enabled by default.
- In the Log File field, enter the full path and filename you want the directory to use for the access log. The default is file is:
- Set the maximum number of logs, log size, and periodicity of archiving.
For information on these parameters, see "Defining a Log File Rotation Policy".
- Set the maximum size of combined archived logs, minimum amount of free disk space, and maximum age for a log file.
For information on these parameters, see "Defining a Log File Deletion Policy".
- When you have finished making changes, click Save.
Errors Log
The errors log contains detailed messages of errors and events the directory experiences during normal operations.
Viewing the Errors Log
- On the top-level Status tab of the Directory Server console, select Logs icon, and then select the Errors Log tab in the right-hand panel.
This tab displays a table containing the latest entries in the selected errors log, such as the one shown in Figure 12-1. For an explanation of error messages, see Appendix A, "Error Codes," in the Sun ONE Directory Server Reference Manual.
- To refresh the current display, click Refresh. Select the Continuous checkbox if you want the display to refresh automatically every ten seconds.
- To view an archived errors log, select it from the Select Log pull-down menu.
- To specify a different number of messages, enter the number you want to view in the "Lines to show" text box and click Refresh.
- To filter the log messages you may enter a string in the "Show only lines containing" text box and then click Refresh. In addition, you may also select the Do Not Show Console Logs checkbox which will filter out any error message that originated from the console's connections to the server.
- To modify the columns of the table of log entries, click View Options. Use the controls of the View Options dialog to change the order of the columns, add or remove columns, and choose a column on which to sort the table.
Configuring the Errors Log
You can change several settings for the errors log, including where the directory stores the log and what you want the directory to include in the log.
To configure the errors log:
- On the top-level Configuration tab of the Directory Server console, select Logs icon, and then select the Errors Log tab in the right-hand panel.
This tab contains configuration settings for the errors log, such as those shown in Figure 12-2.
- To enable error logging, select the Enable Logging checkbox.
Clear this checkbox if you do not want the directory to maintain an errors log.
Error logging is enabled by default.
- If you want to set the level of detail in the errors log, click the Log Level button to display the Errors Log Level dialog. Select one or more internal product components for which you want more error and debugging information. Optionally, select the Verbose checkbox to return the maximum amount of runtime output, including trivial messages.
Changing these values from the defaults may cause your errors log to grow very rapidly, so you must plan to have plenty of disk space. It is recommended that you do not change your logging level unless you are asked to do so by Sun ONE Customer Support.
- In the Log File field, enter the full path and filename you want the directory to use for the errors log. The default is file is:
- Set the maximum number of logs, log size, and periodicity of archiving.
For information on these parameters, see "Defining a Log File Rotation Policy".
- Set the maximum size of combined archived logs, minimum amount of free disk space, and maximum age for a log file.
For information on these parameters, see "Defining a Log File Deletion Policy".
- When you have finished making changes, click Save.
Audit Log
The audit log contains detailed information about changes made to each suffix as well as to server configuration. Unlike the access log and errors log, the audit log is not enabled by default. Before viewing the log, you must enable it.
Configuring the Audit Log
You can use the Directory Server console to enable and disable audit logging and to specify where the audit log file is stored.
To configure the audit log:
- On the top-level Configuration tab of the Directory Server console,select Logs icon, and then select the Audit Log tab in the right-hand panel.
This tab contains configuration settings for the audit log, such as those shown in Figure 12-2.
- To enable audit logging, select the Enable Logging checkbox.
To disable audit logging, clear the checkbox. By default, audit logging is disabled.
- In the Log File field, enter the full path and filename you want the directory to use for the audit log. The default is file is:
- Set the maximum number of logs, log size, and periodicity of archiving.
For information on these parameters, see "Defining a Log File Rotation Policy".
- Set the maximum size of combined archived logs, minimum amount of free disk space, and maximum age for a log file.
For information on these parameters, see "Defining a Log File Deletion Policy".
- When you have finished making changes, click Save.
Viewing the Audit Log
- On the top-level Status tab of the Directory Server console, select Logs icon, and then select the Audit Log tab in the right-hand panel.
This tab displays a table containing the latest entries in the selected audit log, such as the one shown in Figure 12-1..
- To refresh the current display, click Refresh. Select the Continuous checkbox if you want the display to refresh automatically every ten seconds.
- To view an archived audit log, select it from the Select Log pull-down menu.
- To display a different number of messages, enter the number you want to view in the "Lines to show" text box and click Refresh.
- To filter the log messages you may enter a string in the "Show only lines containing" text box and then click Refresh.
Monitoring Server Activity
The server always maintains counters and statistics about its activity, for example the number of connection and operations and cache activity for all suffixes. This information can help you troubleshoot any errors and observe the performance of your server. You can monitor your directory server's current activities from either the Directory Server Console or the command line.
Many of the parameters that can be monitored reflect your Directory Server performance and my be influenced by configuration and tuning. For more information about the configurable attributes and how to tune them, see the Sun ONE Directory Server Installation and Tuning Guide.
Monitoring Your Server Using the Console
- On the top-level Status tab of the Directory Server console, select server icon at the root of the status tree.
The right-hand panel displays current information about server activity. If the server is currently not running, this tab will not provide performance monitoring information.
- Click Refresh to refresh the current display. If you want the server to continuously update the displayed information, select the Continuous checkbox.
This server status panel shows:
- The date and time the server was started.
- The current date and time on server. When replication is enabled, you should periodically check that the dates on each server do not begin to diverge.
- The Resource Summary Table. For each of the following resources, the table lists the total number since startup and the average per minute since startup.
- The Current Resource Usage Table. This table shows the following resources that were in use when the panel was last refreshed.
- The Connection Status Table. This table shows the following information about each currently open connection.
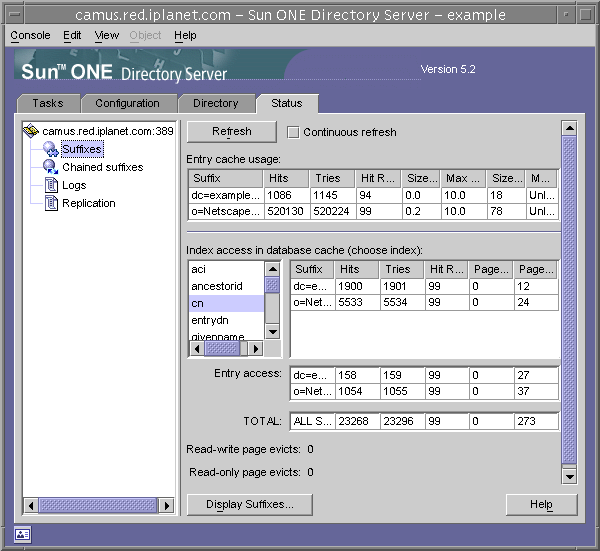
- Click on the Suffixes node in the left-hand status tree. This panel displays monitoring information about the entry cache and index usage in the database cache of each suffix, as shown in the following figure.
Figure 12-3 Suffix Monitoring Panel

Set the refresh mode if desired. Click on Display Suffixes at the bottom of the panel to select which suffixes will be listed in the tables.
The first table shows the following information about each entry cache.
The following tables show access to the database cache of each suffix.
The first table shows the access to the database cache through the configured indexes. From the list of attribute names, select the one for which you wish to see index statistics. The table will show data only for suffixes in which the chosen attribute is indexed.
The Entry Access table shows access to the database caches to retrieve entries.
The Totals in the last table show all combined access to all database caches.
All three tables have the following columns:
Below the tables, the following page evicts are cumulative for all database caches. Pages discarded from the cache have to be written to disk, possibly affecting server performance. The lower the number of page evicts, the better:
- Read-write page evicts - Indicates the number of read-write pages discarded from the cache to make room for new pages. This value differs from Pages Written Out in that these are discarded read-write pages that have not been modified.
- Read-only page evicts - Indicates the number of read-only pages discarded from the caches to make room for new pages.
If applicable, click on the Chained Suffixes node in the left-hand status tree. This panel displays information about access to the chained suffixes configured in your directory. Set the refresh mode if desired.
Select the DN of a chained suffix in the list to view its statistics. The table to the right lists the count of all different operations performed on the chained suffix.
Monitoring Your Server From the Command Line
You can monitor your directory server's current activities from any LDAP client by performing a search operation on the following entries:
- cn=monitor
- cn=monitor, cn=ldbm database, cn=plugins, cn=config
- cn=monitor,cn=dbName,cn=ldbm database,cn=plugins,cn=config
- cn=monitor,cn=dbName,cn=chaining database,cn=plugins,cn=config
where dbName is the database name of the suffix that you want to monitor. Note that except for information about each connection, by default, the cn=monitor entry is readable by anyone, including clients bound anonymously.
The following example shows how to view the general server statistics:
-s base -b "cn=monitor" "(objectclass=*)"For the description of all monitoring attributes available in these entries, please see to the corresponding section of the Sun ONE Directory Server Reference Manual:
- "Monitoring Attributes" in Chapter 4
- "Database Monitoring Attributes" in Chapter 5
- "Database Monitoring Attributes under cn=dbName" in Chapter 5
- "Chained Suffix Monitoring Attributes" in Chapter 5